Asahi shares mark weekly slide after cyberattack halts production

Introduction & Market Context
GEO Group Inc (NYSE:GEO) released its second quarter 2025 supplemental information on August 6, showing a significant turnaround from its disappointing first quarter results. The company’s shares, which had dropped nearly 8% following Q1 earnings, have since recovered, trading at $25.84 at previous close with a 3.78% gain. In premarket trading, the stock continued its upward trajectory, rising 2.17% to $26.40.
The correctional facilities operator has demonstrated resilience after missing both revenue and EPS expectations in Q1 2025, when it reported earnings of $0.14 per share against forecasts of $0.19. The Q2 presentation reveals the company’s efforts to regain investor confidence through improved operational performance and strategic capital allocation.
Quarterly Performance Highlights
GEO Group reported Q2 2025 revenue of $636.2 million, representing a 4.8% increase compared to $607.2 million in the same period last year. More significantly, the company returned to profitability with net income of $29.1 million, a substantial improvement from the $32.5 million loss recorded in Q2 2024.
As shown in the following consolidated statement of operations, the company has demonstrated considerable year-over-year improvement in its bottom line, though operating income decreased slightly:
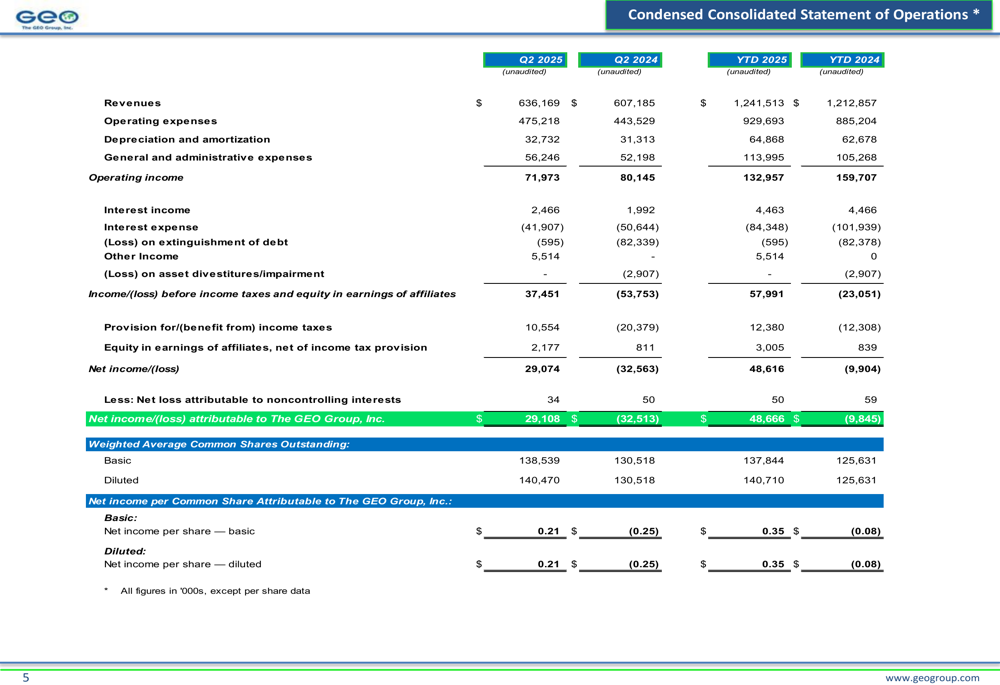
The company’s adjusted EBITDA reached $118.6 million for Q2 2025 and $218.4 million for the first half of the year, supporting GEO’s full-year guidance. Net Operating Income (NOI) remained relatively stable at $171.3 million compared to $168.2 million in Q2 2024.
Detailed Financial Analysis
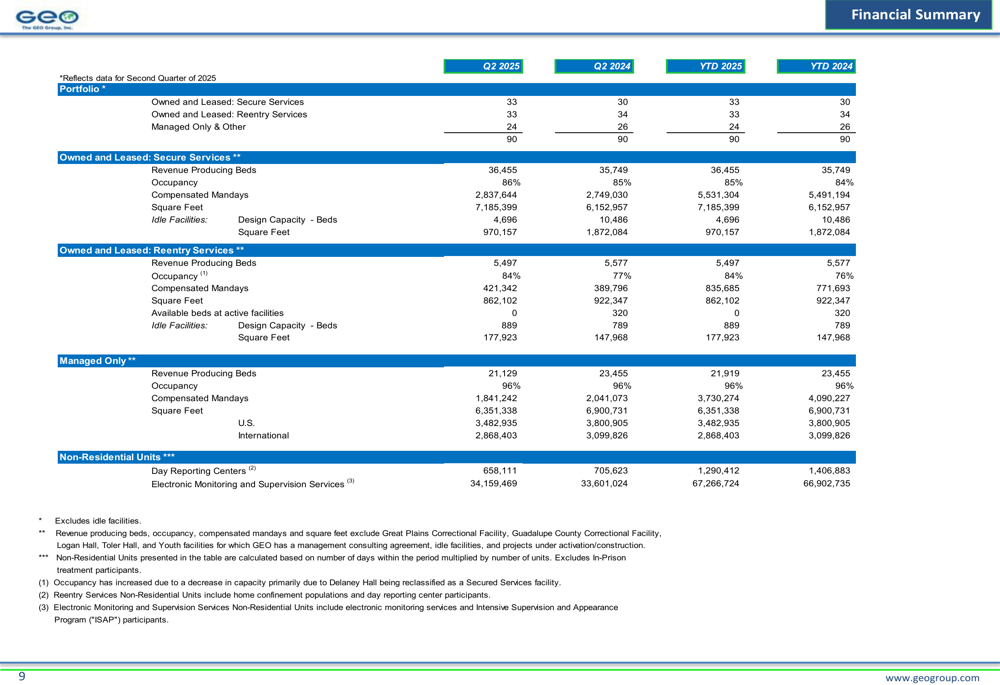
GEO Group’s portfolio performance has been bolstered by strong occupancy rates across its facilities. The company’s owned and leased secure services maintained 86% occupancy, while managed-only facilities achieved an impressive 96% occupancy rate. These metrics highlight the company’s operational efficiency and stable demand for its services.
The following portfolio overview illustrates the company’s bed capacity and occupancy rates across different segments:
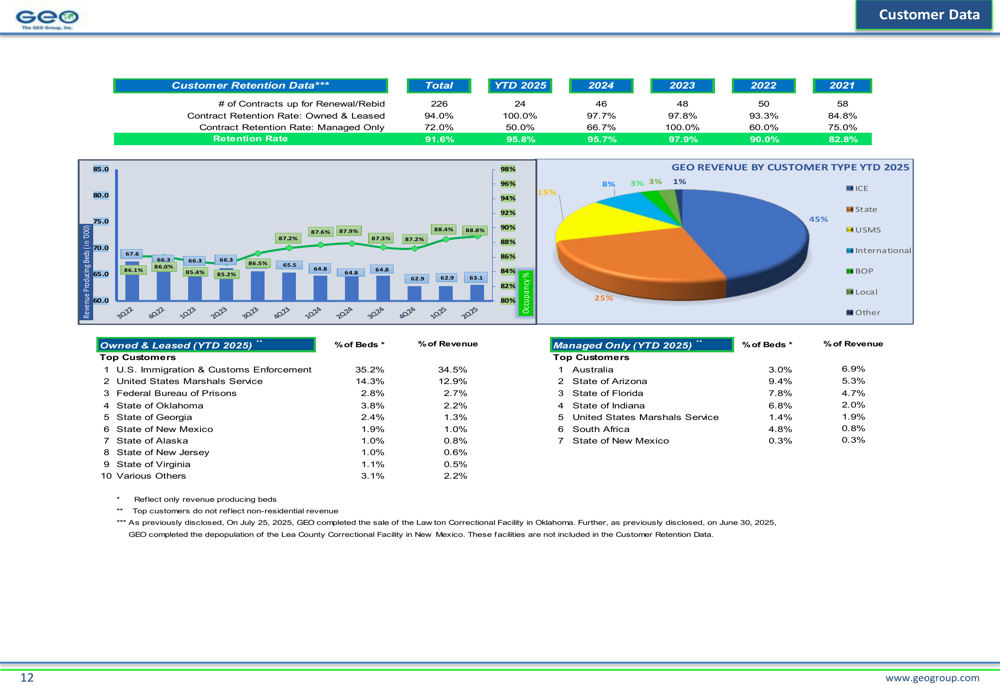
Revenue diversification remains a key strength for GEO Group, with state customers representing the largest portion at 45% of total revenue, followed by the U.S. Marshals Service (USMS) at 25% and Immigration and Customs Enforcement (ICE) at 15%. This diversified customer base provides stability and mitigates concentration risk.
The customer retention rate stands at 94.0% for YTD 2025, showing a slight decline from 97.7% in 2024, which may warrant monitoring in future quarters. The following chart breaks down revenue by customer type and illustrates retention trends:
Strategic Initiatives
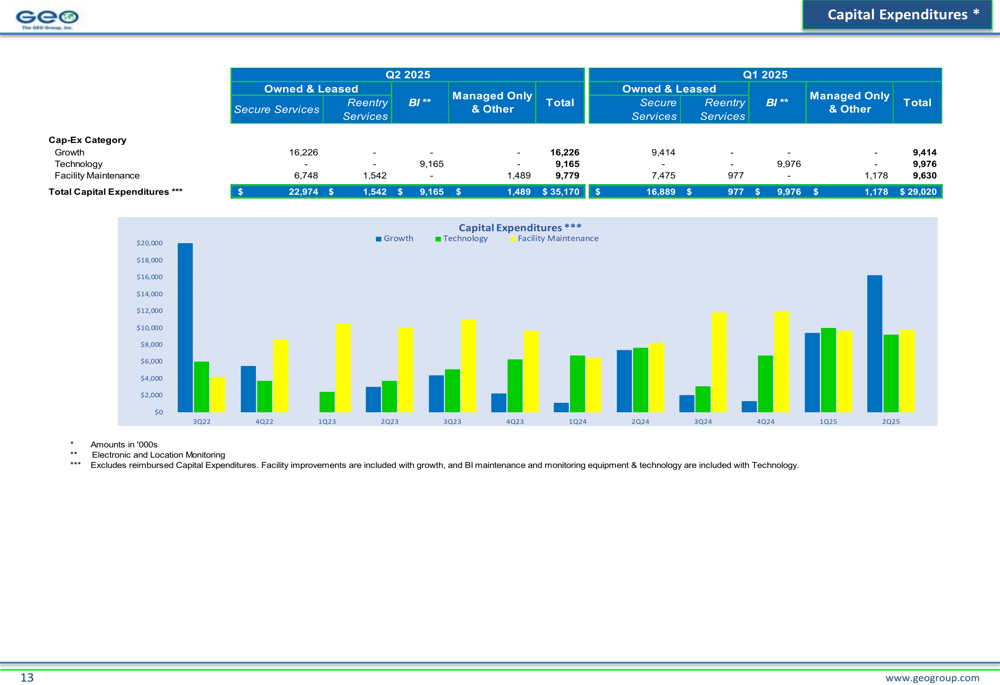
GEO Group continues to invest in growth initiatives, technology enhancements, and facility maintenance. In Q2 2025, the company allocated $35.2 million to capital expenditures, with $16.2 million directed toward growth projects, $9.2 million to technology, and $9.8 million to facility maintenance.
The following capital expenditure breakdown shows the company’s investment priorities:
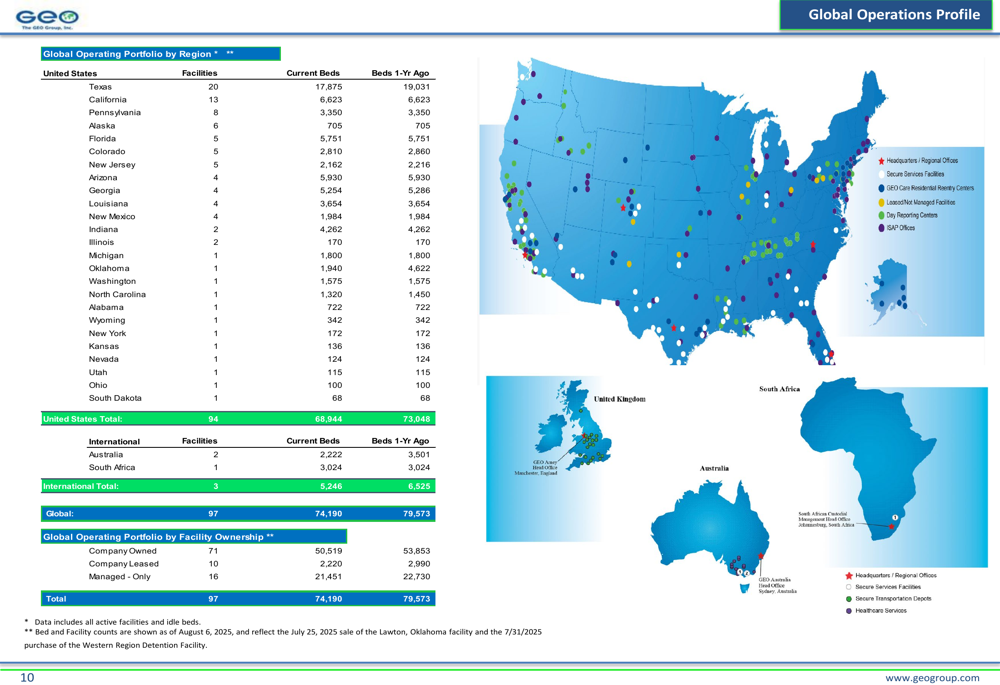
The company’s global footprint spans 97 facilities across the United States, Australia, and South Africa, with a total capacity of approximately 74,000 beds. This extensive network positions GEO Group as a leading provider of correctional and detention services globally.
As illustrated in the global operations profile, the company maintains a diverse portfolio of owned and managed facilities:
Debt Management and Financial Position
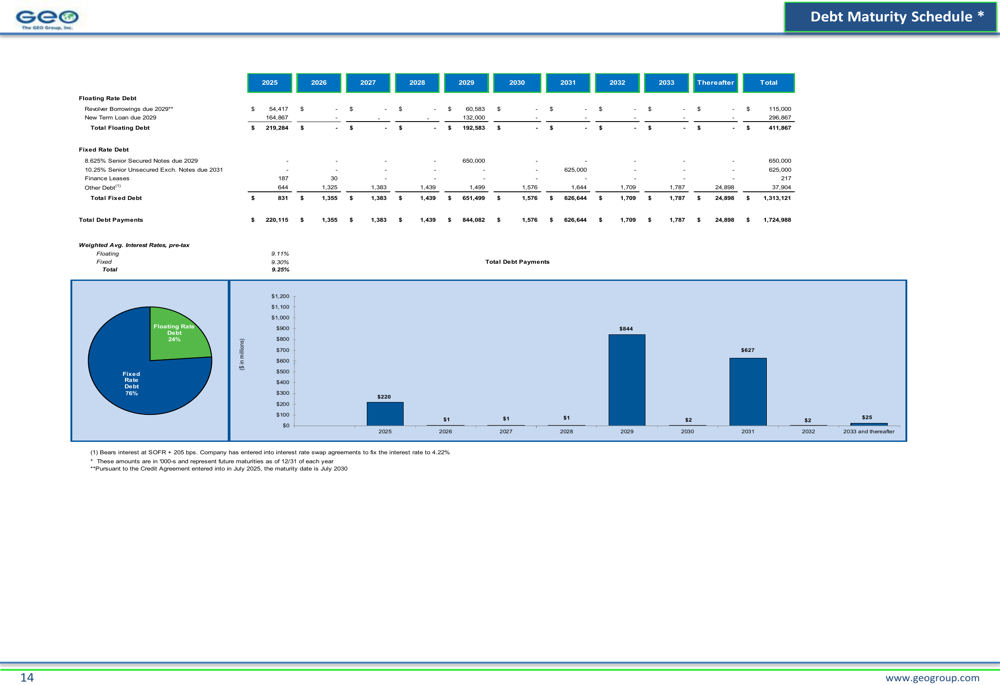
GEO Group’s debt management strategy focuses on balancing fixed and floating rate obligations. As of June 30, 2025, the company reported total debt of $1.72 billion, with 76% at fixed rates (average 9.30%) and 24% at floating rates (average 9.11%).
The debt maturity schedule shows manageable near-term obligations with $220.1 million due in 2025:
The company’s balance sheet remains relatively stable with total assets of $3.66 billion as of June 30, 2025, compared to $3.63 billion at the end of 2024. Total (EPA:TTEF) shareholders’ equity increased to $1.38 billion from $1.33 billion over the same period, reflecting the improved profitability in recent quarters.
Forward-Looking Statements
GEO Group maintains its 2025 financial guidance with projected revenue between $2.55 billion and $2.58 billion, net income attributable to GEO between $280 million and $295 million, and adjusted EBITDA between $465 million and $490 million. This outlook suggests confidence in continued operational improvements following the Q1 earnings miss.
The company’s 2025 guidance and corporate profile are detailed below:
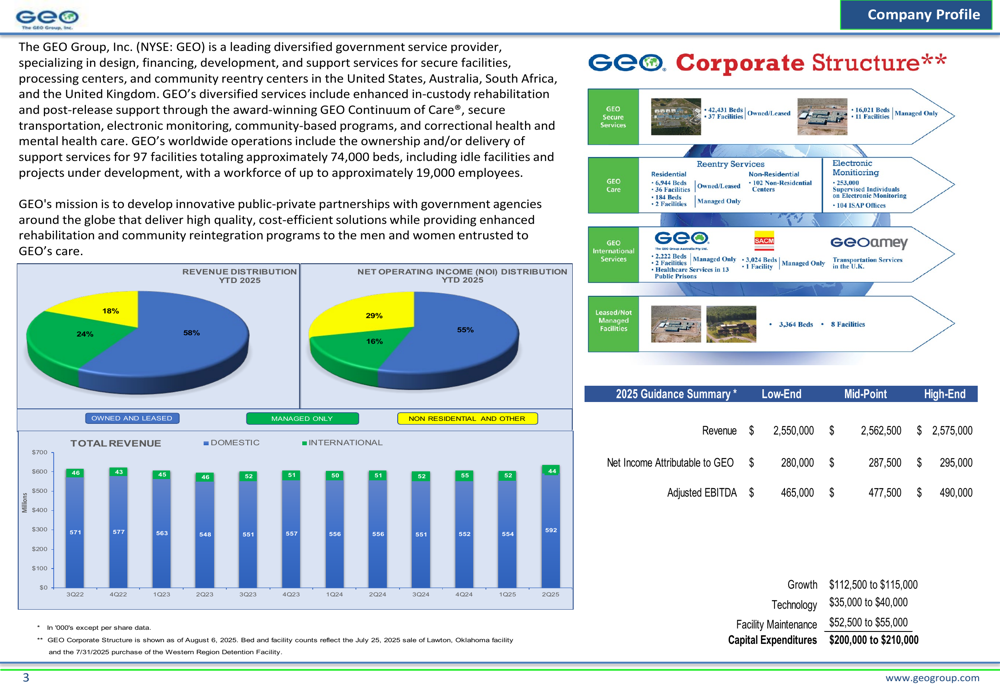
Capital expenditures for 2025 are expected to range between $200 million and $210 million, with allocations to growth initiatives ($112.5-$115 million), technology investments ($35-$40 million), and facility maintenance ($52.5-$55 million).
After a challenging first quarter that saw increased operating and administrative expenses impacting profitability, GEO Group’s second quarter results indicate that the company is back on track to meet its full-year targets. The continued focus on high occupancy rates and strategic capital allocation should support sustainable growth as the company navigates its competitive landscape in government-contracted correctional and detention services.
Full presentation:
This article was generated with the support of AI and reviewed by an editor. For more information see our T&C.