TPI Composites files for Chapter 11 bankruptcy, plans delisting from Nasdaq

Introduction & Market Context
Golub Capital BDC, Inc. (NASDAQ:GBDC) released its earnings presentation for the second quarter of fiscal year 2025, ended March 31, 2025. The business development company maintained stable net investment income despite facing headwinds that resulted in a slight decrease in net asset value (NAV).
GBDC shares closed at $14.13 on May 5, 2025, trading at approximately a 6% discount to the reported NAV of $15.04 per share. The stock has traded between $12.68 and $16.96 over the past 52 weeks, with premarket activity on May 6 showing a 1.2% increase to $14.30.
Quarterly Performance Highlights
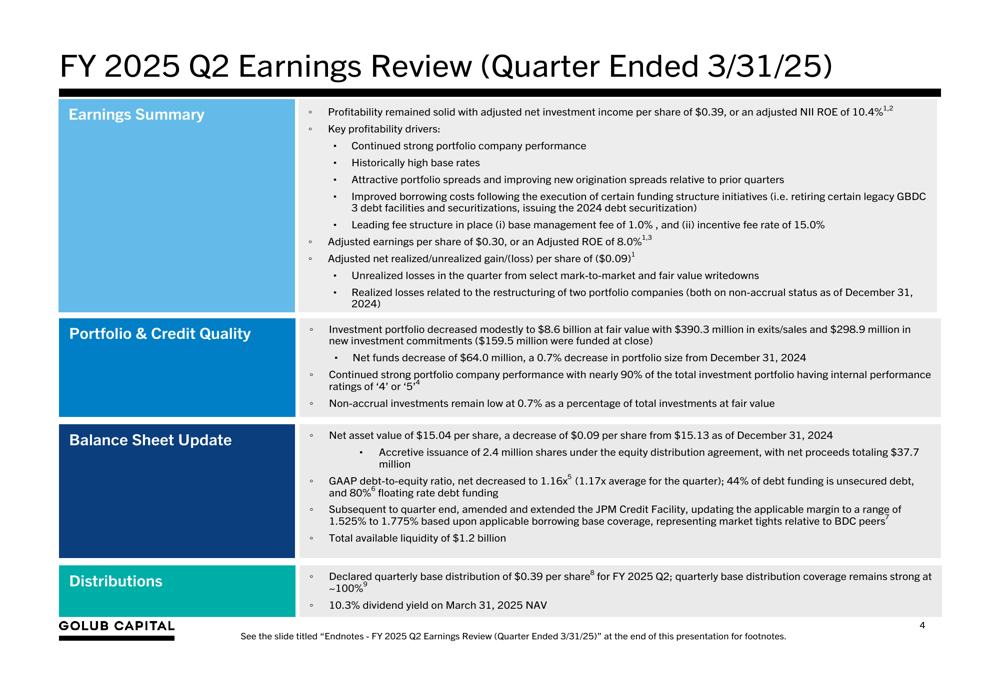
GBDC reported adjusted net investment income (NII) of $0.39 per share for Q2 2025, representing an annualized return on equity of 10.4%. This income fully covered the company’s quarterly base distribution of $0.39 per share. However, adjusted earnings per share declined to $0.30 from $0.42 in the previous quarter, primarily due to net realized and unrealized losses.
As shown in the following comprehensive earnings summary:
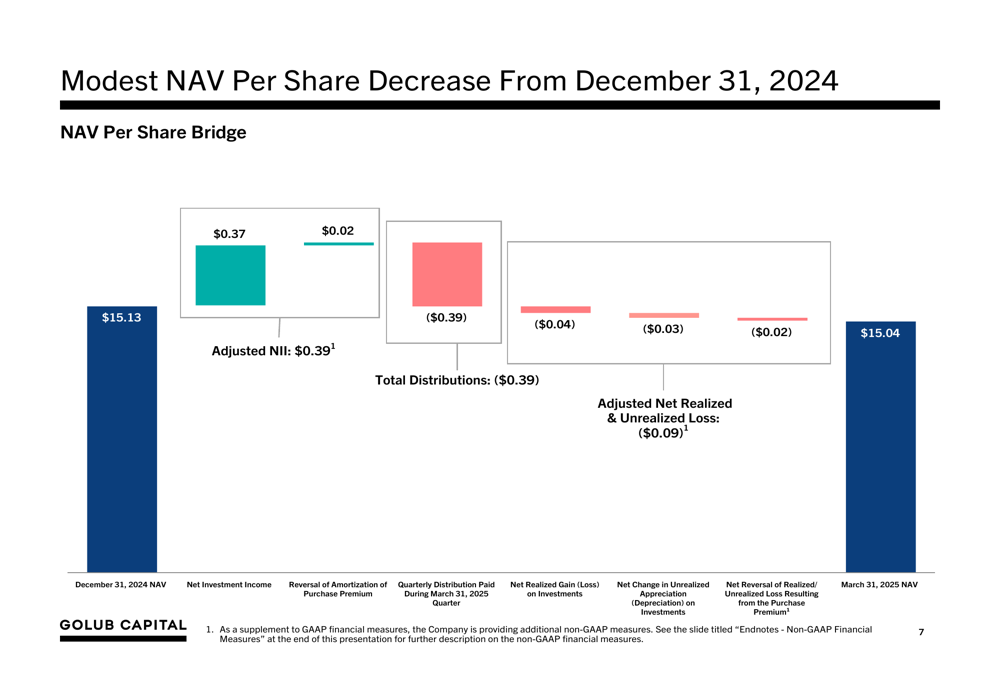
The company’s net asset value decreased slightly from $15.13 per share as of December 31, 2024, to $15.04 per share as of March 31, 2025. This $0.09 decline can be attributed to the net realized and unrealized losses of $0.09 per share during the quarter, as illustrated in this NAV bridge:
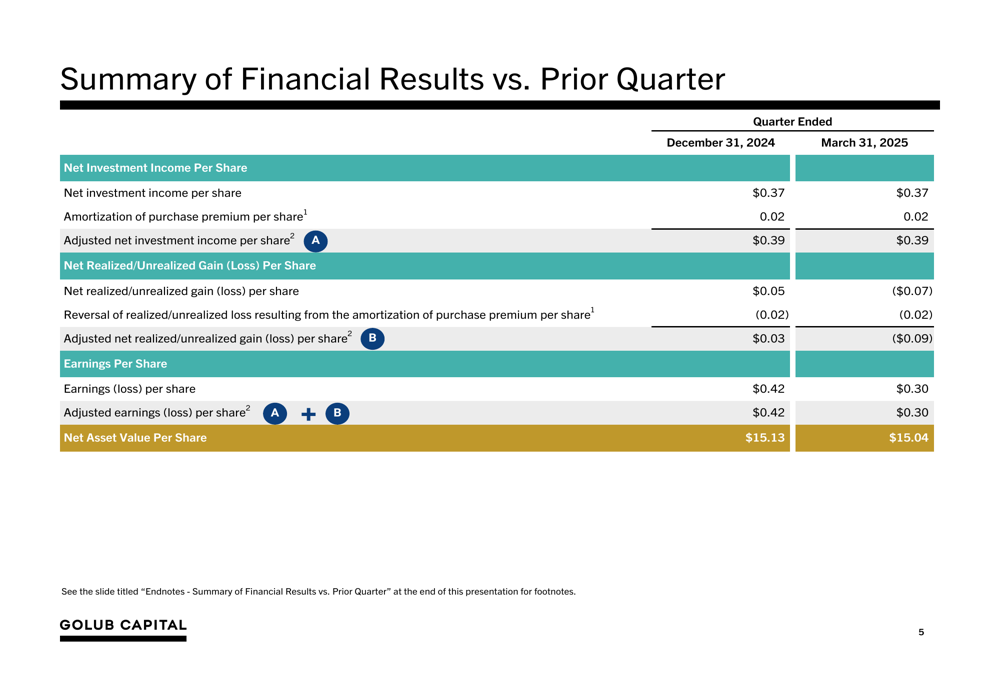
Quarter-over-quarter comparisons show stability in net investment income but a shift from gains to losses in the realized/unrealized component:
Portfolio Composition and Credit Quality
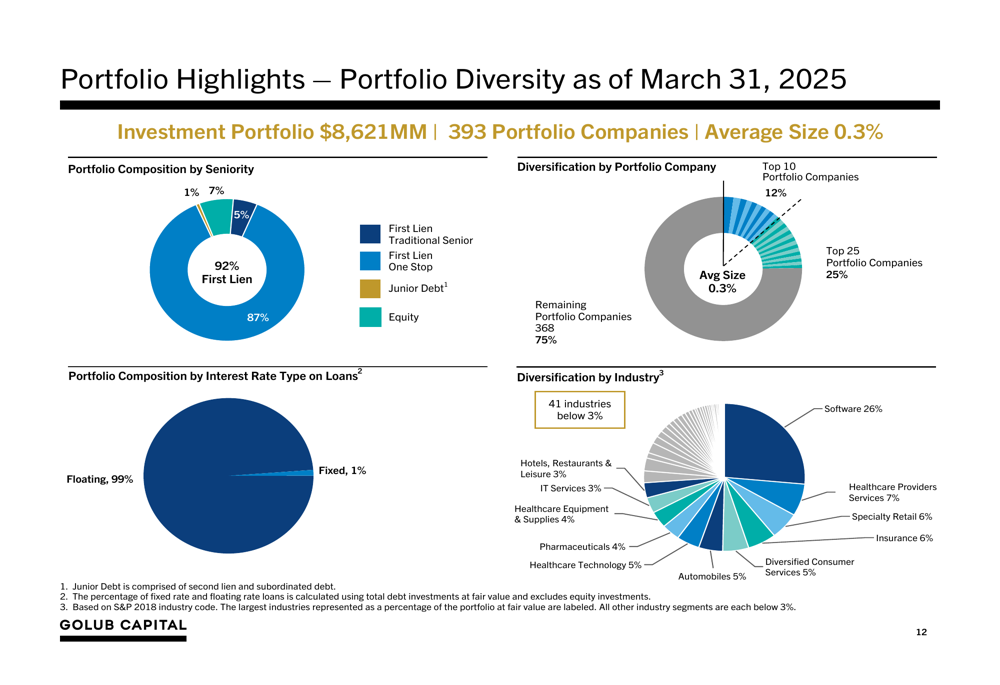
GBDC’s investment portfolio stood at $8.6 billion as of March 31, 2025, representing a slight decrease of 0.7% ($64 million) from the previous quarter. The portfolio remains highly diversified across 393 companies with an average investment size of just 0.3% of the total portfolio.
The portfolio maintains a conservative risk profile with over 85% of investments in first lien senior secured loans. Software (ETR:SOWGn) companies represent the largest industry concentration at 26%, followed by healthcare providers services at 7%.
The following chart illustrates the portfolio’s diversity by both seniority and industry:
Credit quality remained strong, with nearly 90% of investments at fair value having an Internal Performance Rating of 4 or higher. Non-accrual investments remained low at 0.7% of total investments at fair value, indicating minimal credit issues within the portfolio.
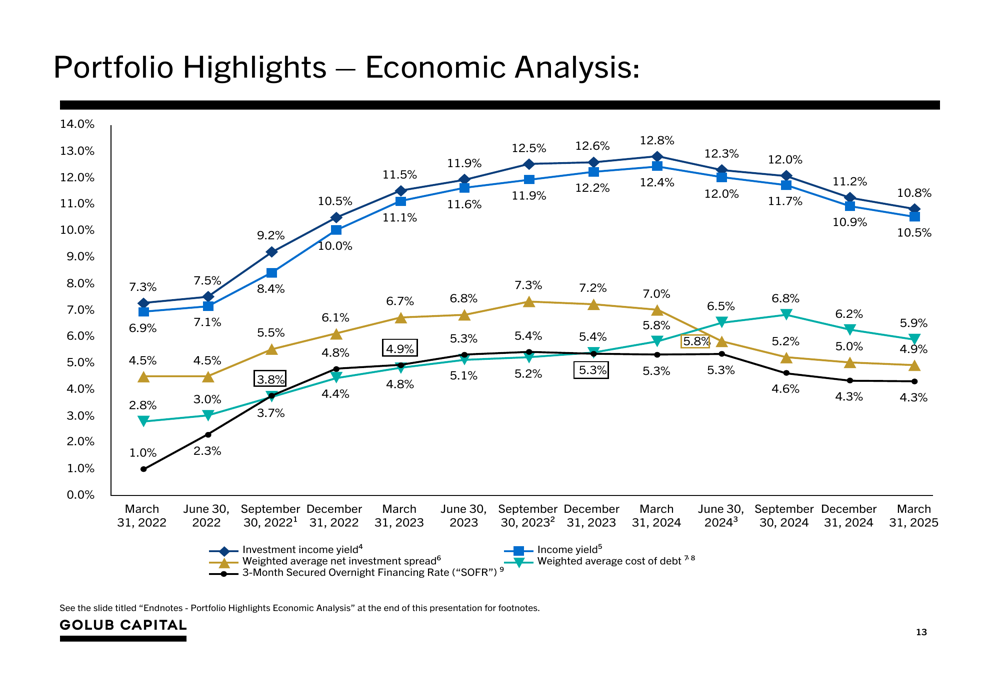
The economic analysis of the portfolio shows the trends in investment income yield, income yield, weighted average net investment spread, and weighted average cost of debt:
Balance Sheet and Liquidity
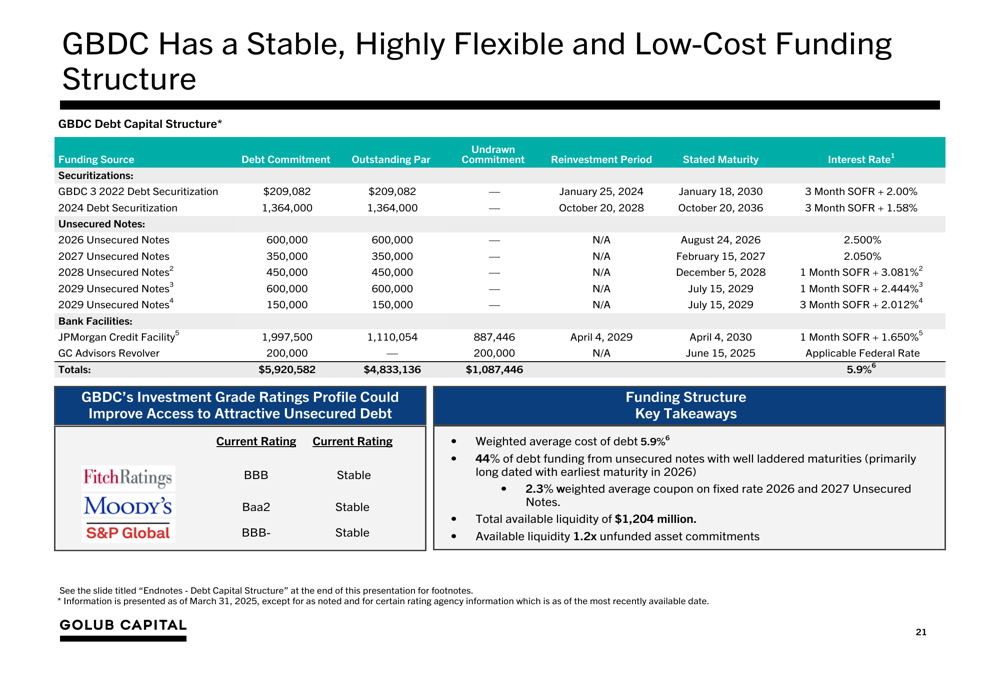
GBDC maintained a strong liquidity position with approximately $1.2 billion in total available liquidity as of March 31, 2025. This includes $116.9 million in unrestricted cash and cash equivalents, $129.5 million in restricted cash, and $887.4 million of remaining commitments and availability on the company’s $1,997.5 million revolving credit facility with JPMorgan.
The company has a well-structured debt profile with a weighted average cost of debt of 5.9%. The debt capital structure is detailed below:
Dividend and Shareholder Returns
GBDC declared a quarterly base distribution of $0.39 per share, maintaining a 100% coverage ratio based on adjusted net investment income. This represents a 10.3% dividend yield based on the March 31, 2025 NAV.
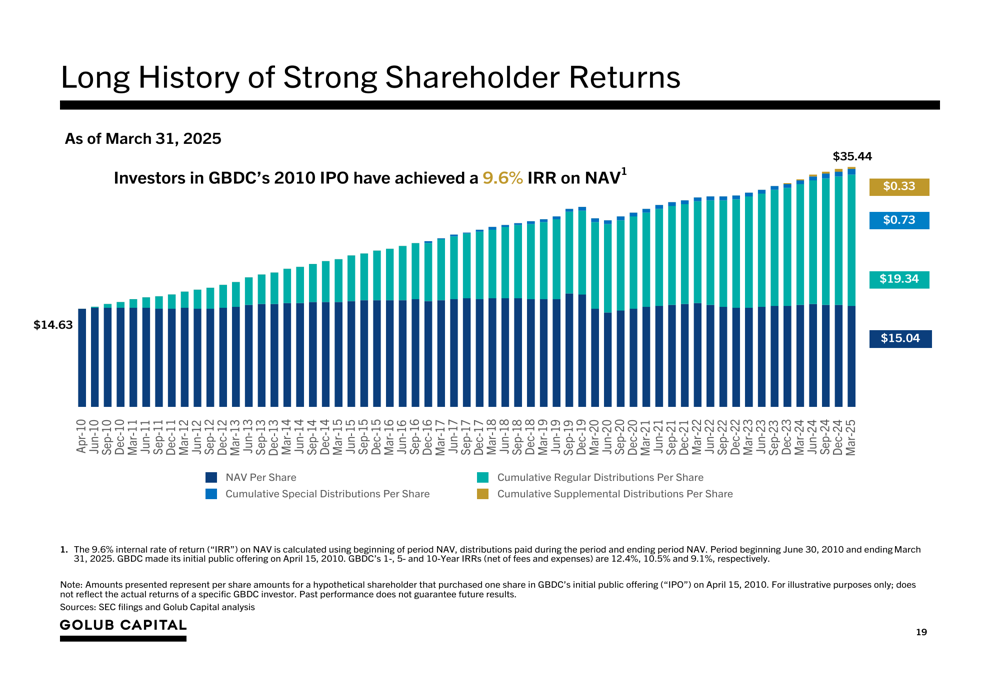
The company has a long history of delivering strong shareholder returns since its IPO in 2010, with investors achieving a 9.6% internal rate of return (IRR) on NAV. Cumulative distributions have reached $19.34 per share, significantly exceeding the current NAV of $15.04.
The following chart illustrates GBDC’s history of shareholder returns since its IPO:
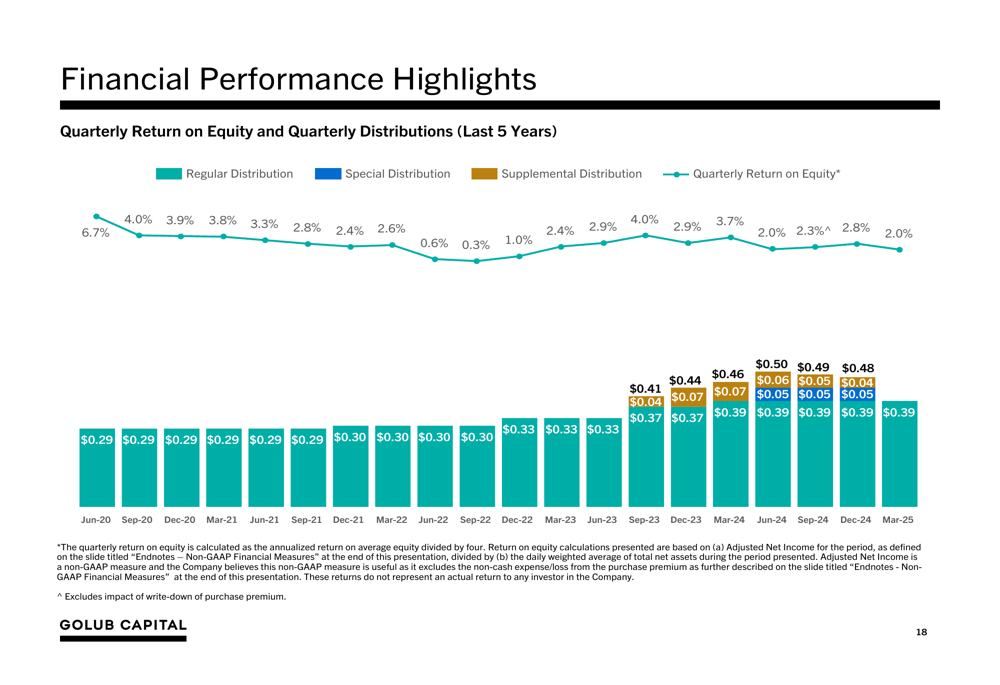
The company’s five-year financial performance highlights show consistent returns on equity and regular distributions:
Forward-Looking Statements
While GBDC did not provide explicit forward guidance in the presentation, the company’s focus remains on maintaining its high-quality, first-lien-focused investment strategy. With substantial available liquidity, GBDC is well-positioned to take advantage of new investment opportunities while managing any potential credit challenges.
The company’s stable net investment income, full dividend coverage, and strong liquidity position provide a solid foundation for navigating the current economic environment. However, investors should note the recent trend of net realized and unrealized losses, which could impact total returns if they persist in future quarters.
GBDC’s trading discount to NAV may present an opportunity for investors seeking exposure to a well-established business development company with a long track record of delivering consistent income and total returns to shareholders.
Full presentation:
This article was generated with the support of AI and reviewed by an editor. For more information see our T&C.