Stellantis Expands EV Charging Access with Tesla Supercharger Network Integration

Introduction & Market Context
GrafTech International Ltd (NYSE:EAF) presented its third quarter 2025 results on October 24, highlighting operational improvements amid challenging market conditions. The graphite electrode manufacturer continues to navigate industry headwinds while positioning itself for future growth in electric arc furnace (EAF) steelmaking and potential battery materials markets.
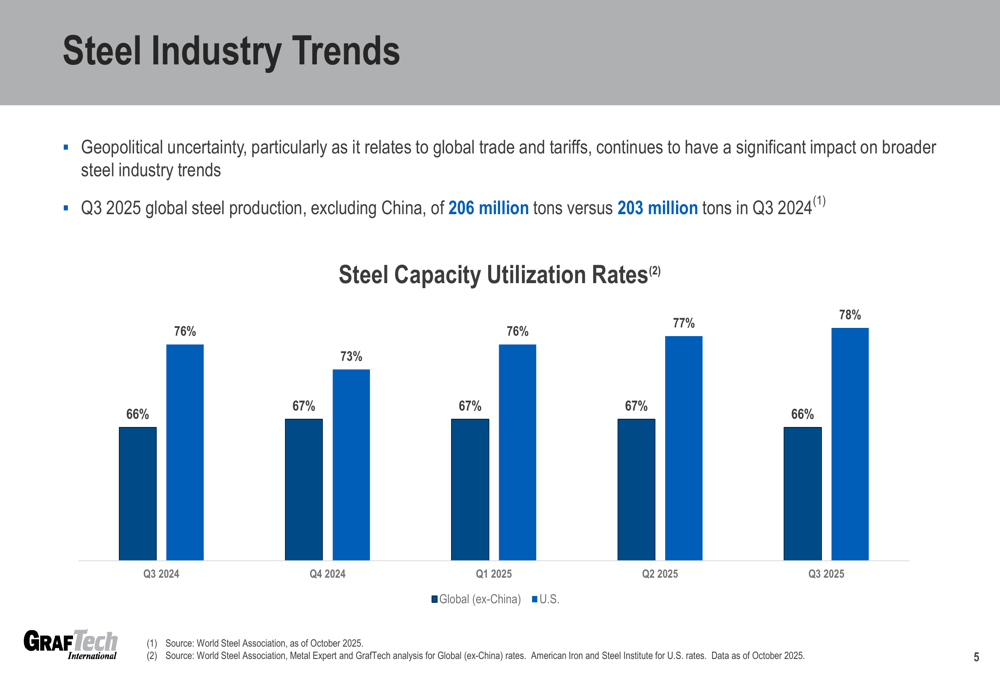
Global steel production excluding China reached 206 million tons in Q3 2025, showing modest growth from 203 million tons in Q3 2024. Steel capacity utilization rates remained at 66% globally (excluding China), while the U.S. market maintained a stronger 78% utilization rate.
As shown in the following chart of steel industry trends, geopolitical uncertainty continues to impact the broader steel industry:
Despite these challenges, GrafTech's stock showed resilience, with a premarket increase of 9.26% following the earnings announcement, reaching $18.99. This positive reaction came despite a significant earnings per share miss, suggesting investors are focusing on operational improvements and future potential rather than current bottom-line results.
Quarterly Performance Highlights
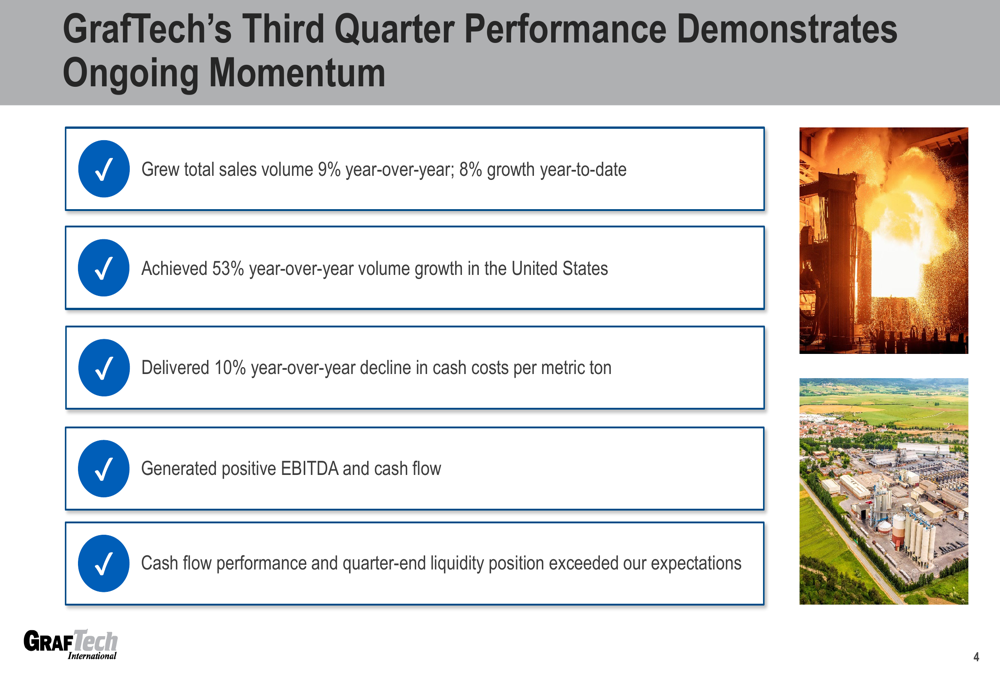
GrafTech reported several positive operational metrics for Q3 2025, including a 9% year-over-year increase in sales volume and a 10% increase in net sales compared to Q3 2024. The company achieved particularly strong growth in the United States, with a 53% year-over-year volume increase.
The following slide highlights key performance achievements for the quarter:
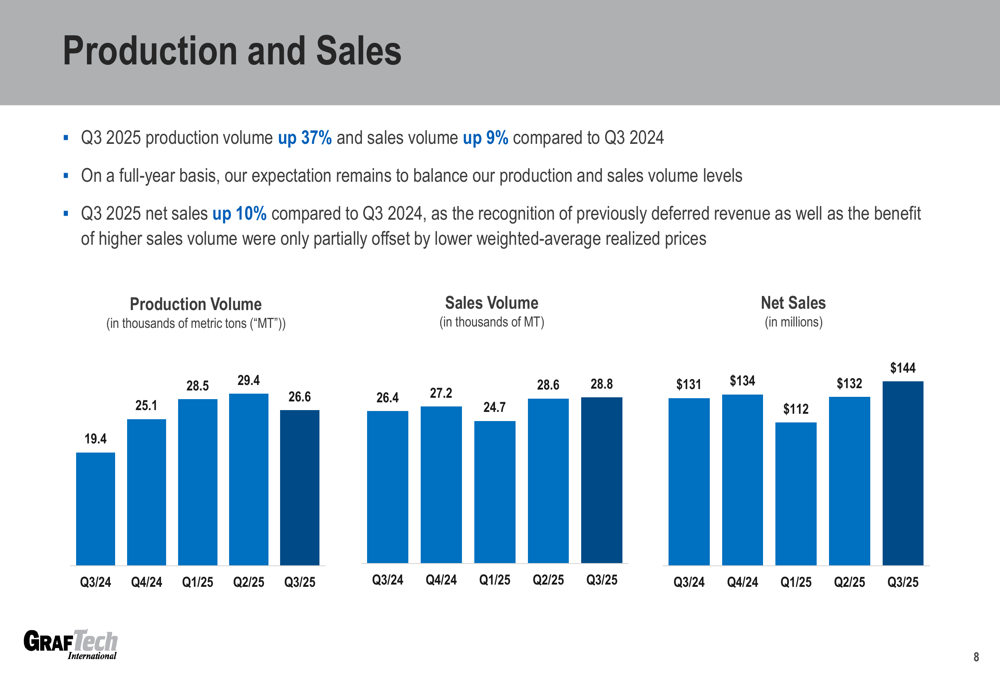
Production volume increased significantly by 37% compared to Q3 2024, while sales volume grew 9% year-over-year. Net sales reached $144 million, up from $131 million in the same period last year, primarily due to the recognition of previously deferred revenue.
The following chart illustrates the trends in production volume, sales volume, and net sales over recent quarters:
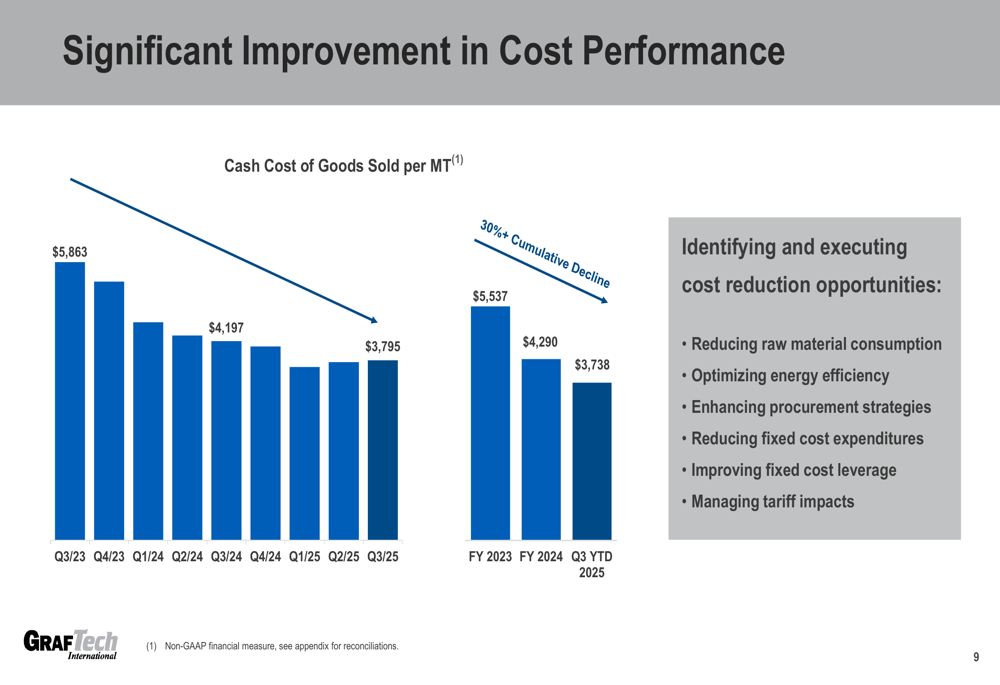
GrafTech has made substantial progress in reducing its cost structure, with cash cost of goods sold per metric ton declining 10% year-over-year. The company has achieved a cumulative decline of over 30% through various cost reduction initiatives.
As shown in the following cost performance chart, GrafTech has implemented multiple strategies to improve its cost structure:
Detailed Financial Analysis
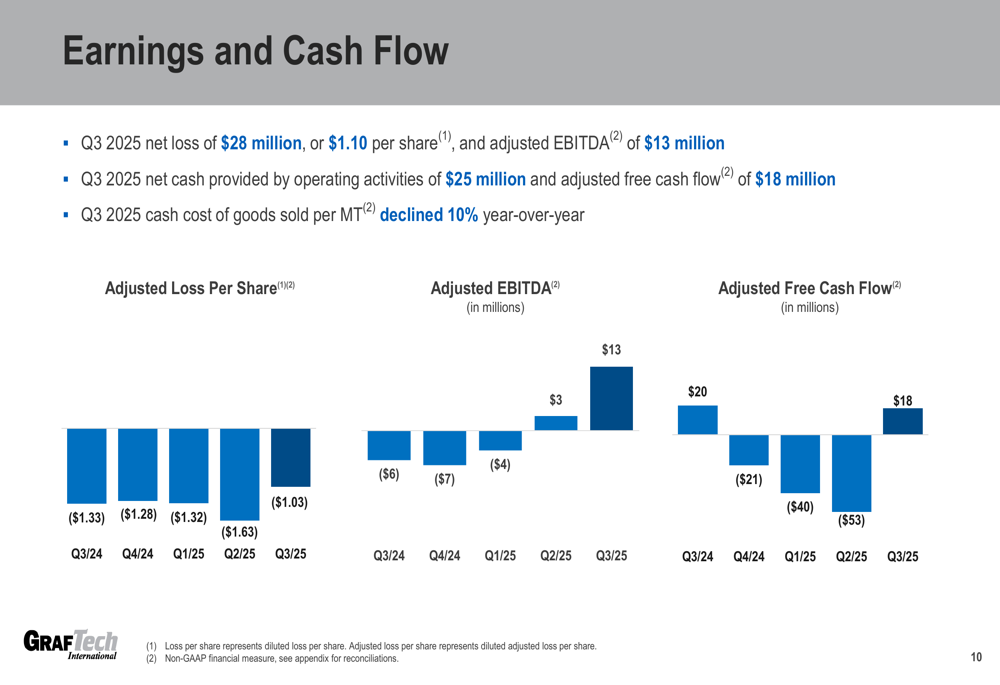
Despite operational improvements, GrafTech reported a net loss of $28 million, or $1.10 per share, for Q3 2025. This was significantly below analyst expectations of -$0.12 per share, representing a negative surprise of 758.33%. However, the company generated positive adjusted EBITDA of $13 million, a substantial improvement from the negative $6 million reported in Q3 2024.
The company's financial performance is illustrated in the following earnings and cash flow charts:
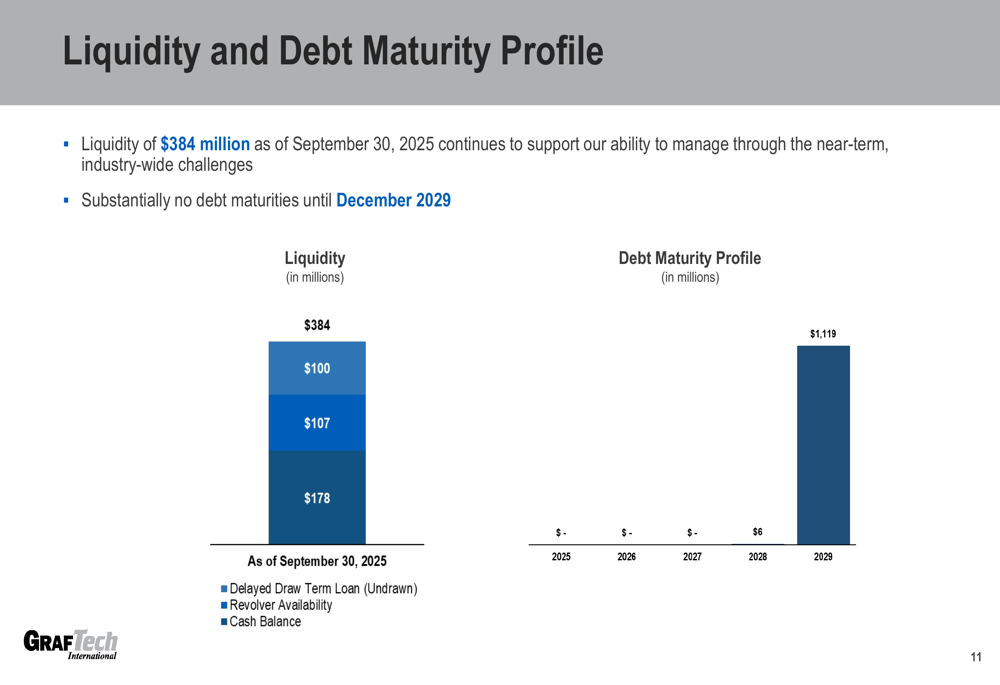
GrafTech maintained a strong liquidity position of $384 million as of September 30, 2025, providing financial flexibility as the company works through industry challenges. The company's debt maturity profile remains favorable, with substantially no debt maturities until December 2029.
The following chart shows GrafTech's liquidity and debt maturity profile:
Operating cash flow was positive at $25 million for the quarter, with adjusted free cash flow of $18 million, representing a significant improvement from previous quarters. This cash generation exceeded management's expectations and provides important financial flexibility.
Strategic Initiatives
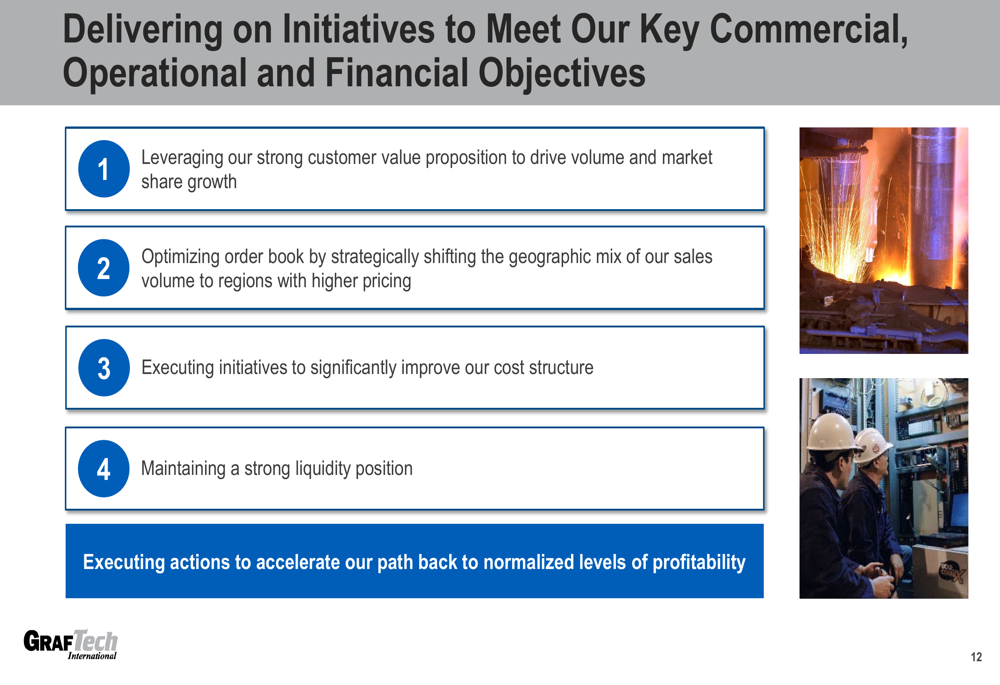
GrafTech is executing several strategic initiatives to improve its commercial, operational, and financial performance. The company is leveraging its customer value proposition to drive volume and market share growth while optimizing its order book by shifting sales to regions with higher pricing.
The following slide outlines GrafTech's key strategic initiatives:
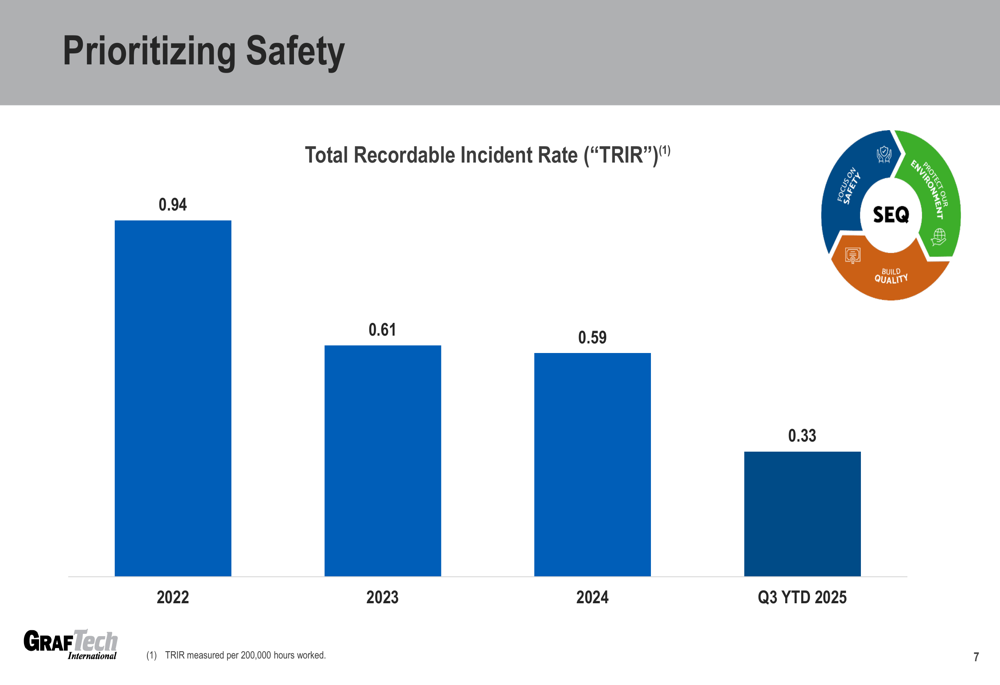
Safety remains a priority for GrafTech, with the company reporting continued improvement in its Total Recordable Incident Rate (TRIR). The TRIR for Q3 YTD 2025 was 0.33, showing significant improvement from 0.94 in 2022.
The company's safety performance is illustrated in the following chart:
Forward-Looking Statements
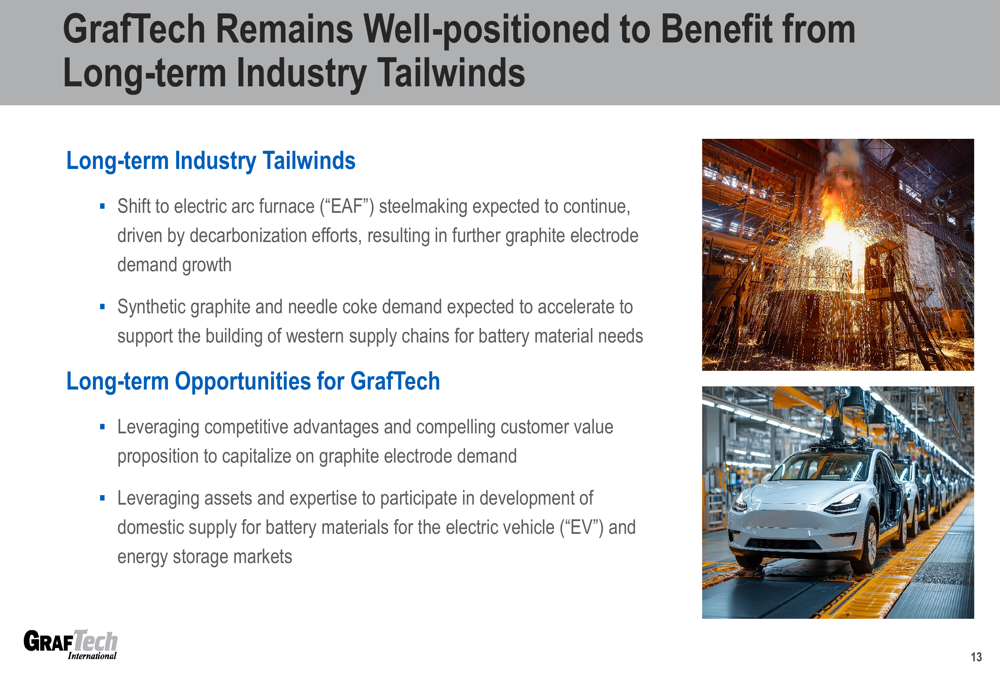
GrafTech's management remains optimistic about long-term industry trends, particularly the continued shift toward electric arc furnace (EAF) steelmaking and increasing demand for synthetic graphite and needle coke. The company is also exploring opportunities to leverage its expertise in the growing battery materials market for electric vehicles and energy storage.
CEO Tim Flanagan expressed confidence in the company's strategic direction, stating, "We are well positioned to capitalize on demand growth." The company expects to balance production and sales volume levels for the full year and continues to focus on cost reduction initiatives.
The following slide highlights GrafTech's long-term industry tailwinds and opportunities:
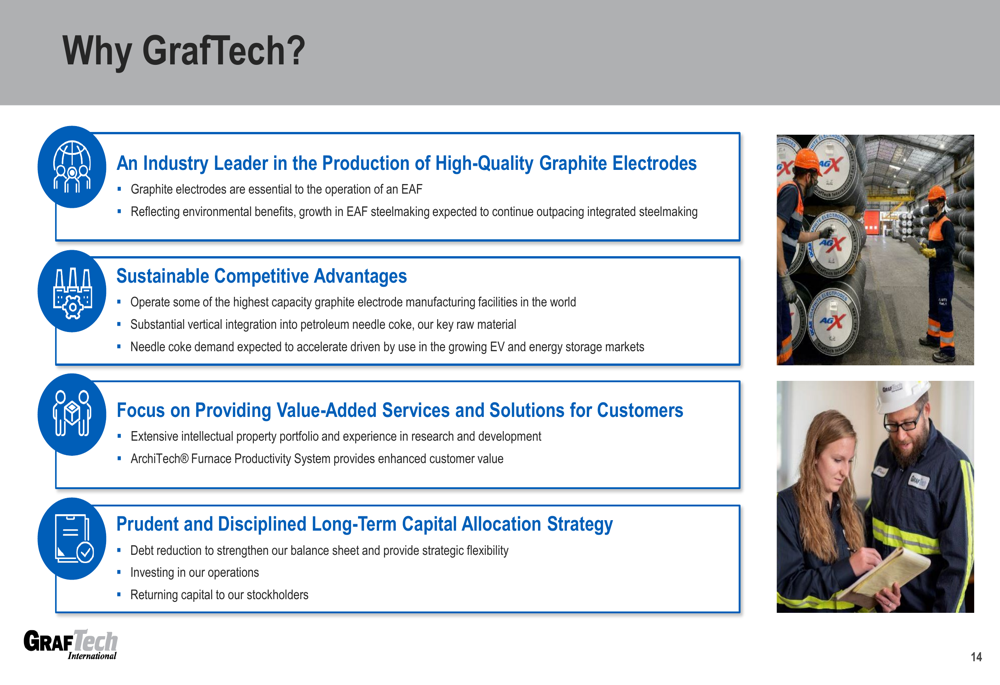
GrafTech's investment case centers on its leadership in high-quality graphite electrode production, vertical integration into petroleum needle coke, and focus on value-added services for customers. The company is pursuing a disciplined capital allocation strategy focused on debt reduction, operational investments, and returning capital to stockholders.
As illustrated in the following investment highlights slide, GrafTech believes it offers compelling long-term value:
While GrafTech continues to face near-term challenges, including a difficult pricing environment and ongoing losses, the operational improvements and strategic positioning suggest the company is making progress on its turnaround strategy. Investors appear to be responding positively to these developments, as evidenced by the stock's strong performance despite the earnings miss.
Full presentation:
This article was generated with the support of AI and reviewed by an editor. For more information see our T&C.