Gold prices dip as hawkish Fed minutes weigh ahead of Jackson Hole
Green Brick Partners Inc (NYSE:GRBK) released its first quarter 2025 investor presentation on May 1, showing record home closings and revenues despite a year-over-year decline in earnings per share. The homebuilder’s stock fell 4.9% in premarket trading to $56.10 following the release, suggesting investor concerns about the company’s margin compression and earnings decline.
Quarterly Performance Highlights
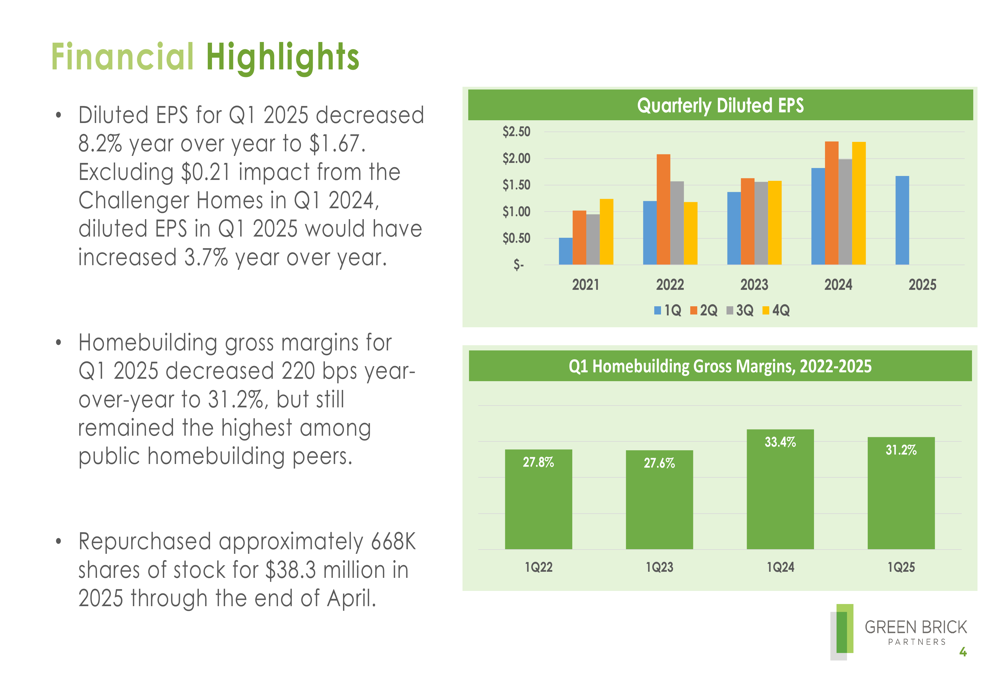
Green Brick reported diluted earnings per share of $1.67 for Q1 2025, down 8.2% from $1.82 in the same period last year. However, the company noted that excluding a $0.21 impact from the sale of Challenger Homes in Q1 2024, diluted EPS would have increased 3.7% year-over-year.
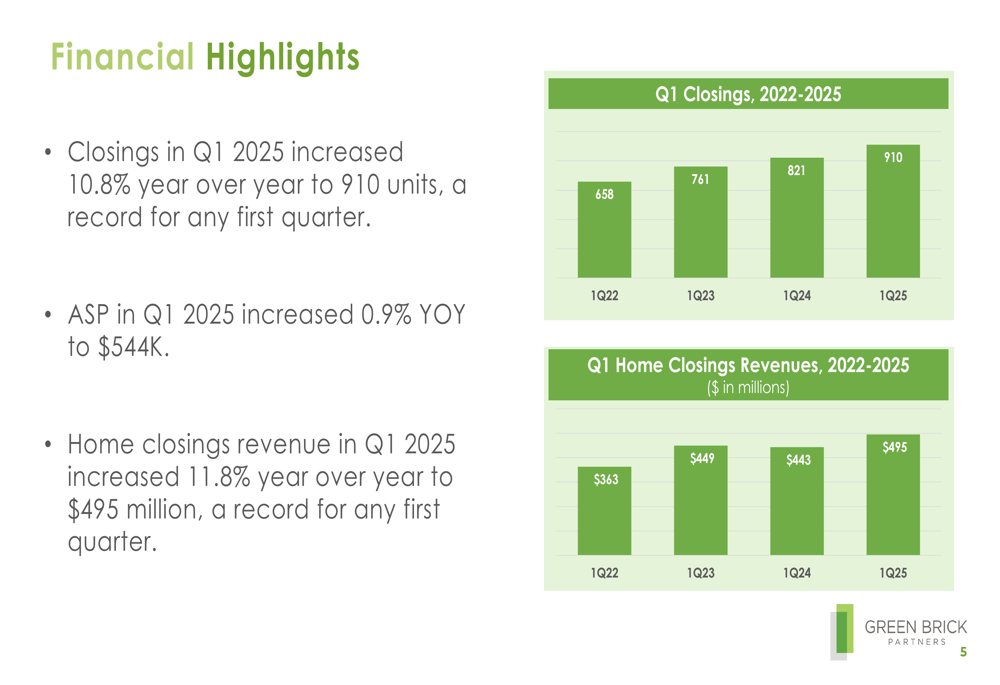
The company achieved 910 home closings in Q1 2025, a 10.8% increase from the previous year and a record for any first quarter. Home closings revenue grew 11.8% to $495 million, also a record for any first quarter, while the average sales price increased slightly by 0.9% to $544,000.
As shown in the following chart of quarterly closings and revenues, Green Brick has demonstrated consistent growth in both metrics over recent years:
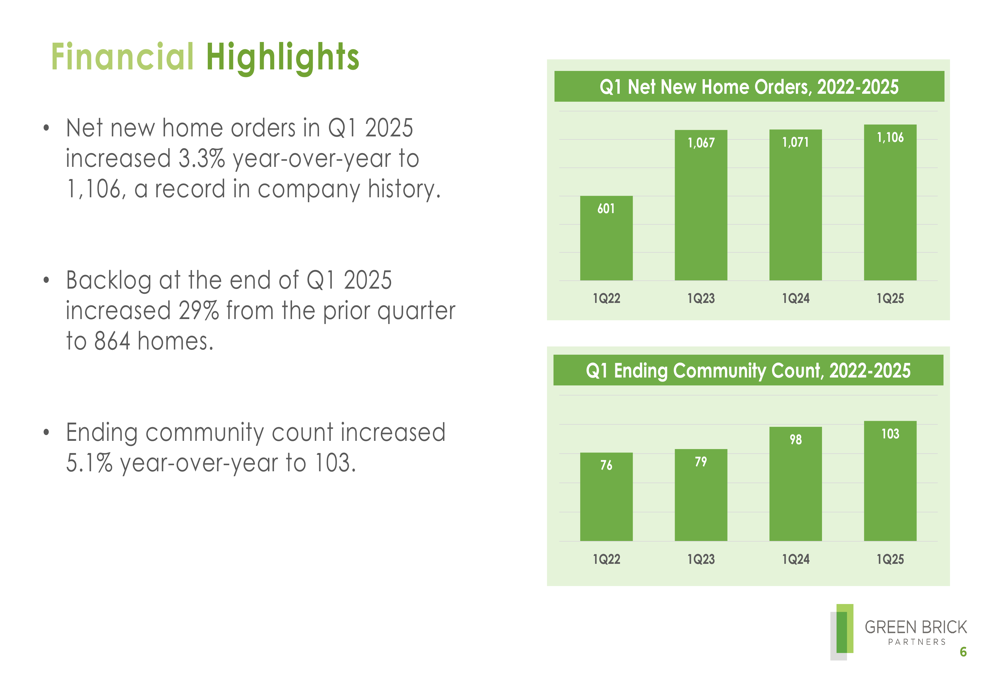
Net new home orders increased 3.3% year-over-year to 1,106 in Q1 2025, representing a company record. The backlog at the end of Q1 increased 29% from the prior quarter to 864 homes, while the community count grew 5.1% year-over-year to 103.
The following chart illustrates the company’s growth in net new home orders and community count:
Detailed Financial Analysis
Despite the overall positive operational performance, Green Brick’s homebuilding gross margins decreased 220 basis points year-over-year to 31.2% in Q1 2025. This represents a significant decline from the 33.8% gross margin reported for full-year 2024 in the previous earnings report.
The following chart shows the company’s quarterly diluted EPS and homebuilding gross margins:
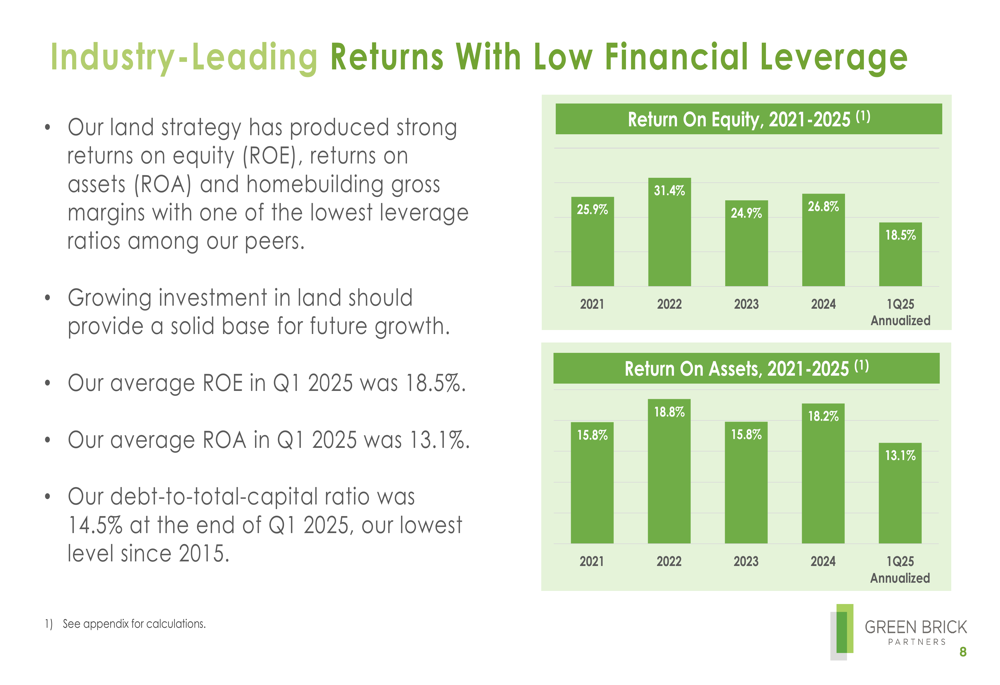
Green Brick maintained strong returns on equity and assets, though both metrics declined compared to full-year 2024 results. The company reported an annualized return on equity of 18.5% for Q1 2025, down from 26.8% for full-year 2024. Similarly, return on assets was 13.1% for Q1 2025 (annualized), compared to 18.2% for full-year 2024.
The company’s financial leverage remains among the lowest in the industry, with a debt-to-total capital ratio of 14.5% at the end of Q1 2025, a 380 basis point improvement from 18.3% a year earlier and the lowest level since 2015. However, net debt to total capital increased to 9.8% from 8.2% in Q1 2024.
As illustrated in the following chart, Green Brick’s returns and leverage position compare favorably to industry peers:
Competitive Industry Position
Green Brick continues to lead the industry in gross margins, maintaining a substantial advantage over competitors despite the year-over-year decline. At 31.2%, the company’s gross margin significantly exceeds the peer average of 21.9%.
The following chart compares Green Brick’s gross margins to those of its competitors:
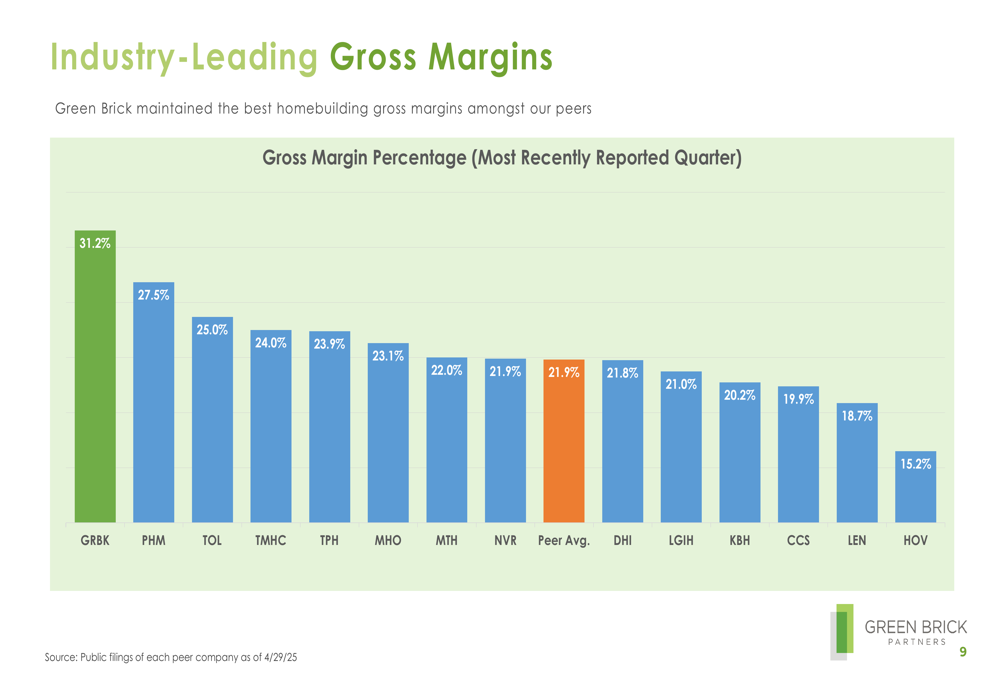
The company also maintains one of the lowest debt-to-total capital ratios among its peers at 14.5%, well below the peer average of 30.1%. This strong balance sheet position provides financial flexibility in a potentially volatile economic environment.
Green Brick’s strategic focus on supply-constrained infill and infill-adjacent submarkets, which represented approximately 80% of revenues in Q1 2025, continues to support its industry-leading margins. The company’s operations remain concentrated in two of the highest single-family starts markets—Dallas-Fort Worth and Atlanta—which generated approximately 90% of revenues in Q1 2025.
Strategic Initiatives & Forward Outlook
Green Brick is continuing its aggressive land acquisition and development strategy, with total lots owned and controlled increasing 31.6% year-over-year to 40,525. Approximately 85.7% of these lots are owned on the company’s balance sheet, and essentially all are planned for self-development.
The following chart shows the company’s growing land and lot position:
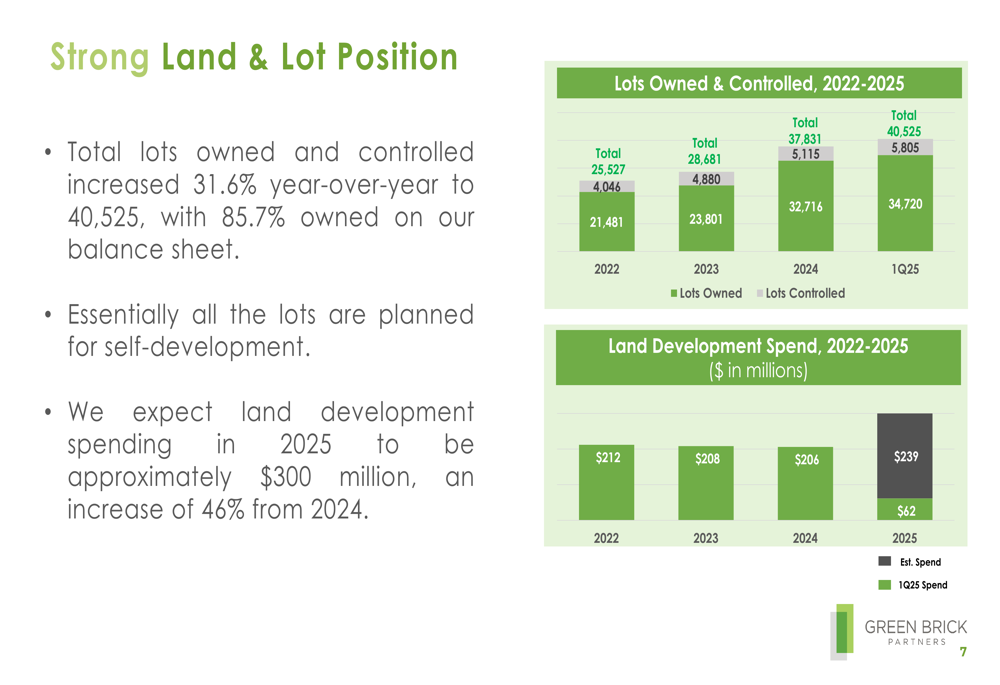
The company expects land development spending in 2025 to reach approximately $300 million, a significant 46% increase from 2024. This substantial investment in land development aligns with CEO Jim Brickman’s previous statement that "We’re spending a lot of dollars in land development... that’s all coming to fruition right now."
Green Brick plans to expand its Trophy brand, which represented 40% of Q1 2025 revenues, into the Houston market. The company expects to open its first community in Houston in the third quarter of 2025, entering the second-largest housing market by starts.
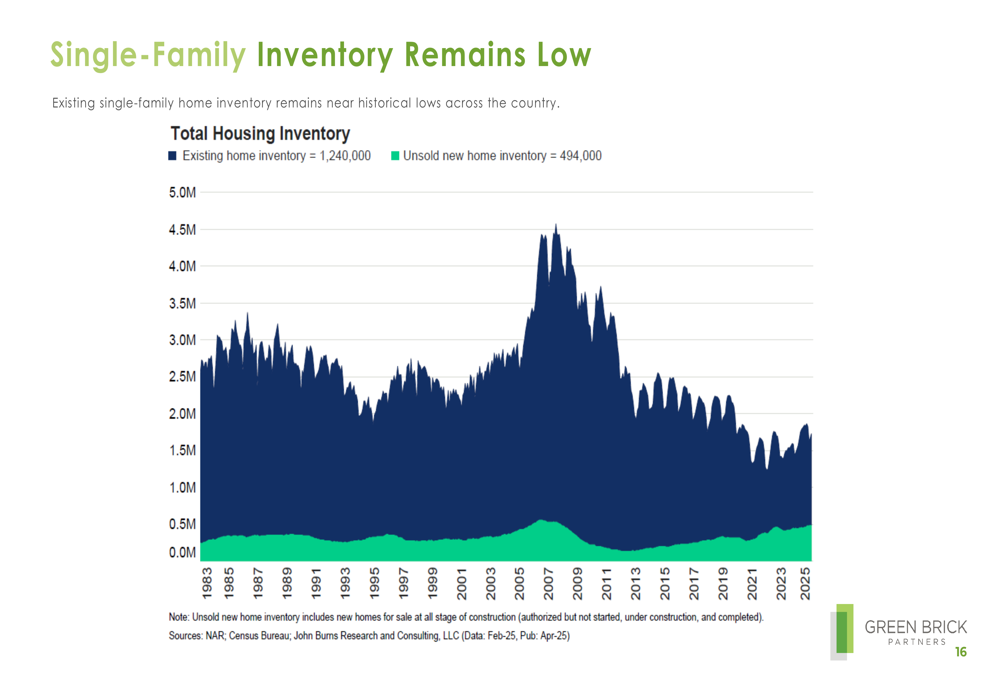
The company’s expansion strategy is supported by continued low housing inventory levels, as illustrated in the following chart showing total housing inventory near historical lows:
Green Brick also reported the repurchase of approximately 668,000 shares of stock for $38.3 million through the end of April 2025, demonstrating confidence in its long-term value proposition despite the short-term earnings decline.
With $103 million in cash at the end of Q1 2025 and $330 million in undrawn credit lines, Green Brick maintains strong liquidity to support its growth initiatives while navigating potential market volatility in the coming quarters.
Full presentation:
This article was generated with the support of AI and reviewed by an editor. For more information see our T&C.