Top U.S. Defense Stocks to Watch According to Jefferies Analysis

Green Brick Partners Inc (NASDAQ:NYSE:GRBK) delivered a mixed performance in Q2 2025, achieving record home closings while facing margin pressure and declining average selling prices, according to the company’s investor presentation released on July 31, 2025.
Quarterly Performance Highlights
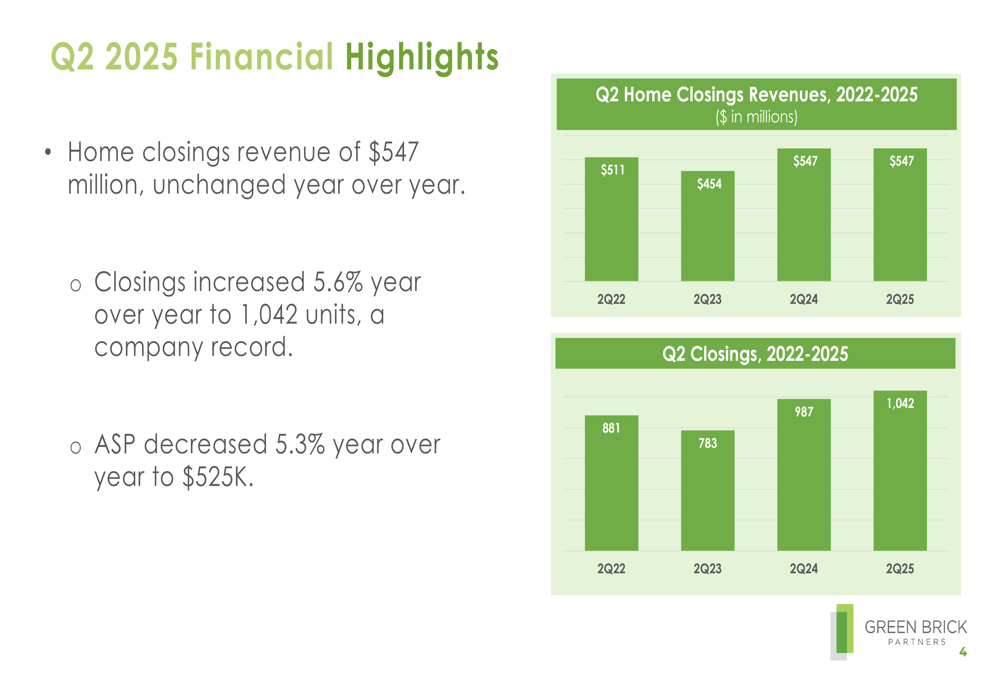
The homebuilder reported home closings revenue of $547 million, unchanged year-over-year despite a 5.6% increase in closings to a record 1,042 units. This discrepancy was driven by a 5.3% decrease in average selling price to $525,000, reflecting the company’s strategic response to market conditions.
As shown in the following chart of quarterly home closings and revenues:
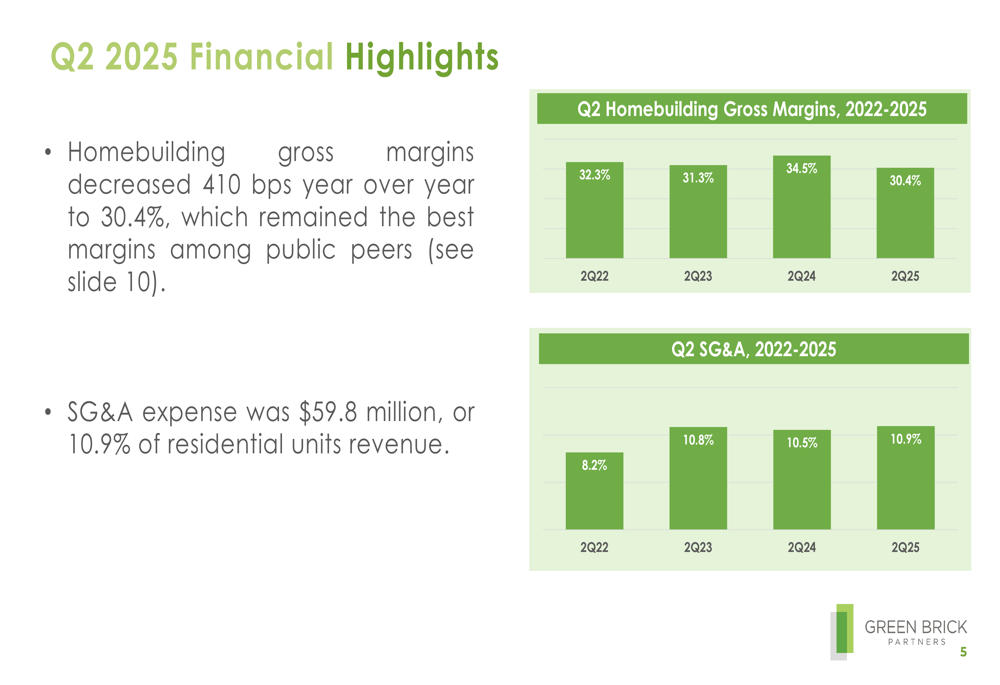
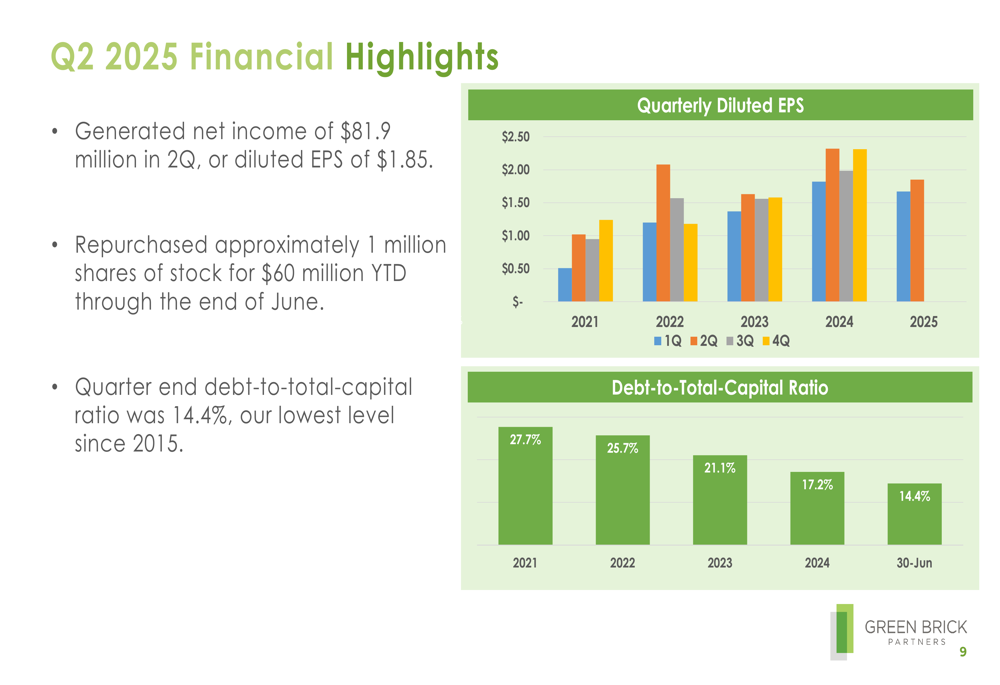
Net income for the quarter came in at $81.9 million, resulting in diluted earnings per share of $1.85, down 20.3% from $2.32 in Q2 2024. The company’s homebuilding gross margin decreased 410 basis points year-over-year to 30.4%, while SG&A expenses increased slightly to 10.9% of residential units revenue.
The following chart illustrates the company’s gross margin and SG&A trends:
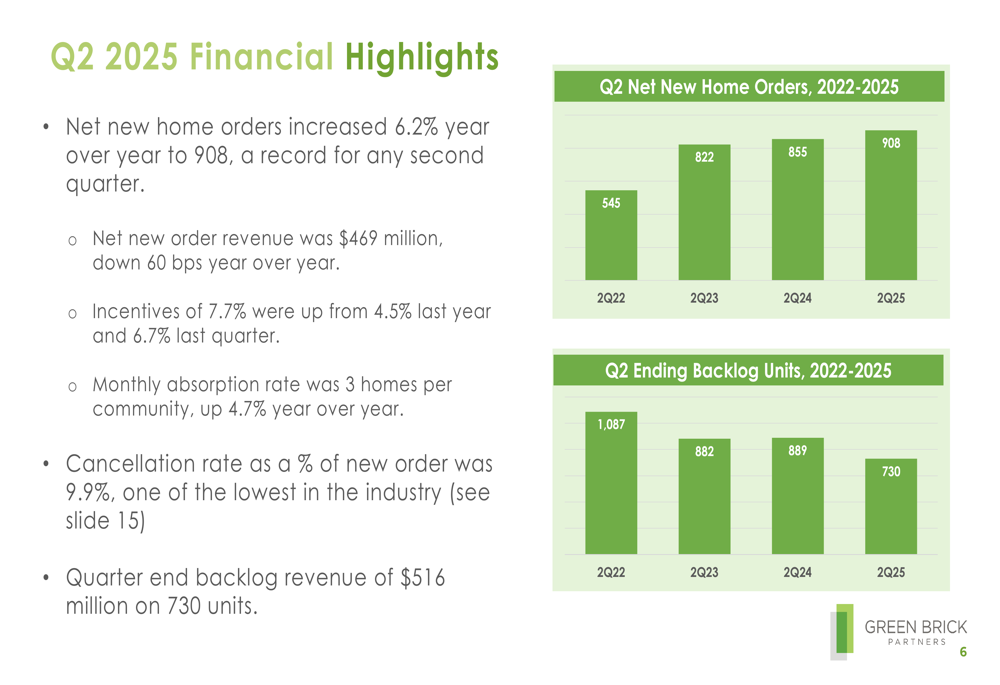
Despite these challenges, Green Brick reported strong sales momentum with net new home orders increasing 6.2% year-over-year to 908 units, a record for any second quarter. However, the company’s backlog decreased 20.6% to $516 million on 730 units.
The following chart shows the company’s order and backlog trends:
Detailed Financial Analysis
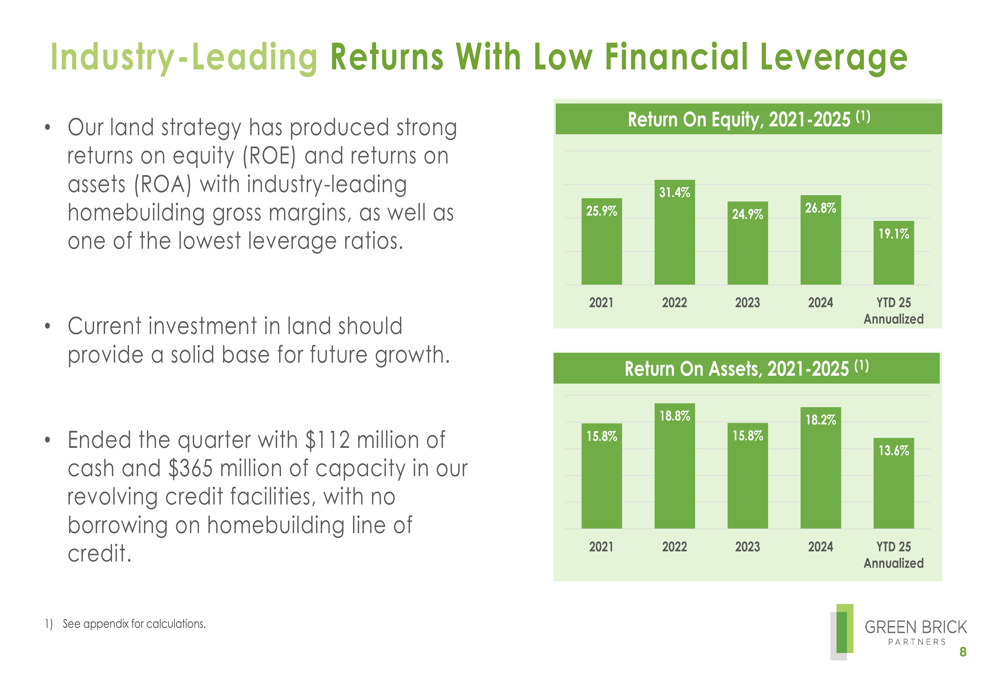
Green Brick’s financial position remains strong, with $112 million in cash and $365 million in available credit facilities at quarter-end. The company maintained its industry-leading returns, though at lower levels than previous periods, with return on equity at 19.1% (annualized) for the first half of 2025, down from 26.8% for full-year 2024.
The following chart shows the company’s historical returns:
Notably, Green Brick continued to strengthen its balance sheet, reducing its debt-to-total-capital ratio to 14.4%, the lowest level since 2015. The company also repurchased approximately 1 million shares for $60 million through the end of June 2025.
The following chart illustrates the company’s EPS and debt ratio trends:
Competitive Industry Position
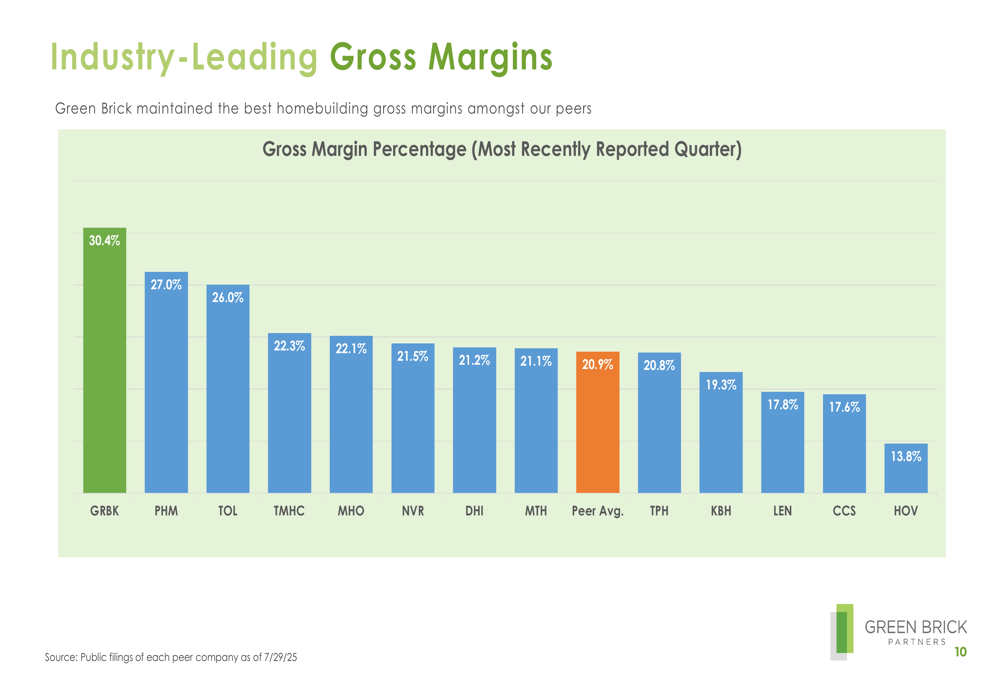
Despite margin pressure, Green Brick maintained its position as the industry leader in gross margins at 30.4%, significantly outperforming the peer average of 20.9%. This competitive advantage stems from the company’s land strategy and operational efficiency.
The following chart compares Green Brick’s gross margins to its peers:
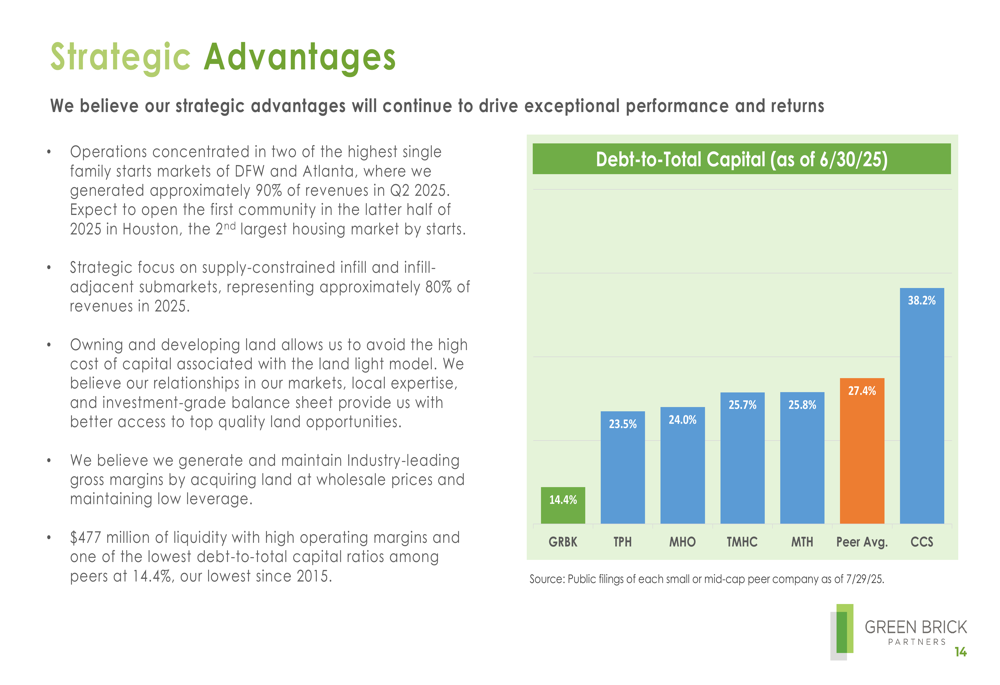
The company also boasts one of the lowest cancellation rates in the industry at 9.9%, reflecting strong demand and customer commitment. Green Brick’s debt-to-total-capital ratio of 14.4% is substantially lower than the peer average of 27.4%, providing financial flexibility in an uncertain economic environment.
The following chart illustrates the company’s debt position relative to peers:
Strategic Initiatives
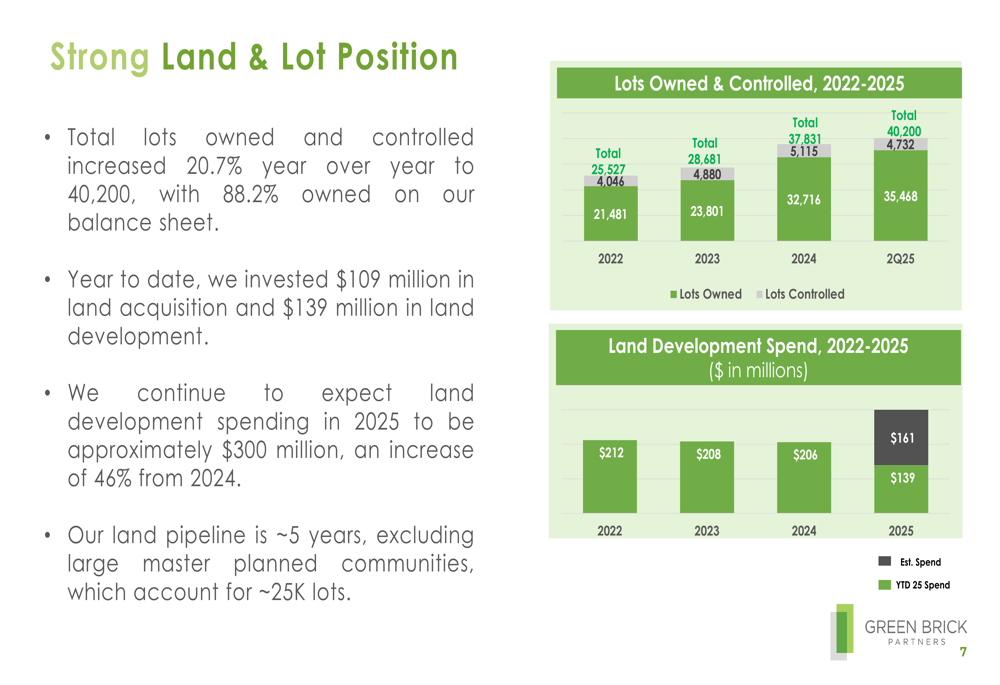
Green Brick continues to invest heavily in its future growth, with year-to-date investments of $109 million in land acquisition and $139 million in land development. The company expects total land development spending in 2025 to reach approximately $300 million, a 46% increase from 2024.
The following chart shows the company’s land position and development spending:
Green Brick’s operations remain concentrated in two of the highest single-family starts markets, Dallas-Fort Worth and Atlanta, which generated approximately 90% of revenues in Q2 2025. The company is strategically focused on supply-constrained infill and infill-adjacent submarkets, representing approximately 80% of revenues in 2025.
A significant strategic initiative is the company’s expansion into Houston, the second-largest housing market by starts, with the first community expected to open in the latter half of 2025. Additionally, Green Brick is focused on growing its Trophy brand, which currently represents 37% of Q2 2025 revenues.
Forward-Looking Statements
Looking ahead, Green Brick’s business priorities include balancing price and pace community by community to maximize returns, incrementally improving operations and cost efficiencies, and maintaining financial flexibility in a volatile economic environment.
The company’s substantial land pipeline of approximately 40,200 lots (up 20.7% year-over-year) provides a solid foundation for future growth, with 88.2% of lots owned on the balance sheet. This land pipeline represents approximately five years of supply, excluding large master-planned communities, which account for about 25,000 additional lots.
While Green Brick faces challenges from declining average selling prices and margins, its strong balance sheet, industry-leading profitability, and strategic land investments position the company to navigate current market conditions while preparing for long-term growth. The company’s expansion into Houston and continued focus on infill locations in supply-constrained markets should provide additional growth opportunities in the coming years.
Full presentation:
This article was generated with the support of AI and reviewed by an editor. For more information see our T&C.