Bitcoin price today: falls to 2-week low below $113k ahead of Fed Jackson Hole

Introduction & Market Context
Hancock Whitney Corporation (NASDAQ:HWC) presented its second quarter 2025 earnings results on July 15, 2025, reporting net income of $113.5 million, or $1.32 per diluted share, down from $120 million, or $1.38 per share in the first quarter. Despite the sequential earnings decline, the bank highlighted continued net interest margin expansion and a return to loan growth.
The bank’s stock closed down 3.34% at $60.23 on the day of the earnings release, reflecting investor concerns about the quarter-over-quarter earnings decline despite some positive underlying metrics.
Quarterly Performance Highlights
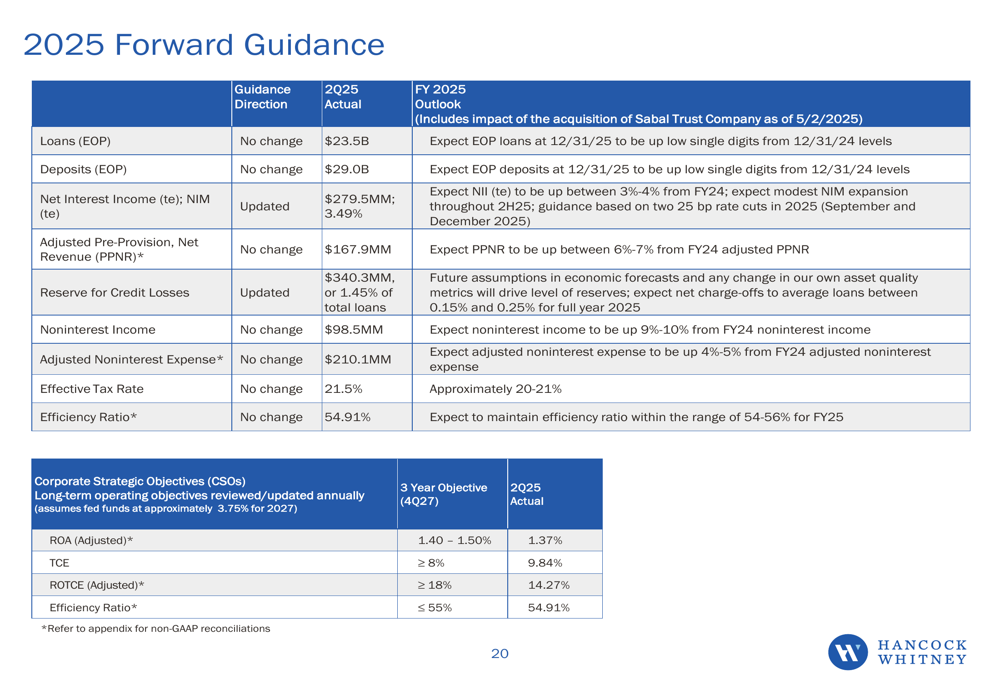
Hancock Whitney reported adjusted pre-provision net revenue (PPNR) of $167.9 million for the second quarter. The company’s efficiency ratio stood at 54.91%, reflecting disciplined expense management despite some one-time costs.
As shown in the following comprehensive financial summary:
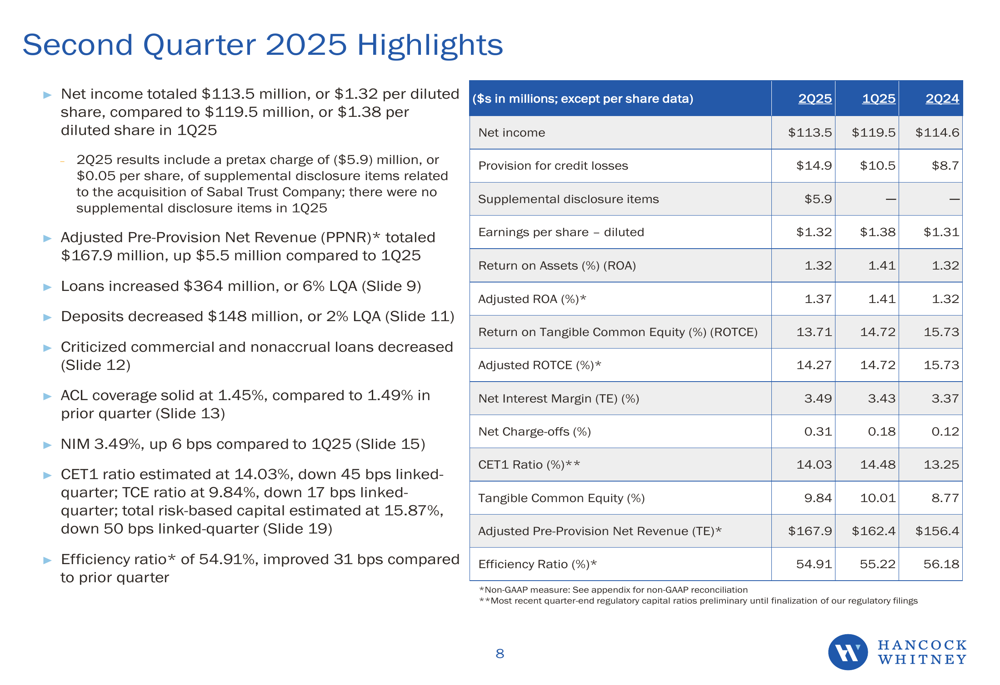
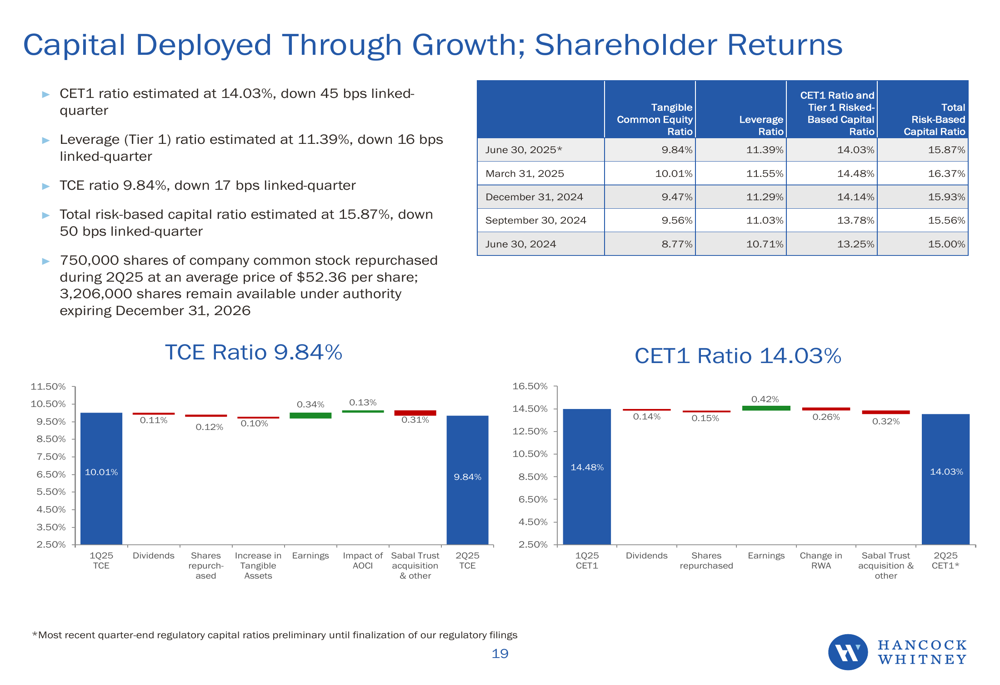
The bank’s total assets reached $35.2 billion, with loans of $23.5 billion and deposits of $29.0 billion. The company maintained strong capital ratios with a CET1 ratio of 14.03% and tangible common equity (TCE) ratio of 9.84%, positioning it well above regulatory requirements.
Loan Growth and Asset Quality
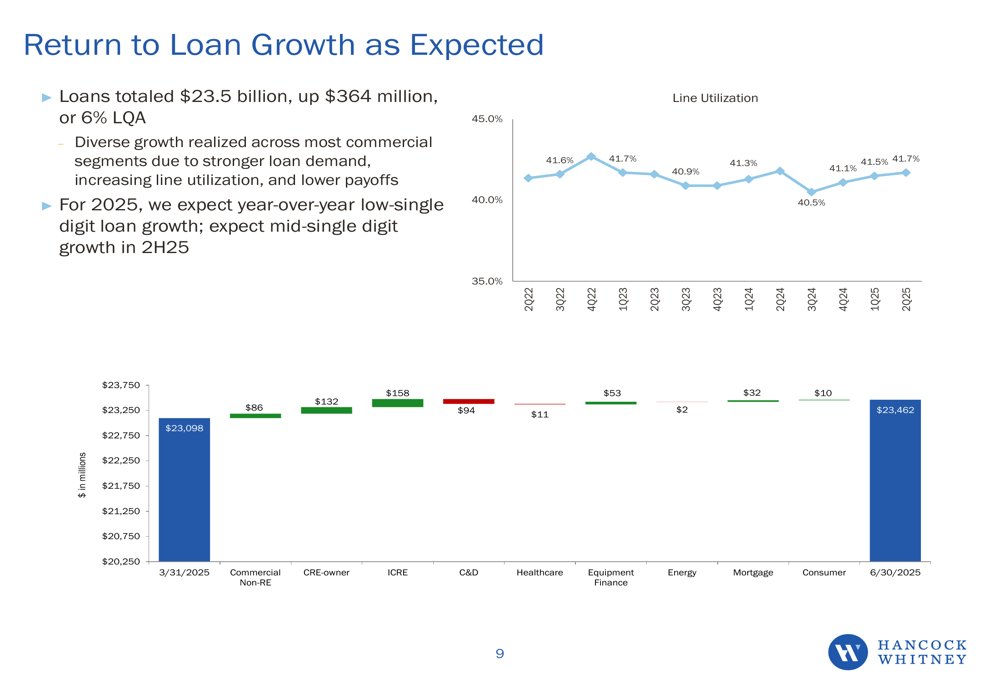
After a period of cautious lending, Hancock Whitney reported a return to loan growth in Q2, with loans increasing by $364 million, representing a 6% linked-quarter annualized growth rate. This growth was visualized in the company’s presentation:
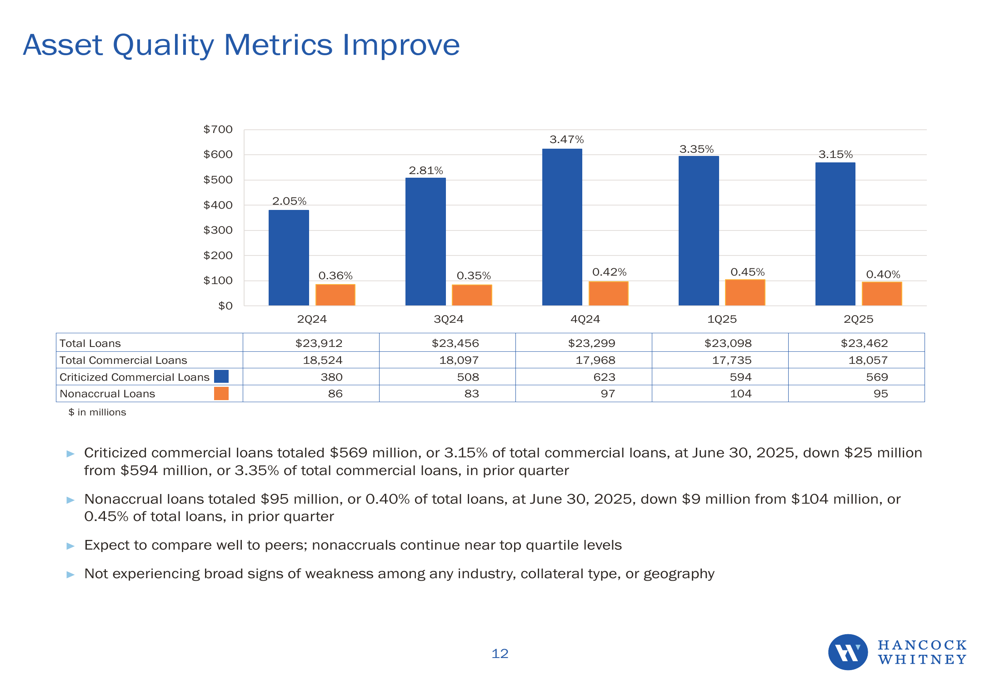
The bank’s asset quality metrics showed improvement during the quarter. Criticized commercial loans totaled $569 million or 3.15% of total commercial loans, down $25 million from the previous quarter. Nonaccrual loans stood at $95 million or 0.40% of total loans, reflecting the bank’s prudent risk management approach.
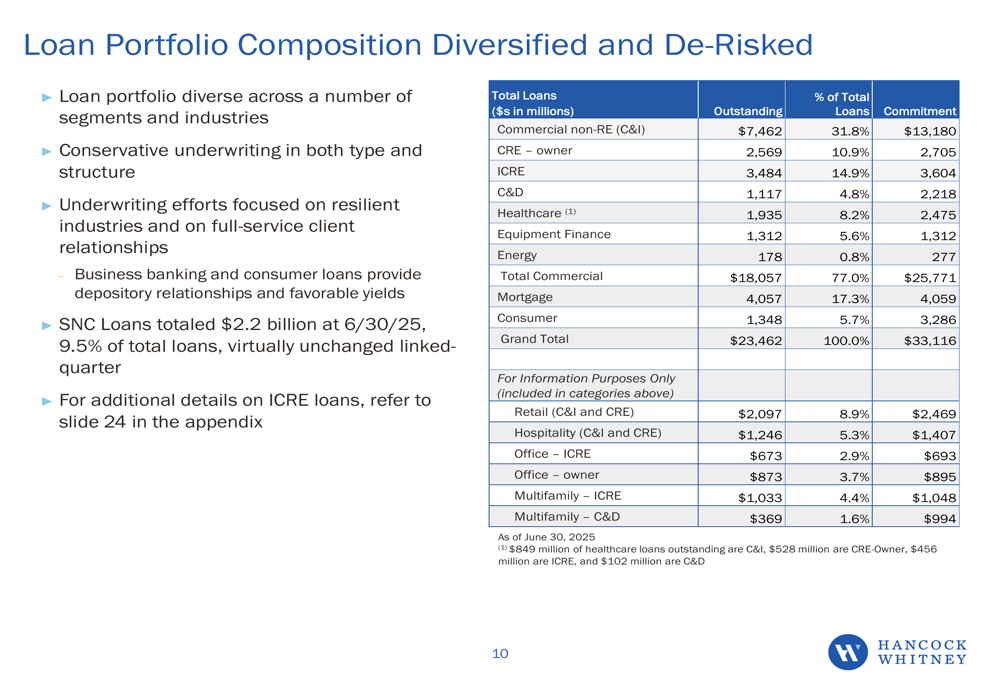
The loan portfolio remains diversified across various sectors, with commercial non-real estate (C&I) loans representing the largest segment. The company has continued its strategy of de-risking its portfolio, particularly in potentially vulnerable commercial real estate segments.
Net Interest Margin and Income
A key bright spot in the quarter was the continued expansion of net interest margin (NIM), which increased to 3.49%, up 6 basis points from 3.43% in the first quarter. Net interest income (NII) totaled $279.5 million. Management indicated expectations for "modest and consistent NIM expansion" for the remainder of 2025, assuming two 25 basis point rate cuts.
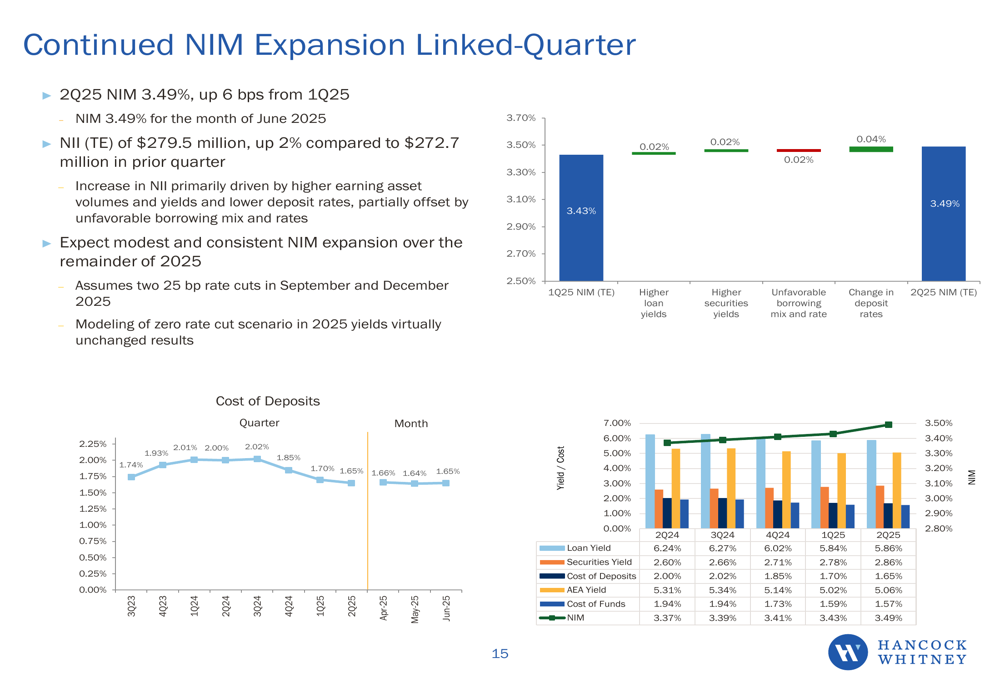
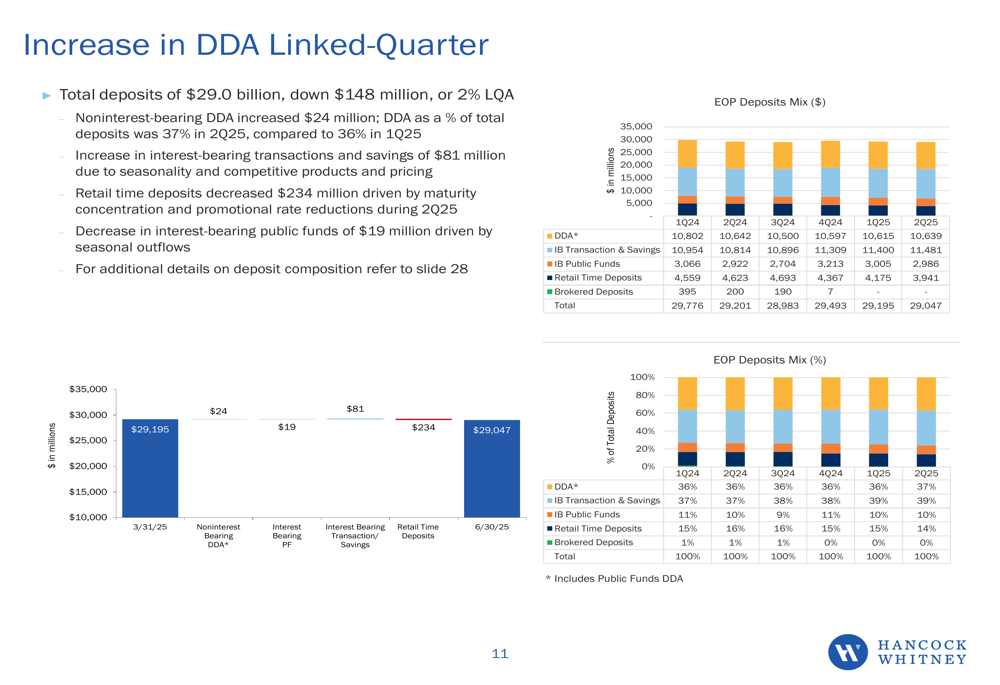
On the deposit side, total deposits decreased slightly by $148 million to $29.0 billion, representing a 2% linked-quarter annualized decline. However, noninterest-bearing demand deposits increased by $24 million, a positive sign for the bank’s funding costs. The deposit mix showed stability with demand deposits representing 37% of total deposits.
Strategic Initiatives and Growth Plan
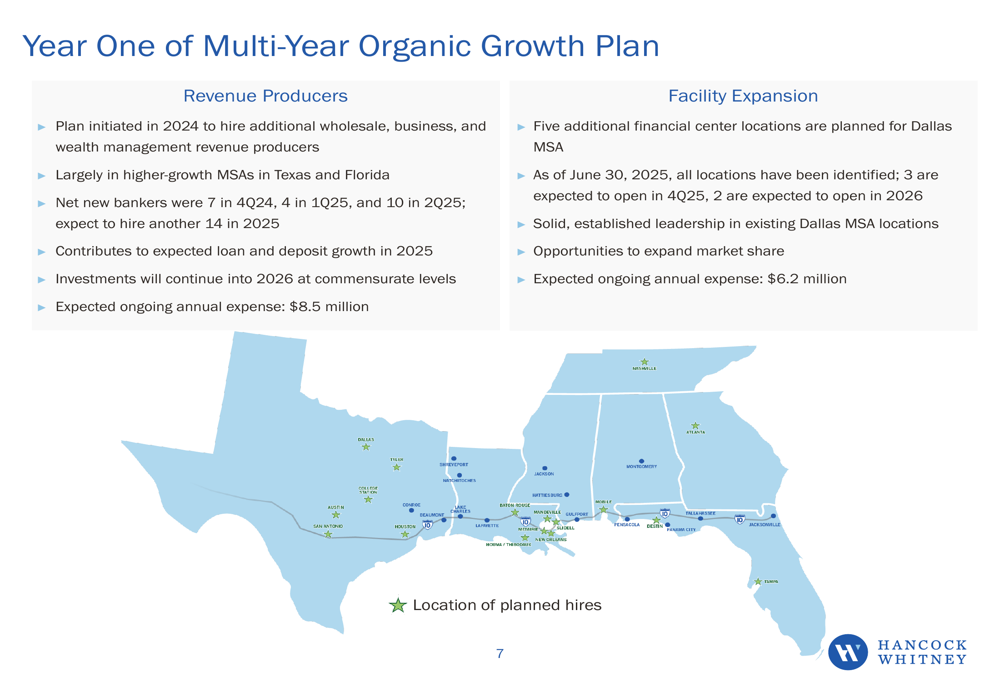
Hancock Whitney continues to execute on its multi-year organic growth plan, which includes strategic hiring of revenue producers and geographic expansion. During Q2, the bank added 10 new bankers, following 4 additions in Q1, and plans to hire an additional 14 bankers through the remainder of 2025.
The company is also expanding its physical presence in the Dallas metropolitan statistical area (MSA), with plans for five additional financial center locations, representing an expected ongoing annual expense of $6.2 million.
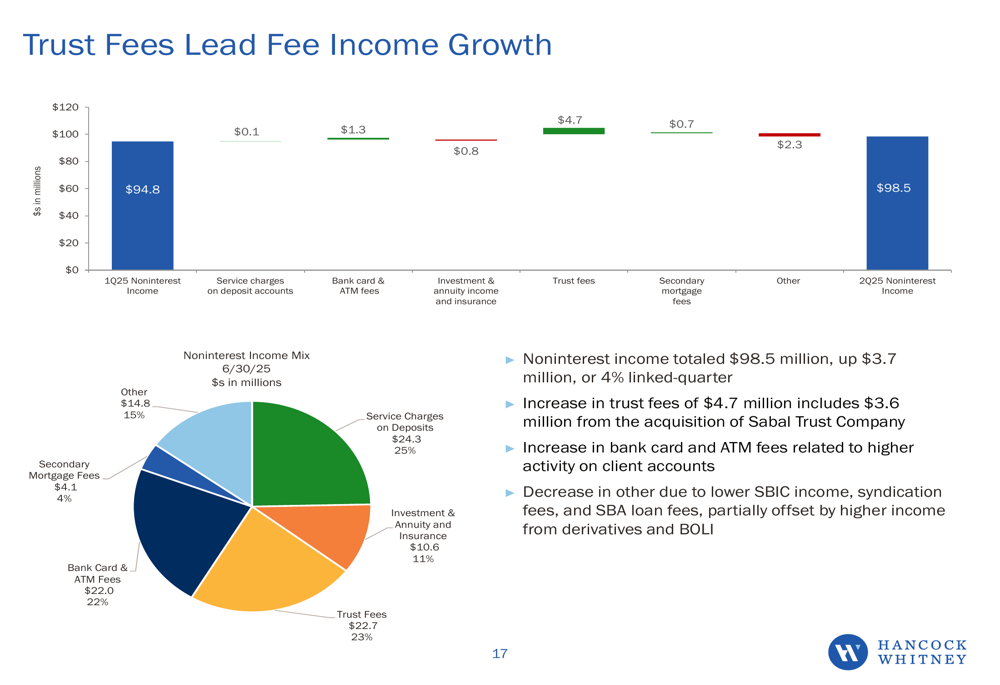
Noninterest income totaled $98.5 million, up $3.7 million or 4% linked-quarter. Trust fees led this growth, increasing by $4.7 million, which included $3.6 million from the Sabal Trust Company acquisition completed earlier in the year.
Noninterest expenses totaled $216.0 million, up $10.9 million or 5% from the previous quarter. However, management noted that Q2 included $5.9 million in one-time expenses, suggesting underlying expense growth was more modest.
Capital Position and Forward Guidance
Hancock Whitney maintained strong capital ratios, with a CET1 ratio of 14.03% and TCE ratio of 9.84%. These robust capital levels provide flexibility for continued organic growth, potential acquisitions, and shareholder returns.
Looking ahead, the company provided forward guidance for the full year 2025, maintaining its previous outlook for loan and deposit growth while projecting continued NIM expansion.
The bank also highlighted its strong liquidity position with approximately $19.9 billion in internal and external funding sources available, providing ample flexibility to support growth initiatives while maintaining regulatory compliance.
In summary, while Hancock Whitney’s Q2 2025 earnings showed a slight decline from the previous quarter, the company demonstrated positive trends in loan growth, net interest margin expansion, and asset quality metrics. The continued execution of its strategic growth initiatives, particularly in banker hiring and geographic expansion, positions the bank for potential growth in the coming quarters, assuming economic conditions remain supportive.
Full presentation:
This article was generated with the support of AI and reviewed by an editor. For more information see our T&C.