Gold prices slide further as easing US-China tensions curb haven demand

Introduction & Market Context
Hanmi Financial Corporation (NASDAQ:HAFC), a $731 million market cap regional bank with a notable 4.6% dividend yield, presented strong third-quarter 2025 results on October 21, 2025, showcasing significant improvement across key financial metrics. The company’s shares rose 1.62% in after-hours trading following the announcement, closing at $24.10, reflecting positive investor sentiment about the quarter’s performance.
The bank, which maintains a strong presence in the Korean-American market, reported earnings that exceeded Wall Street expectations with EPS of $0.73 versus the forecast of $0.65, representing a 12.3% surprise. This performance comes amid a declining interest rate environment, with the Fed Funds rate dropping from 4.50% in Q2 to 4.25% in Q3 2025.
Quarterly Performance Highlights
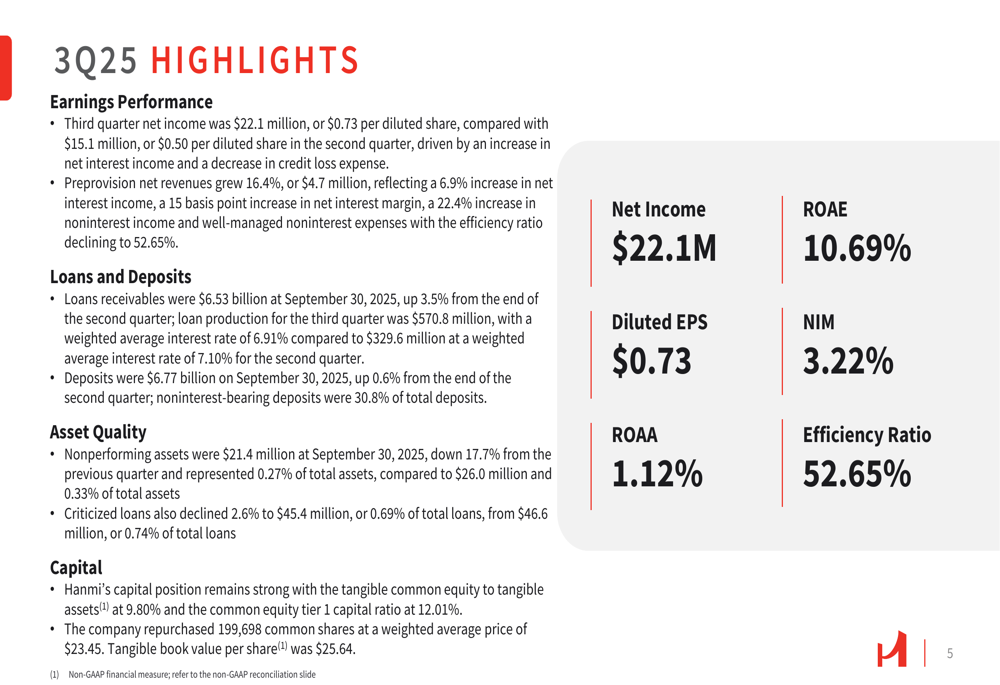
Hanmi’s third-quarter results revealed substantial growth in profitability, with net income reaching $22.1 million ($0.73 per diluted share), a 46% increase from $15.1 million ($0.50 per diluted share) in the second quarter. Preprovision net revenues grew by an impressive 16.4%, or $4.7 million, quarter-over-quarter.
The company’s efficiency ratio improved to 52.65%, while return on average assets (ROAA) and return on average equity (ROAE) reached 1.12% and 10.69%, respectively. These metrics reflect Hanmi’s enhanced operational efficiency and effective capital utilization.
As shown in the following quarterly highlights summary:
Net Interest Income and Margin Improvement
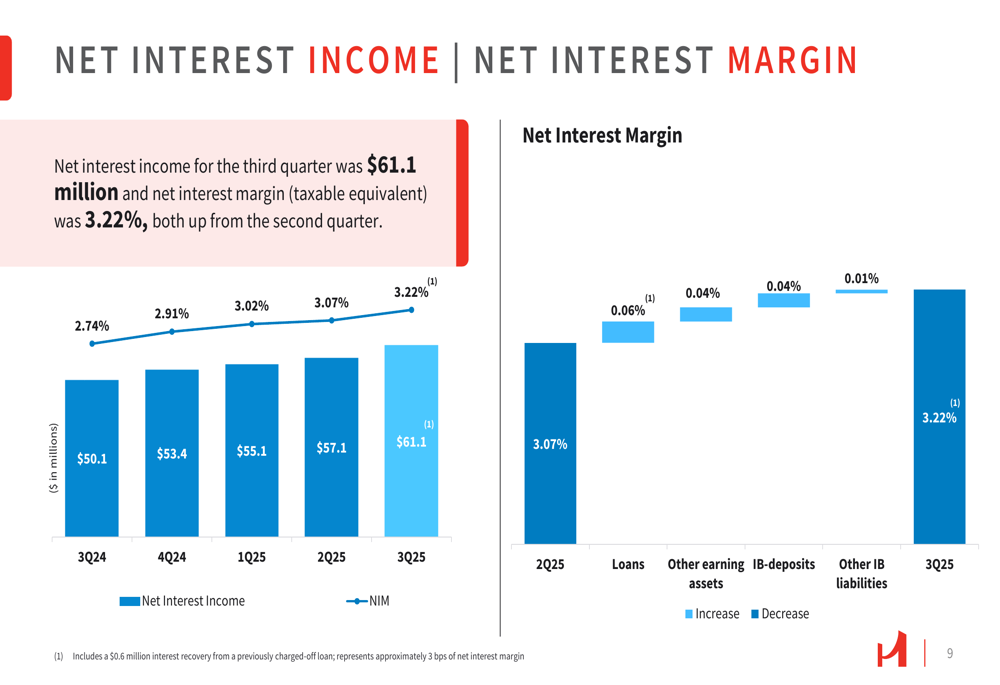
Hanmi’s net interest income reached $61.1 million in Q3 2025, continuing a consistent upward trend over the past five quarters. More notably, the net interest margin expanded to 3.22%, a 15 basis point increase from 3.07% in the previous quarter. This improvement was driven by a 0.06% increase in loan yields, a 0.04% increase in other earning assets, and a 0.04% increase in interest-bearing deposits.
The company’s strategic management of its deposit portfolio has contributed to this margin expansion, with the cost of CDs declining to 3.97% in Q3 from 4.05% in Q2, despite the declining Fed Funds rate environment.
The following chart illustrates the positive trend in net interest income and margin:
Loan Portfolio and Production Analysis
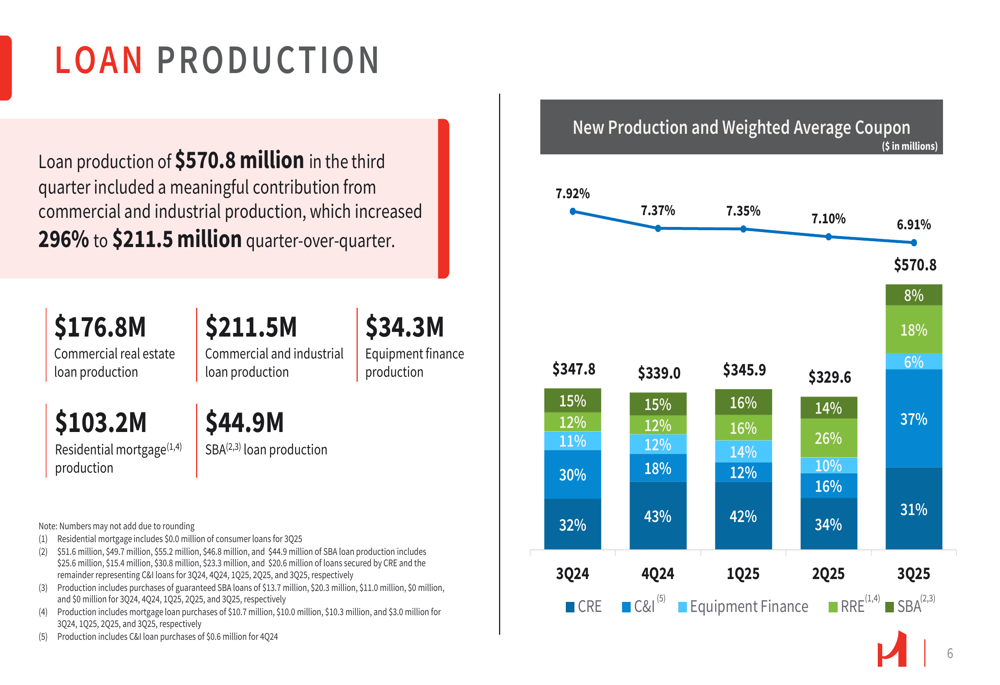
Hanmi reported exceptional loan production in the third quarter, with total new loans reaching $570.8 million, a significant increase from $329.6 million in Q2 2025. The most remarkable growth came from the Commercial and Industrial (C&I) segment, which surged 296% to $211.5 million quarter-over-quarter, reflecting the company’s strategic focus on this area.
The loan production breakdown and trends are illustrated in the following chart:
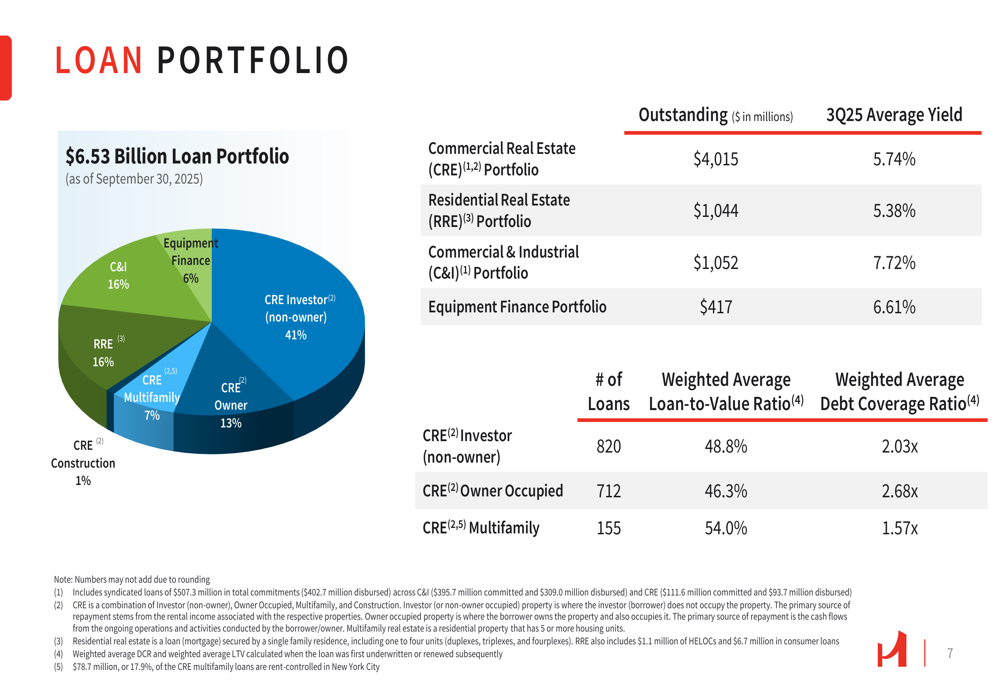
The company’s total loan portfolio reached $6.53 billion as of September 30, 2025, representing a 3.5% increase from the previous quarter. The portfolio remains well-diversified, with Commercial Real Estate (CRE) investor loans comprising 41%, followed by Residential Real Estate (RRE) and Commercial & Industrial loans at 16% each.
The loan portfolio composition and key metrics are detailed in the following breakdown:
Deposit Growth and Composition
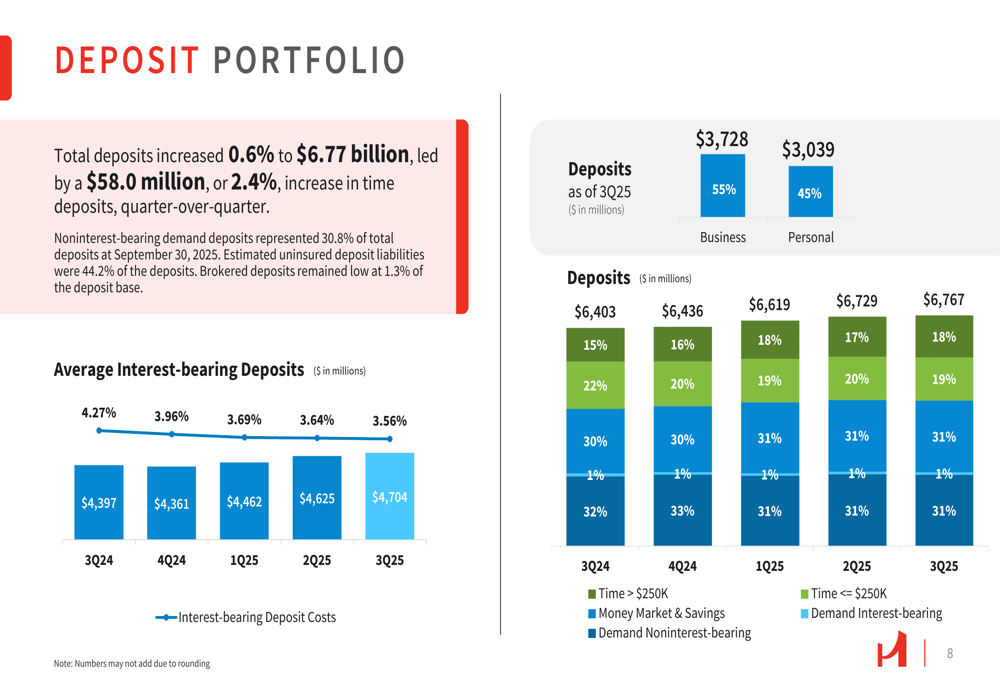
Hanmi’s total deposits increased 0.6% to $6.77 billion in Q3 2025, led by a $58.0 million (2.4%) increase in time deposits. Notably, noninterest-bearing demand deposits represented 30.8% of total deposits, providing a stable and cost-effective funding source.
Business deposits accounted for 55% of total deposits ($3.73 billion), while personal deposits made up the remaining 45% ($3.04 billion), highlighting Hanmi’s balanced approach to deposit gathering.
The following chart shows the deposit composition and trends:
Asset Quality Improvements
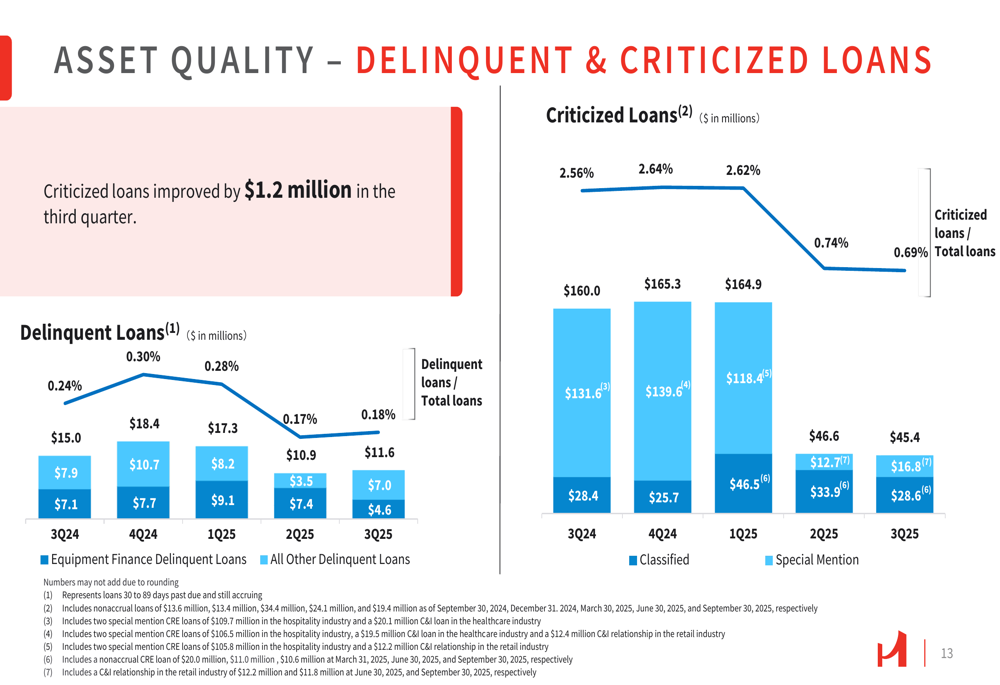
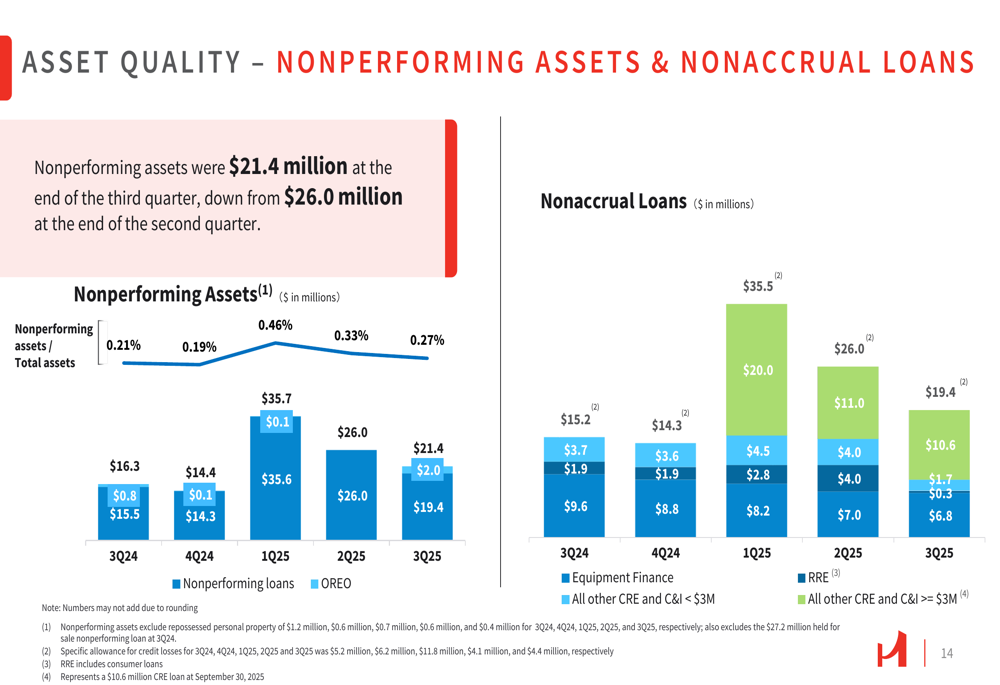
Hanmi demonstrated significant improvement in asset quality metrics during Q3 2025. Nonperforming assets decreased to $21.4 million, down 17.7% from $26.0 million in the previous quarter. Similarly, criticized loans improved by $1.2 million to $45.4 million, representing just 0.69% of total loans, compared to 0.74% in Q2.
The company reported net recoveries of $482 thousand for the quarter, including a $2.0 million recovery on a previously charged-off loan. The allowance for credit losses stood at $69.8 million, or 1.07% of total loans, slightly up from 1.06% in the previous quarter.
These improving asset quality trends are illustrated in the following charts:
Noninterest Income and Expense
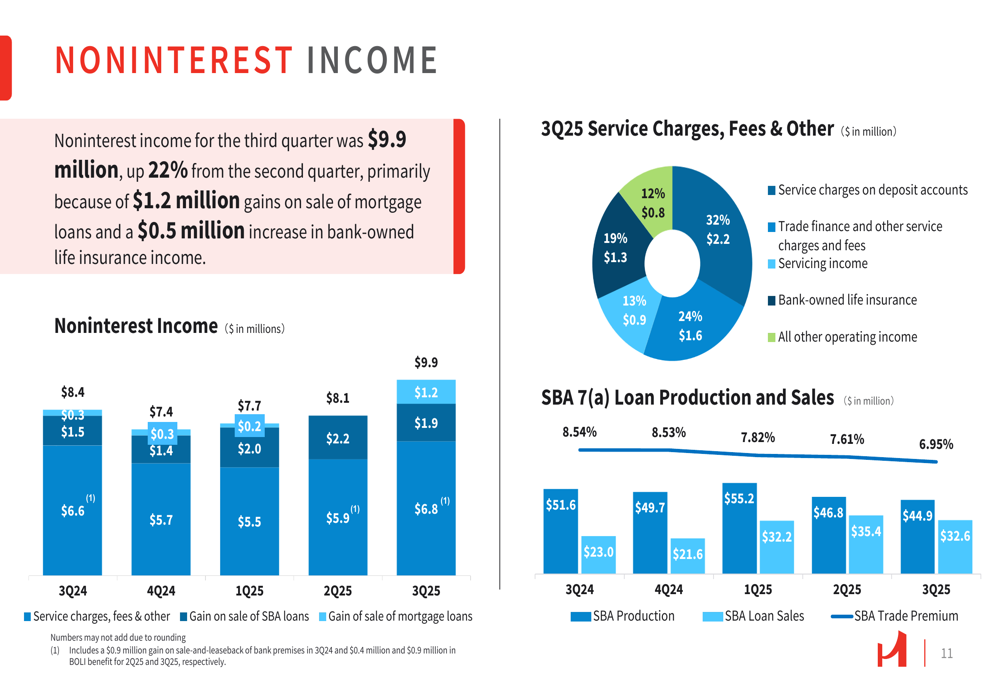
Noninterest income reached $9.9 million in Q3 2025, up 22% from $8.1 million in Q2, primarily due to gains on sale of mortgage loans and an increase in bank-owned life insurance income. The components of noninterest income show a diversified revenue stream, with servicing income contributing 32% of the total.
The following chart details the noninterest income trend and composition:
Noninterest expense increased modestly by 3% to $37.4 million in Q3 2025. As a percentage of average assets, noninterest expense remained relatively stable at 1.90%, compared to 1.89% in the previous quarter. Salaries and employee benefits continued to be the largest expense category at $22.2 million.
Capital and Liquidity Position
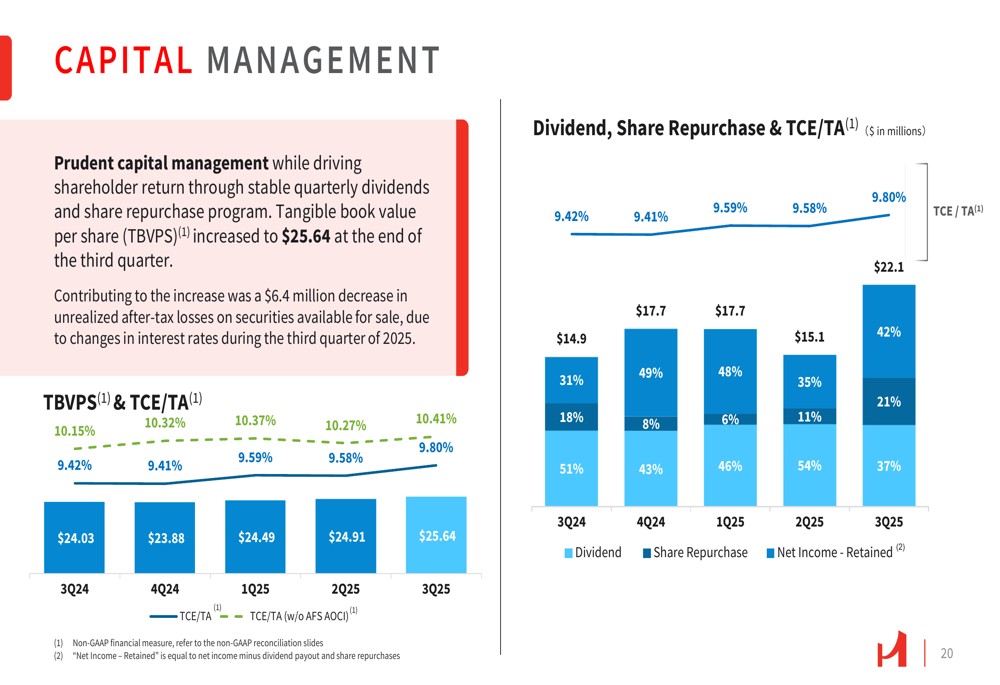
Hanmi maintained strong capital ratios, with tangible common equity to tangible assets at 9.80% and common equity tier 1 capital ratio at 12.01%, both well above regulatory requirements. The company continued its capital management strategy through stable quarterly dividends and share repurchases, buying back 199,698 common shares at an average price of $23.45 during the quarter.
Tangible book value per share increased to $25.64, reflecting the company’s continued focus on building shareholder value. The following chart illustrates Hanmi’s capital management approach:
Liquidity remains robust, with $1.06 billion in liquid assets representing 13.5% of total assets. This includes $216 million in cash and cash equivalents and $833 million in unpledged securities, providing ample flexibility to support future growth.
Forward-Looking Statements
During the earnings call, CEO Bonnie Lee expressed pride in the momentum built so far in 2025, while CFO Ron Santarosa emphasized the company’s disciplined approach to deposit cost management. Looking ahead, Hanmi anticipates mid-single-digit loan growth for the remainder of 2025 and expects to continue reducing deposit costs.
The company is well-positioned to benefit from potential Federal Reserve rate cuts, with a focus on expanding its presence in the Korean market and enhancing its relationship banking model. The USKC (U.S. subsidiaries of Korean corporations) initiative remains a strategic priority, currently representing 14% of the loan portfolio and 15% of the deposit portfolio.
With its strong capital position, improving asset quality, and strategic focus on commercial lending, Hanmi appears well-equipped to navigate the evolving interest rate environment while continuing to deliver value to shareholders.
Full presentation:
This article was generated with the support of AI and reviewed by an editor. For more information see our T&C.