Gold prices steady above $3,400/oz on rate cut bets; PCE data awaited

Introduction & Market Context
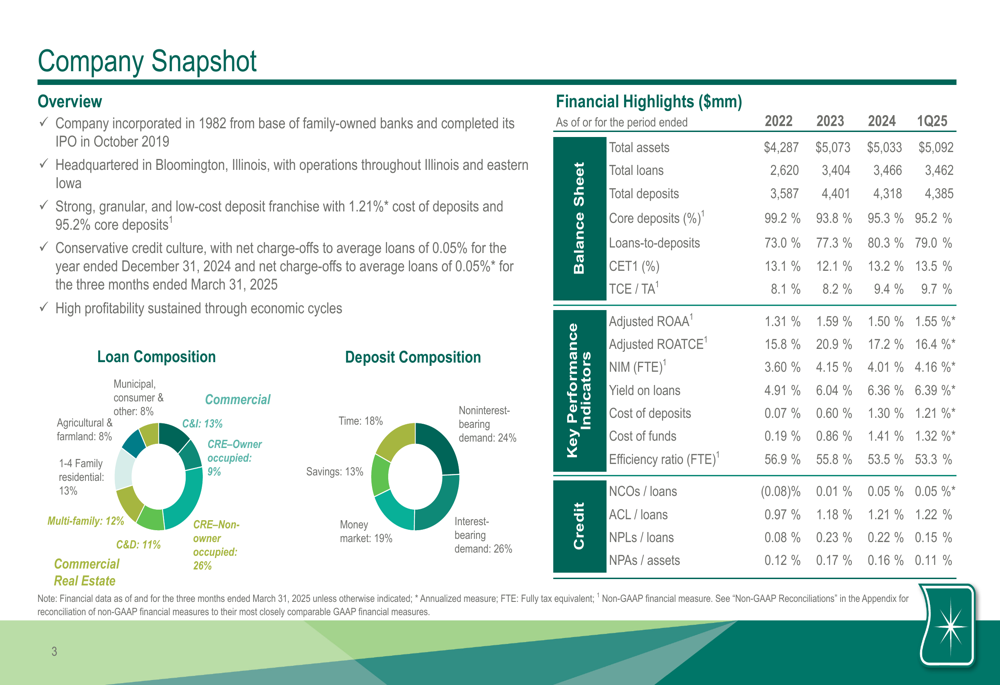
HBT Financial, Inc. (NASDAQ:HBT) presented its Q1 2025 earnings results on April 21, 2025, highlighting strong profitability metrics and improved asset quality. Despite the positive financial performance, the stock was down 3.82% in trading, with shares at $21.99 after falling $0.84.
The Illinois-based regional bank continues to benefit from its low-cost deposit franchise and conservative credit culture, maintaining solid performance metrics that have earned it recognition in several industry rankings. The company was recently ranked 7th out of 200 in the Forbes 2025 America’s Best Banks ranking, 16th in S&P Global Market Intelligence’s 2024 large US community bank ranking, and 12th among community banks with $5-10 billion in assets in Bank Director’s Best U.S. Banks 2024 edition.
Quarterly Performance Highlights
HBT Financial reported net income of $19.1 million, or $0.60 per diluted share, for the first quarter of 2025. Adjusted net income was slightly higher at $19.3 million, or $0.61 per diluted share. The company achieved a return on average assets (ROAA) of 1.54% and return on average tangible common equity (ROATCE) of 16.20%, with adjusted figures at 1.55% and 16.36%, respectively.
Tangible book value per share showed strong growth, increasing 4.3% from December 31, 2024, and 17.0% year-over-year from March 31, 2024. Total (EPA:TTEF) assets stood at $5.09 billion at quarter-end, with total loans of $3.46 billion and total deposits of $4.39 billion.
As shown in the following comprehensive financial overview from the company’s presentation:
Deposit Base and Net Interest Margin
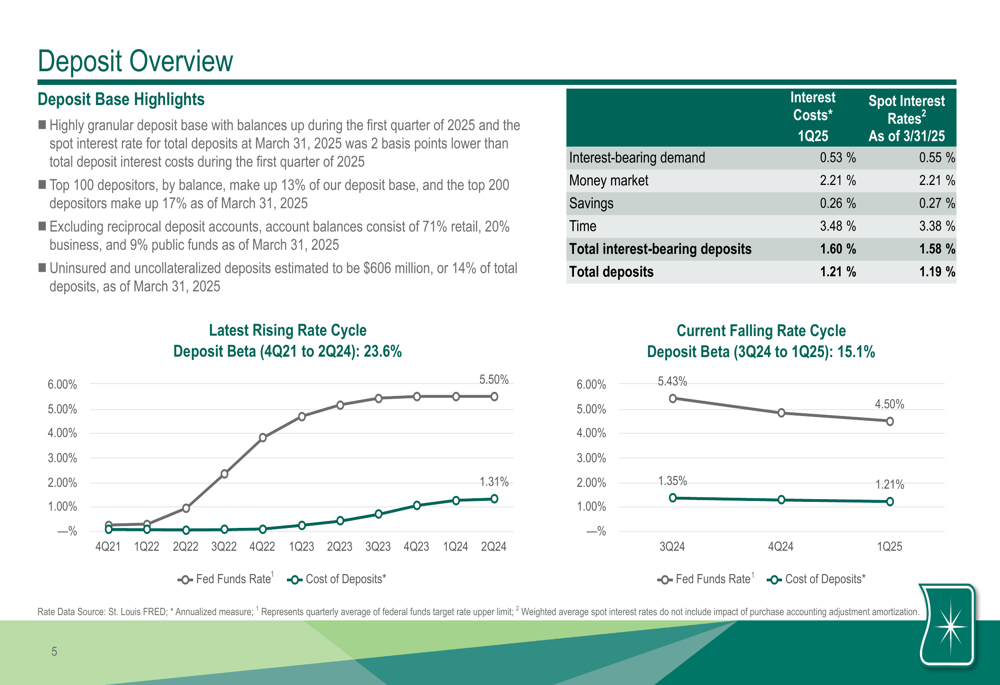
A key strength for HBT Financial continues to be its low-cost and granular deposit base. The cost of total deposits decreased 6 basis points to 1.21% in Q1 2025, while the overall cost of funds decreased 7 basis points to 1.32%. The company maintains a highly stable deposit structure with 95.2% core deposits.
HBT’s deposit beta in the current falling rate cycle stands at 15.1%, demonstrating the bank’s ability to retain pricing advantage as rates decline. The company reported that its top 100 depositors make up just 13% of the deposit base, highlighting the granular nature of its funding. Uninsured and uncollateralized deposits were estimated at $606 million, representing only 14% of total deposits.
The following chart illustrates the company’s deposit composition and rate trends:
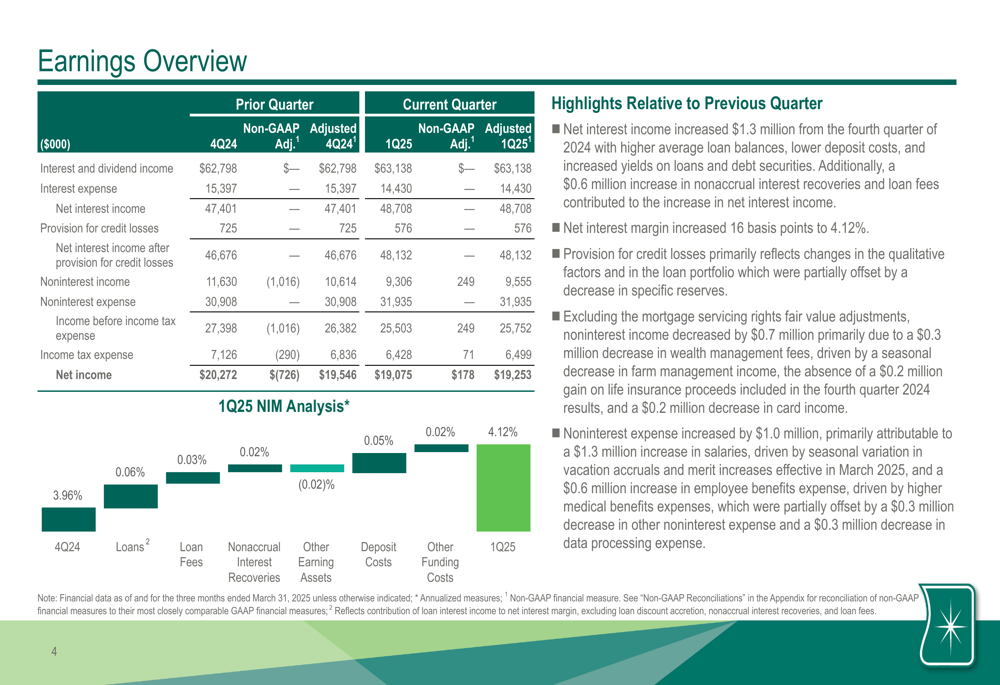
Net interest margin (NIM) expanded 16 basis points to 4.12% in Q1 2025, while NIM on a tax-equivalent basis expanded 15 basis points to 4.16%. This expansion was supported by the decreasing cost of funds and a 7 basis point increase in loan yields to 6.39%. Average loan balances increased by $73.4 million, or 2.2%, during the quarter.
The company is well-positioned for the changing rate environment, with 34% of its loan portfolio scheduled to mature or reprice within the next three months, and 44% within the next 12 months. This provides flexibility as interest rates evolve.
As illustrated in the net interest margin analysis below:
Asset Quality and Loan Portfolio
HBT Financial’s asset quality metrics improved significantly during the quarter. Nonperforming assets represented only 0.11% of total assets at March 31, 2025, down from 0.16% at December 31, 2024. Net charge-offs were just 0.05% of average loans on an annualized basis during Q1 2025, compared to 0.08% in Q4 2024.
The loan portfolio remains diversified across commercial, real estate, agricultural, and municipal sectors. Commercial real estate (CRE) loans make up a significant portion of the portfolio at $1.69 billion, with $891 million in non-owner occupied CRE, $376 million in construction and land development loans, and $424 million in multi-family loans.
The allowance for credit losses (ACL) on loans stood at 1.22% of total loans, slightly up from 1.21% at the end of 2024, reflecting the company’s conservative approach to credit risk management.
Capital Position and Liquidity
HBT Financial maintained strong capital ratios, with all measures increasing during Q1 2025. The Common Equity Tier 1 (CET1) risk-based capital ratio improved to 13.48%, while the tangible common equity to tangible assets ratio increased to 9.73%.
The company reported robust liquidity sources totaling approximately $2.17 billion as of March 31, 2025. This includes $211.6 million in cash and cash equivalents, $743.8 million in unpledged securities, $1.03 billion in available FHLB advance capacity, $106.3 million in available Federal Reserve discount window capacity, and $80 million in available Fed fund lines of credit.
The following chart illustrates the company’s strong capital position:
Business Strategy and Forward Outlook
HBT Financial’s business strategy continues to focus on preserving strong ties to communities, deploying excess deposit funding into loan growth, maintaining a prudent approach to credit underwriting, and pursuing strategic acquisitions while sustaining strong profitability.
As shown in the company’s strategic framework:
Looking ahead, management expects net interest income to increase slightly in Q2 2025, with deposit balances projected to remain flat. The company may increase debt security purchases in the coming quarter. Noninterest income is expected to increase slightly, while noninterest expense is projected to be between $31 million and $33 million per quarter in 2025.
Asset quality is expected to remain solid, and the company plans to continue its stock repurchase program, with $15 million available through January 1, 2026. Management also indicated that current capital levels and operational structure would support potential M&A activity should the right opportunity arise.
Competitive Positioning
HBT Financial’s performance relative to peers demonstrates its strong competitive position in the banking sector. The company outperforms peer medians in key metrics including capitalization, profitability, funding costs, and asset quality.
The following comparison highlights HBT’s performance versus its peer group:
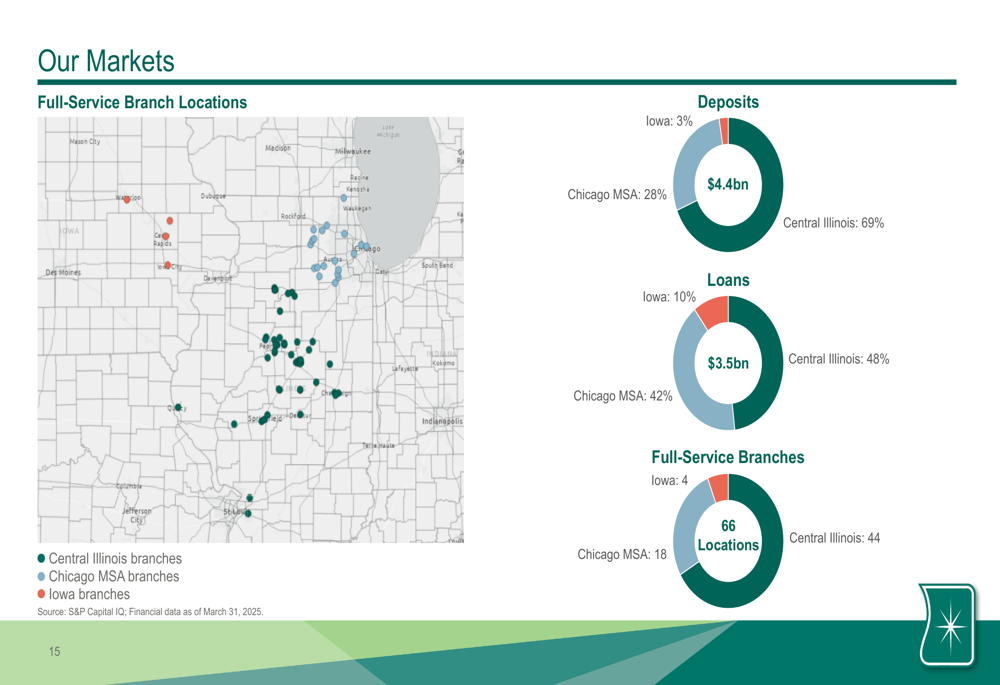
The company’s market presence is concentrated in Central Illinois (69% of deposits, 48% of loans), with growing operations in the Chicago MSA (28% of deposits, 42% of loans) and a smaller footprint in Iowa (3% of deposits, 10% of loans). This regional diversification provides both stability and growth opportunities.
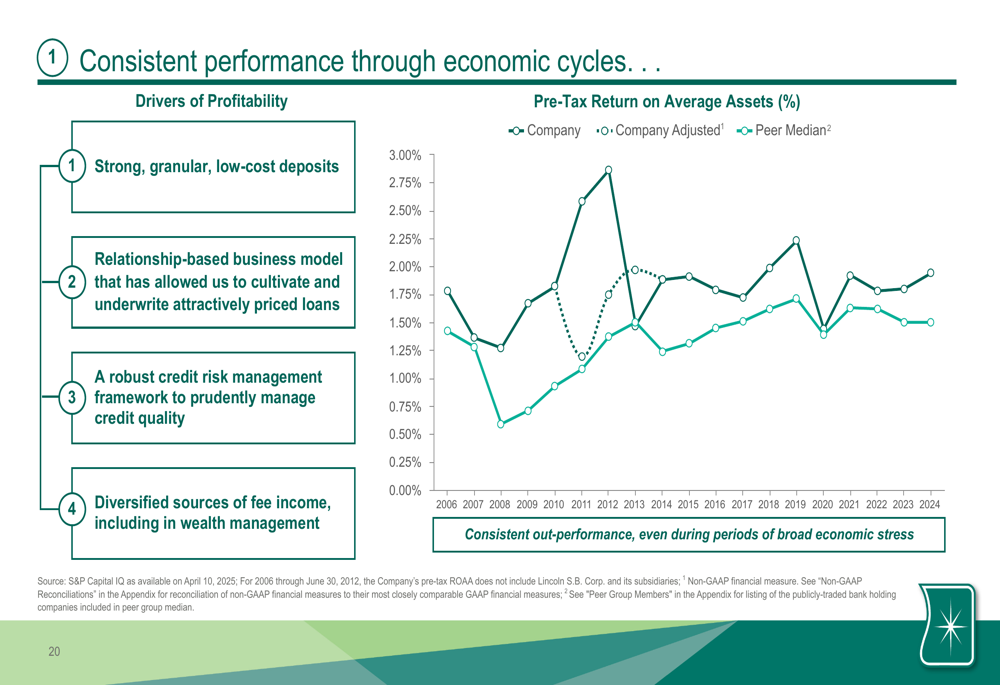
HBT Financial’s consistent performance through economic cycles, strong deposit base, track record of successful acquisitions, and prudent risk management position it well for continued success in a challenging banking environment.
Full presentation:
This article was generated with the support of AI and reviewed by an editor. For more information see our T&C.