Fannie Mae, Freddie Mac shares tumble after conservatorship comments

Helen of Troy Ltd (NASDAQ:HELE) shares plummeted over 31% in premarket trading after the company’s Q1 FY26 presentation revealed significant revenue and profit declines, primarily driven by tariff-related pressures. The consumer products company reported a 10.8% drop in consolidated net sales and a 58.6% decline in adjusted earnings per share, though management outlined a comprehensive plan to mitigate tariff impacts.
Financial Performance Highlights
Helen of Troy reported Q1 FY26 net sales of $371.7 million, down from $416.8 million in the same period last year. Gross margin contracted 160 basis points to 47.1%, while adjusted operating margin fell sharply from 10.3% to 4.3%. Adjusted diluted EPS declined to $0.41, compared to $0.99 in Q1 FY25.
As shown in the following financial results summary:
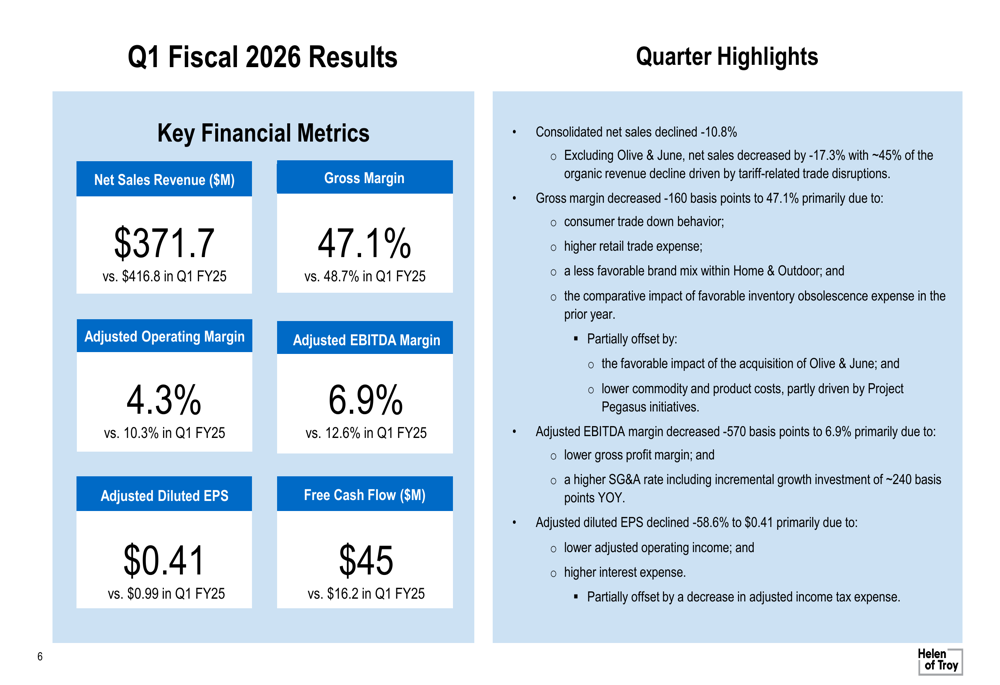
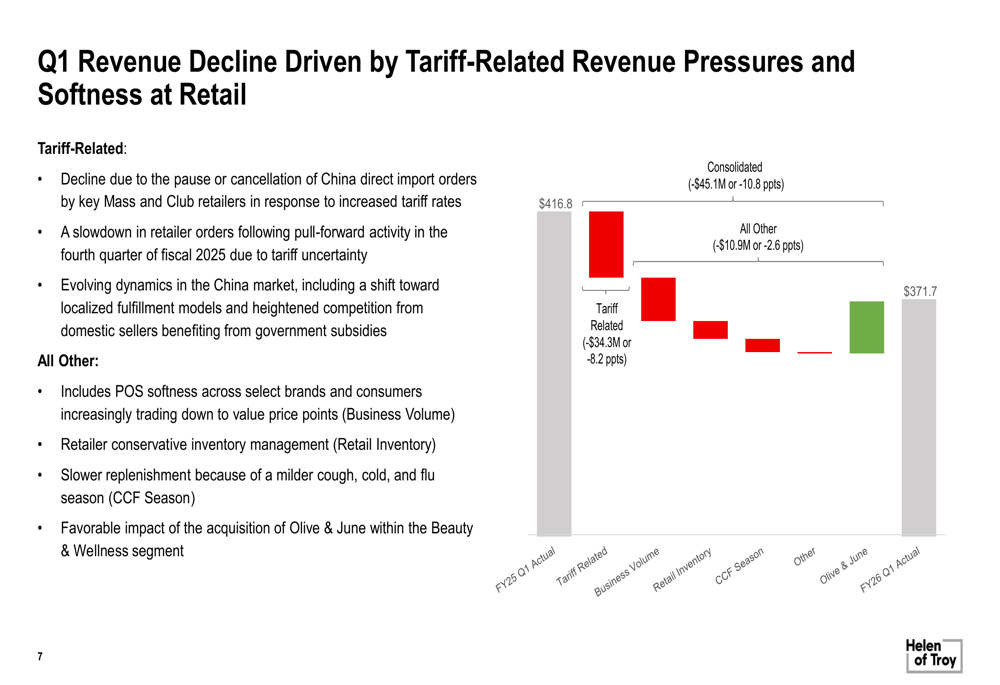
The company’s revenue decline was primarily attributed to tariff-related pressures, with management estimating these factors accounted for approximately $34.3 million or 8.2 percentage points of the decline. Other contributing factors included softer point-of-sale performance, conservative inventory management by retailers, and a milder cough, cold, and flu season.
This waterfall chart illustrates the key factors driving the revenue decline:
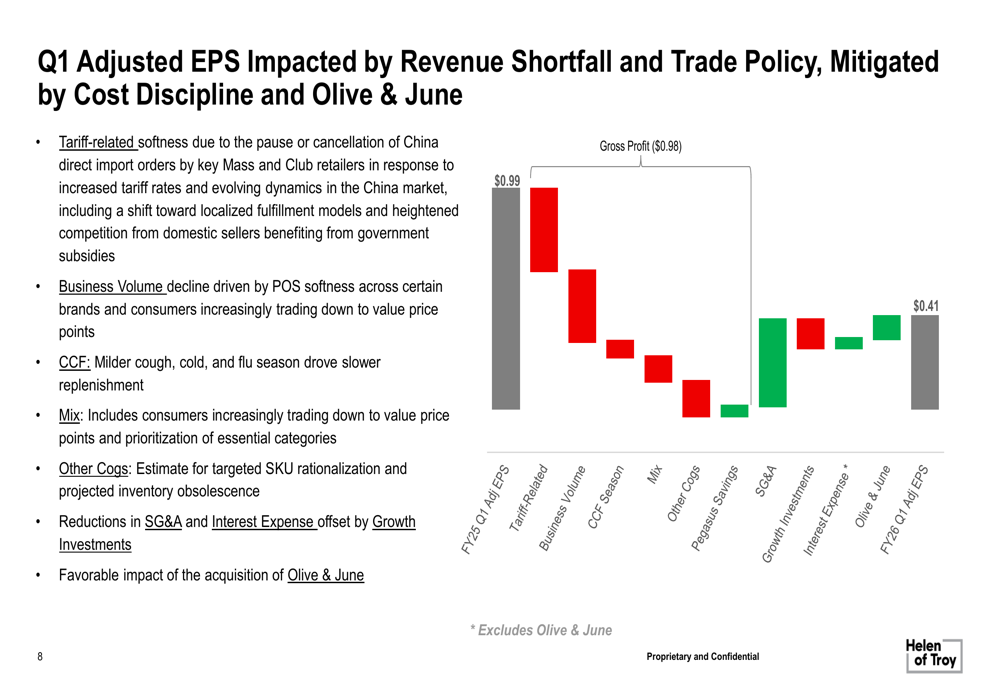
Similarly, the adjusted EPS decline was driven by multiple factors, including tariff impacts, lower business volume, and unfavorable product mix, partially offset by Project Pegasus savings and positive contributions from the Olive & June acquisition:
Tariff Mitigation Strategy
A central focus of the presentation was Helen of Troy’s comprehensive tariff mitigation plan. Without mitigation, the company estimated FY26 tariff impacts could exceed $60-70 million. However, through a series of strategic actions, management expects to reduce the net impact to less than $15 million.
The following chart shows the tariff impact by business segment and mitigation efforts:
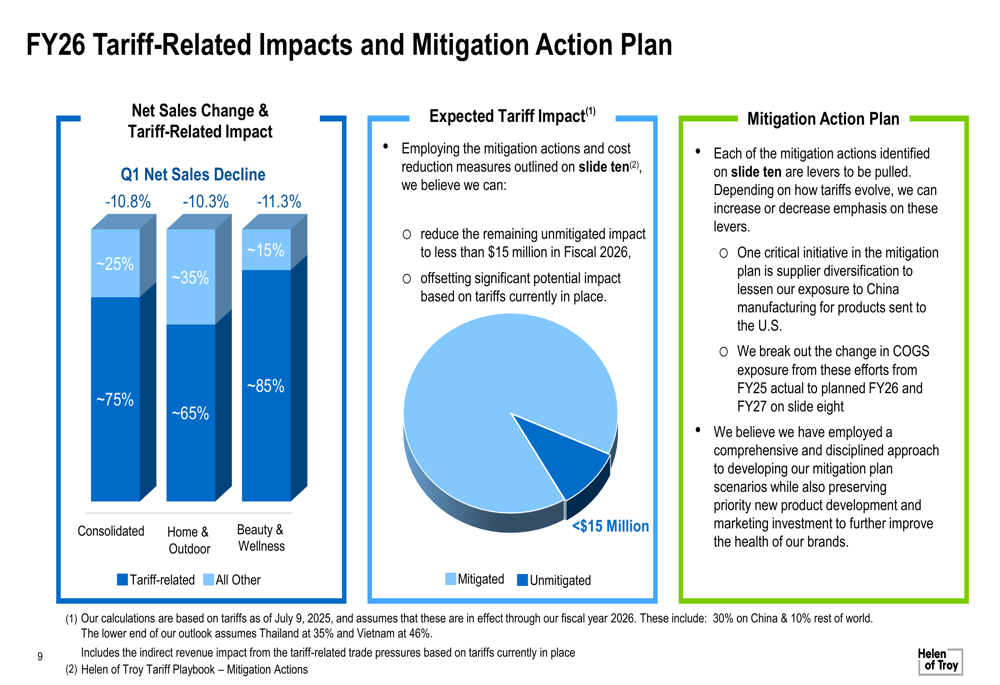
The company’s tariff playbook includes five key elements: inventory management, supplier diversification, SKU prioritization, partnerships with customers and suppliers, and expense management. A critical component is reducing exposure to Chinese imports by approximately 25% of consolidated cost of goods sold by the end of fiscal 2026.
This supplier diversification plan shows the company’s shift from Chinese to Vietnamese manufacturing:
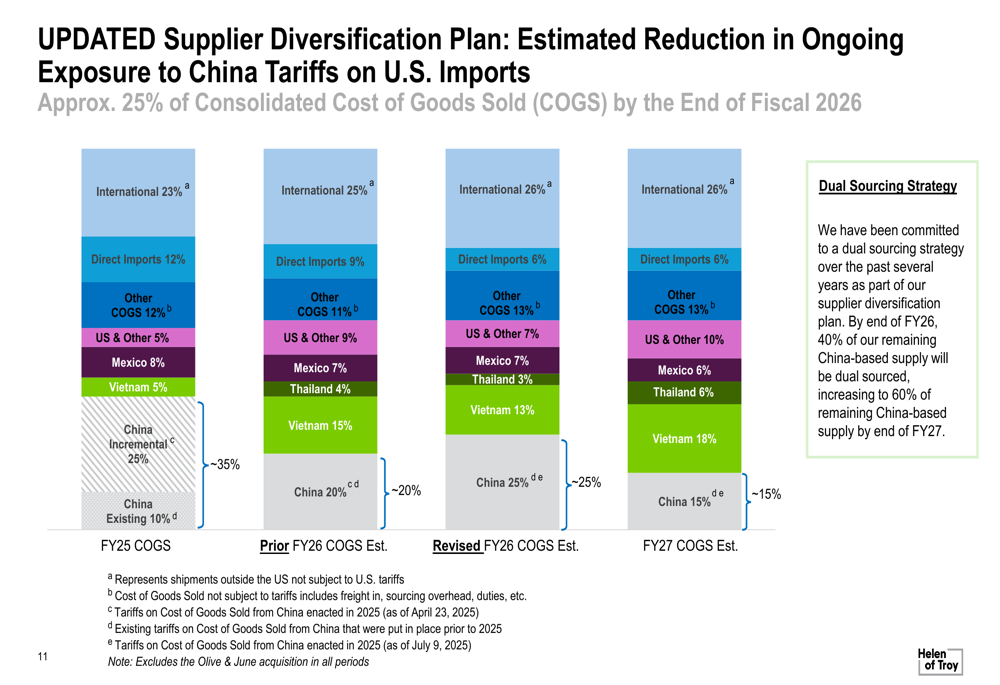
"We can reduce our FY26 net tariff impact on operating income to less than $15 million," management stated in the presentation, outlining how various mitigation actions will offset the majority of the potential $60-70 million gross impact.
Outlook and Guidance
For Q2 FY26, Helen of Troy expects consolidated net sales between $408 million and $432 million, representing a decline of 8.9% to 14.0% compared to the prior year. Adjusted diluted EPS is projected at $0.45 to $0.60, down 50.4% to 62.8% year-over-year.
The Q2 outlook details are presented here:
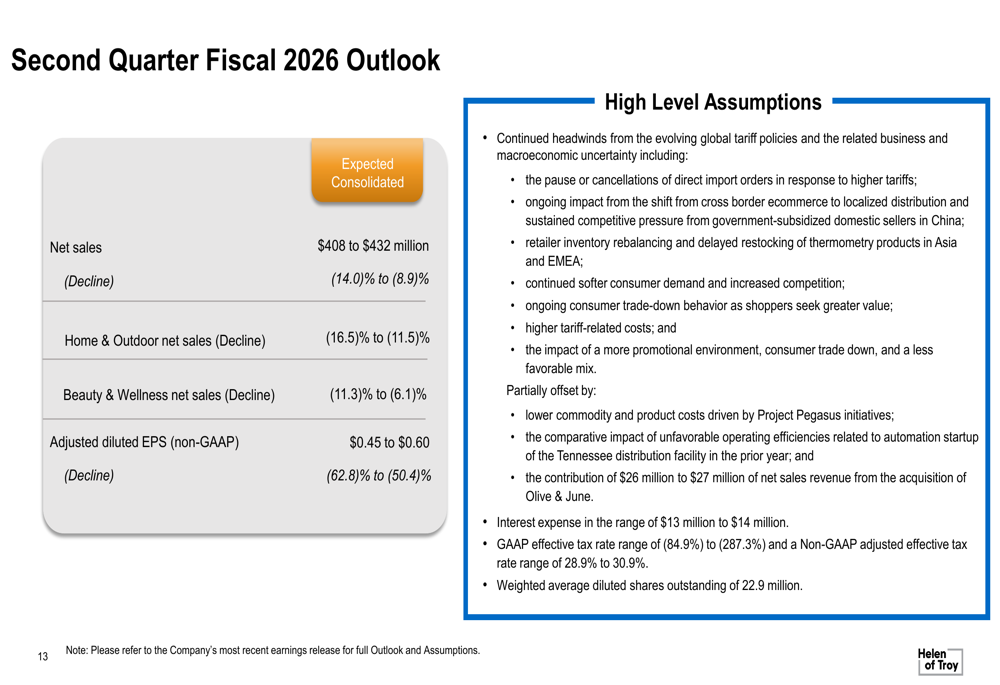
Management characterized fiscal 2026 as "a tale of two halves," with significant headwinds in the first half giving way to more favorable conditions in the second half. First-half challenges include tariff-related trade disruption and retailer inventory adjustments, while second-half tailwinds include retail price increases of 7-10% (effective September 1st) and greater efficiency at the company’s Tennessee distribution facility.
Leadership and Strategic Direction
The presentation introduced Helen of Troy’s interim leadership team, with Brian Grass serving as Interim CEO and Tracy Scheuerman as Interim CFO. Key priorities include restoring confidence within the organization, improving go-to-market effectiveness, refocusing on innovation, and reinvigorating company culture.
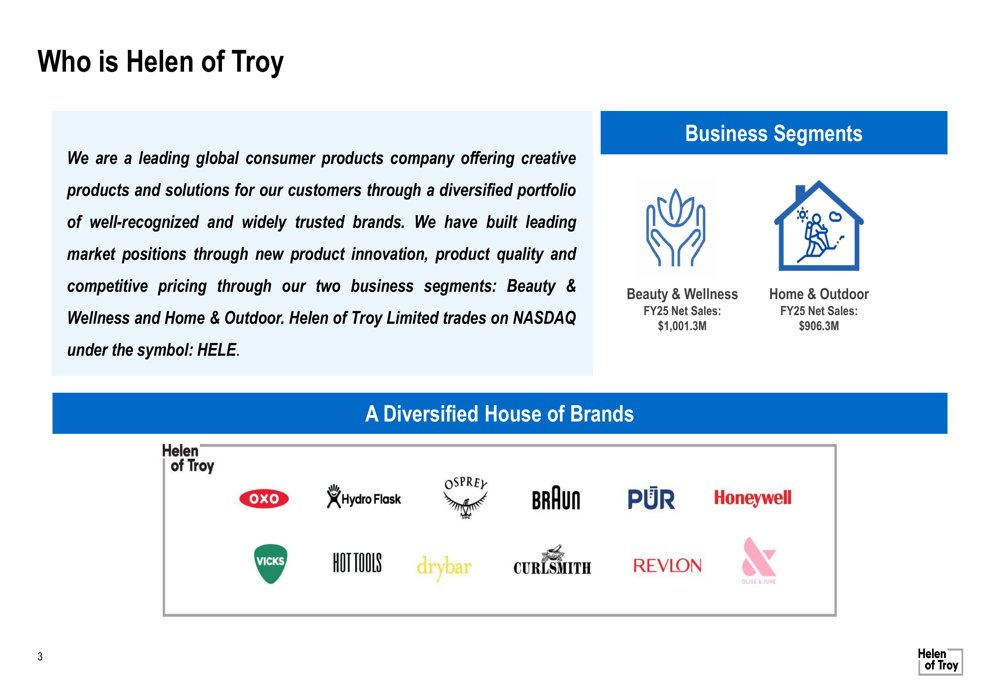
Helen of Troy operates through two business segments: Beauty & Wellness (FY25 net sales of $1,001.3 million) and Home & Outdoor (FY25 net sales of $906.3 million). The company’s diverse brand portfolio includes OXO, Hydro Flask, Osprey, Braun, PUR, Honeywell (NASDAQ:HON), Vicks, HOT TOOLS, drybar, CURLSMITH, REVLON, and OLIVE & JUNE.
The company’s overview and brand portfolio is illustrated here:
Market Reaction and Investment Thesis
Despite management’s efforts to highlight positive developments, including U.S. point-of-sale unit growth in 8 out of 11 key brands and strong free cash flow of $45 million (up from $16.2 million last year), investors responded negatively to the results. The stock was down 31.61% in premarket trading, trading at $21.20, significantly below its 52-week range of $21.20 to $77.95.
The presentation concluded with management’s investment thesis, emphasizing the company’s interim leadership expertise, strong free cash flow, disciplined capital allocation, and M&A track record:
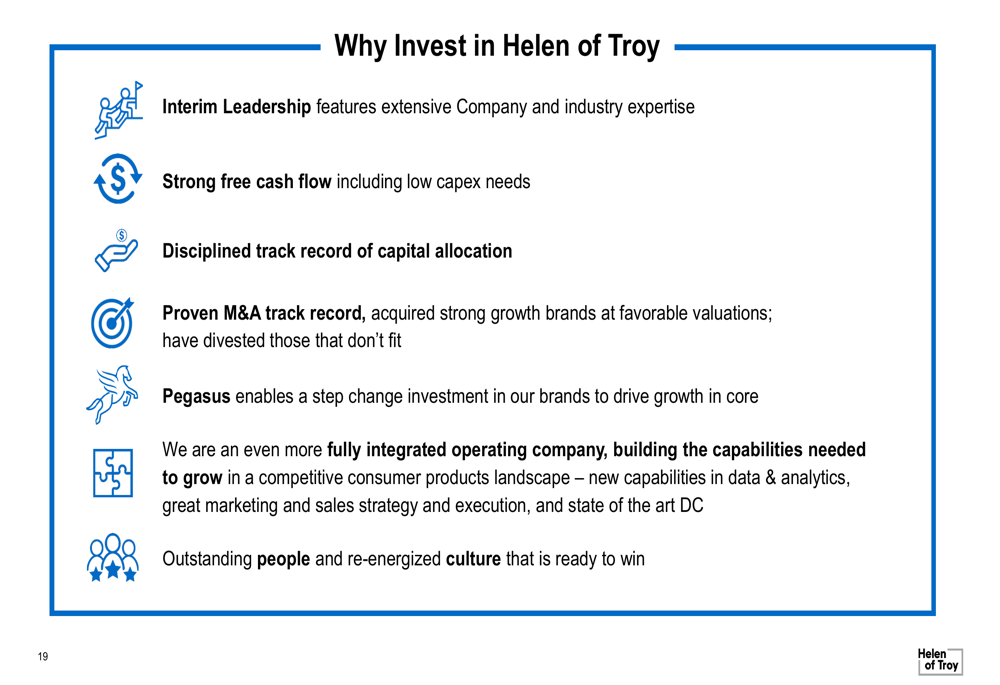
However, the stark contrast between this optimistic investment case and the market’s reaction highlights investor concerns about the company’s ability to navigate the challenging tariff environment and return to growth in the near term. The company’s actual performance in the coming quarters will be crucial in determining whether management’s "tale of two halves" narrative materializes as projected.
Full presentation:
This article was generated with the support of AI and reviewed by an editor. For more information see our T&C.