Missed the webinar? Here are Investing.com’s top 10 stock picks for 2026

Introduction & Market Context
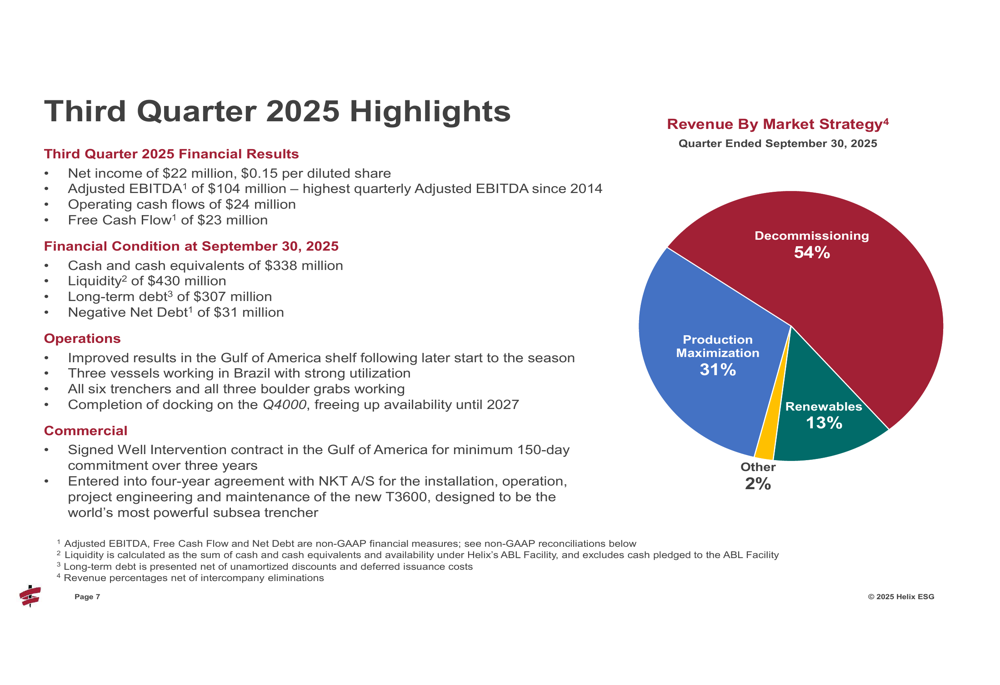
Helix Energy Solutions Group Inc. (NYSE:HLX) released its third quarter 2025 earnings presentation on October 23, showing a mixed performance that nonetheless triggered a significant market response. The offshore energy services provider reported quarterly revenue of $377 million, exceeding analyst expectations of $359.57 million, though its earnings per share of $0.15 fell short of the forecasted $0.17. This revenue beat, coupled with the company's strong balance sheet and strategic positioning, contributed to a 16.14% surge in Helix's stock during premarket trading, reaching $7.70.
The company positions itself as an enabler of energy transition through three strategic areas: maximizing existing reserves, lowering decommissioning costs, and supporting offshore renewables and wind farms. This diversification strategy is reflected in its revenue breakdown, with decommissioning representing the largest segment at 54% of revenue, followed by production maximization at 31% and renewables at 13%.
Quarterly Performance Highlights
Helix reported third quarter 2025 revenue of $377 million, up from $342 million in the same period last year, representing a 10.2% year-over-year increase. However, net income declined to $22 million ($0.15 per diluted share) from $30 million ($0.19 per diluted share) in Q3 2024. The company highlighted its Adjusted EBITDA of $104 million as the highest since 2014, up from $88 million in Q3 2024.
As shown in the following comprehensive financial summary:
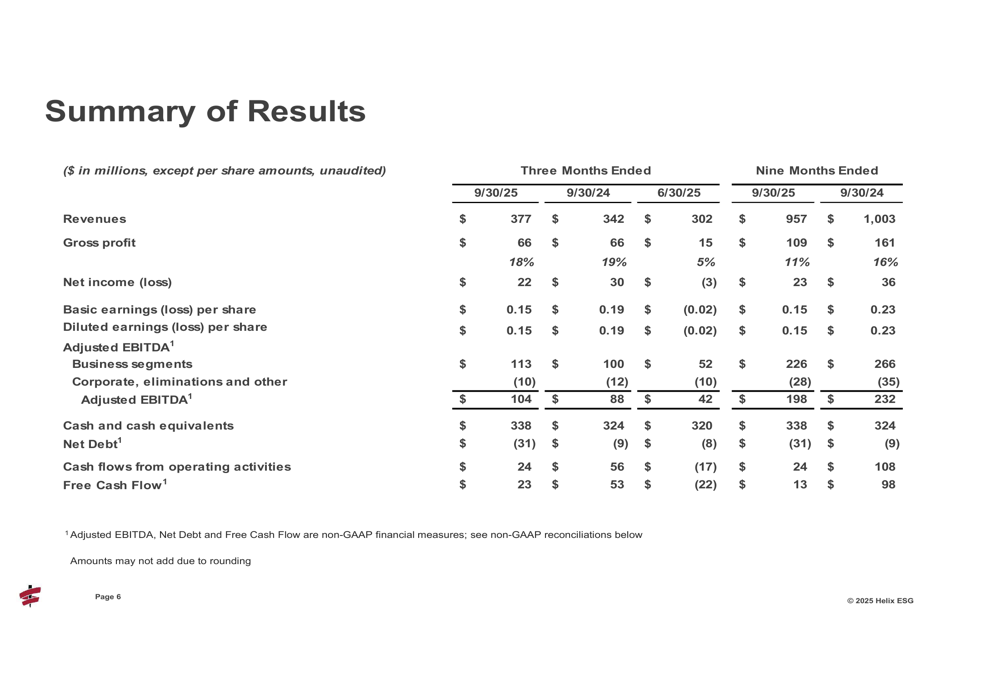
The company's financial condition remains robust, with $338 million in cash and cash equivalents and negative net debt of $31 million as of September 30, 2025. Free cash flow for the quarter was $23 million, though this represented a significant decrease from $53 million in the same period last year.
The third quarter highlights presentation provides a clear overview of the company's performance across all segments, including the revenue breakdown by market strategy:
Operational Analysis
Helix's performance varied significantly across its three main business segments: Well Intervention, Robotics, and Shallow Water Abandonment.
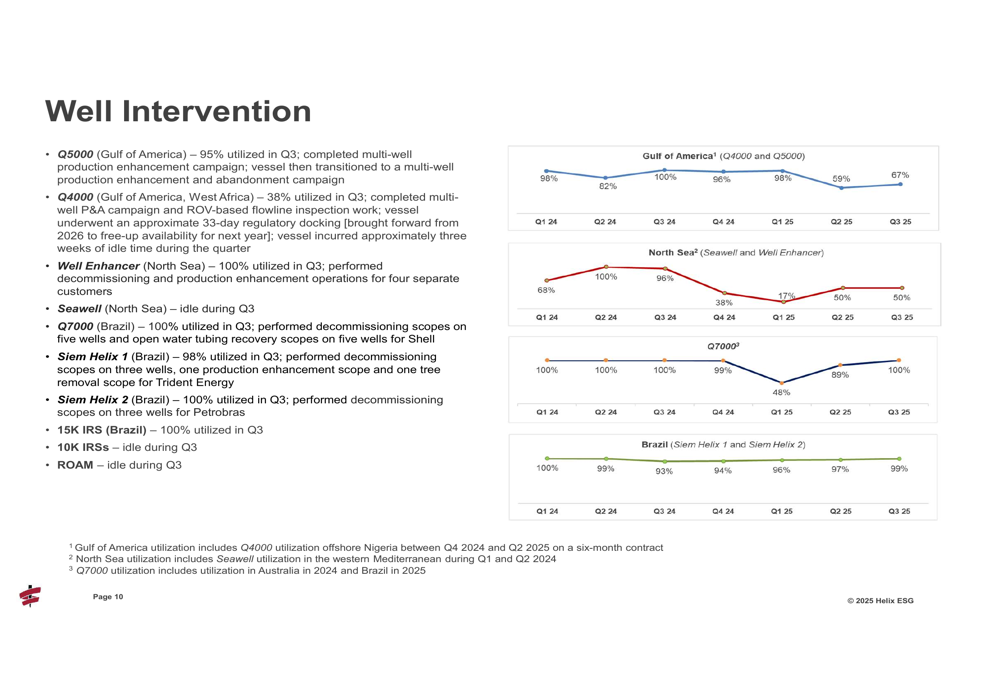
The Well Intervention segment generated $193 million in revenue for Q3 2025, up from $175 million in Q3 2024. However, gross profit margin declined from 11% to 6% year-over-year, and vessel utilization dropped from 97% to 76%. Regional performance varied considerably, with Brazil operations maintaining strong utilization rates near 99%, while North Sea operations struggled with just 50% utilization in Q3.
The following chart illustrates the Well Intervention vessel utilization rates across different regions:
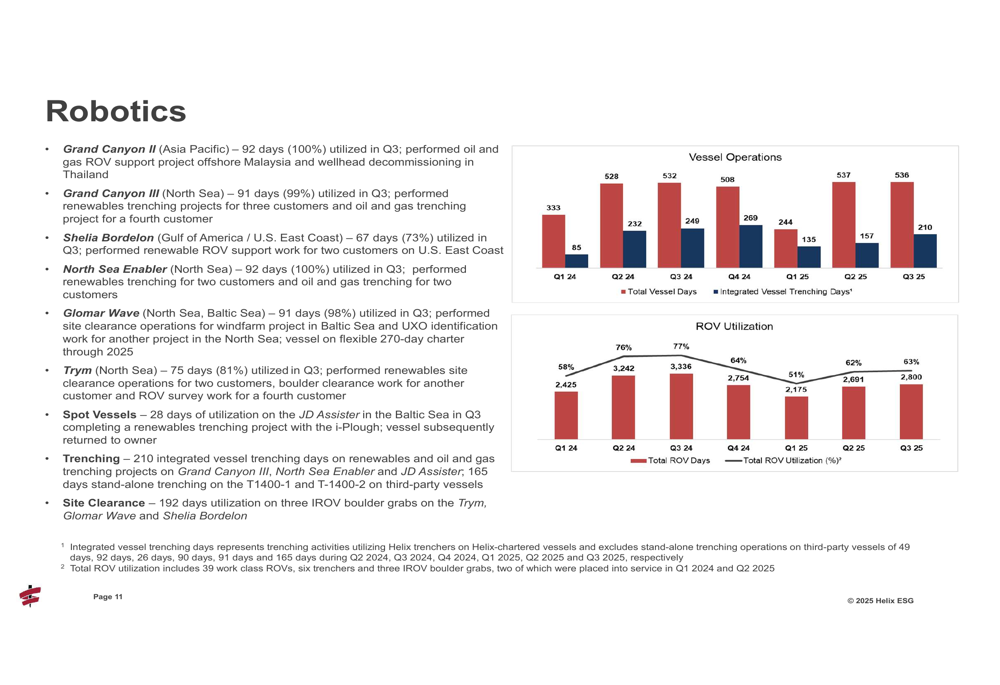
In contrast, the Robotics segment demonstrated strong performance with $99 million in revenue, up from $85 million in Q3 2024. This segment benefited from high vessel utilization rates, with the Grand Canyon II (Asia Pacific) and North Sea Enabler achieving 100% utilization, and the Grand Canyon III (North Sea) at 99%.
The Robotics segment's operational metrics show the strength of this business unit:
Financial Position & Capital Allocation
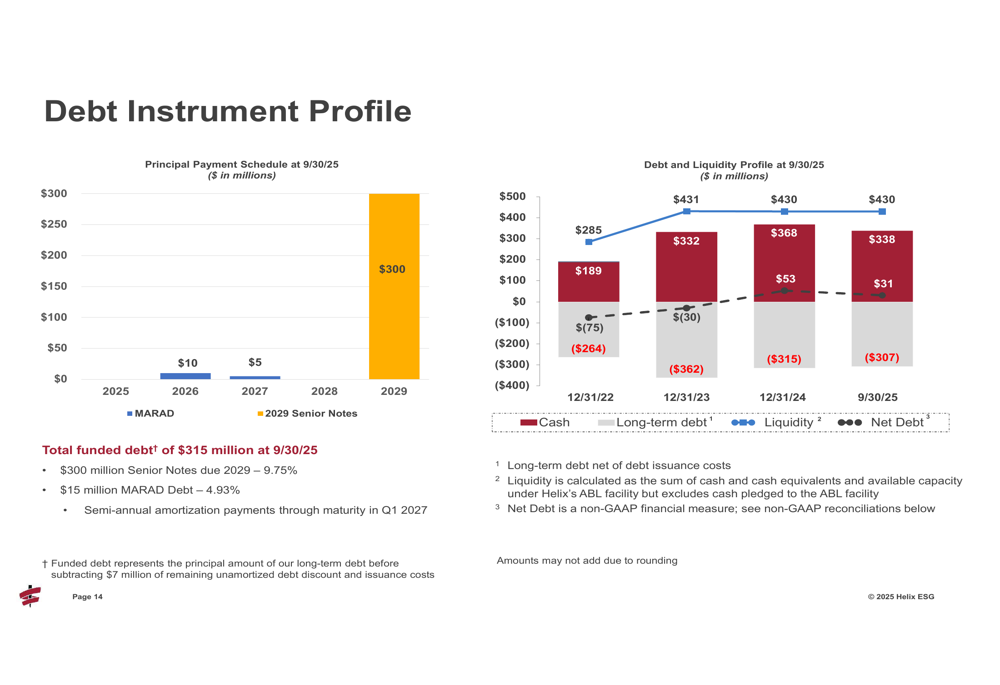
Helix maintains a strong balance sheet with $338 million in cash and cash equivalents and total liquidity of $430 million as of September 30, 2025. The company's debt profile is favorable, with no significant maturities until 2029 when $300 million in Senior Notes at 9.75% come due.
The company's debt instrument profile and liquidity position are illustrated in the following chart:
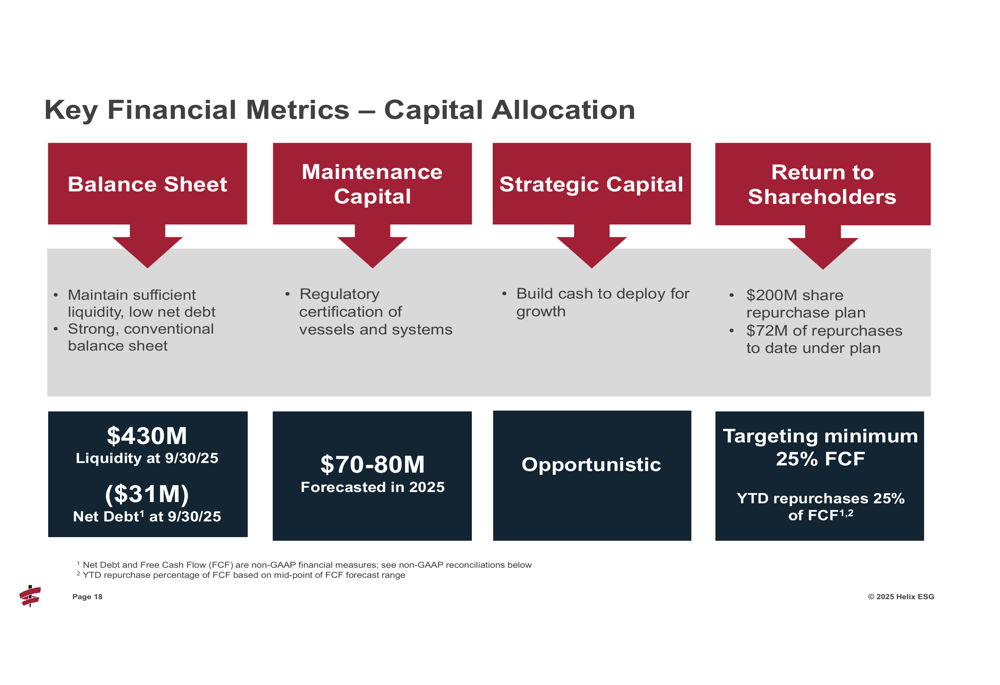
Helix has implemented a shareholder-friendly capital allocation strategy, targeting a minimum of 25% of free cash flow for share repurchases. Year-to-date, the company has repurchased approximately 4.6 million shares for $30 million under its $200 million repurchase authorization.
The company's capital allocation framework balances balance sheet strength, maintenance capital, strategic growth, and shareholder returns:
Forward Outlook
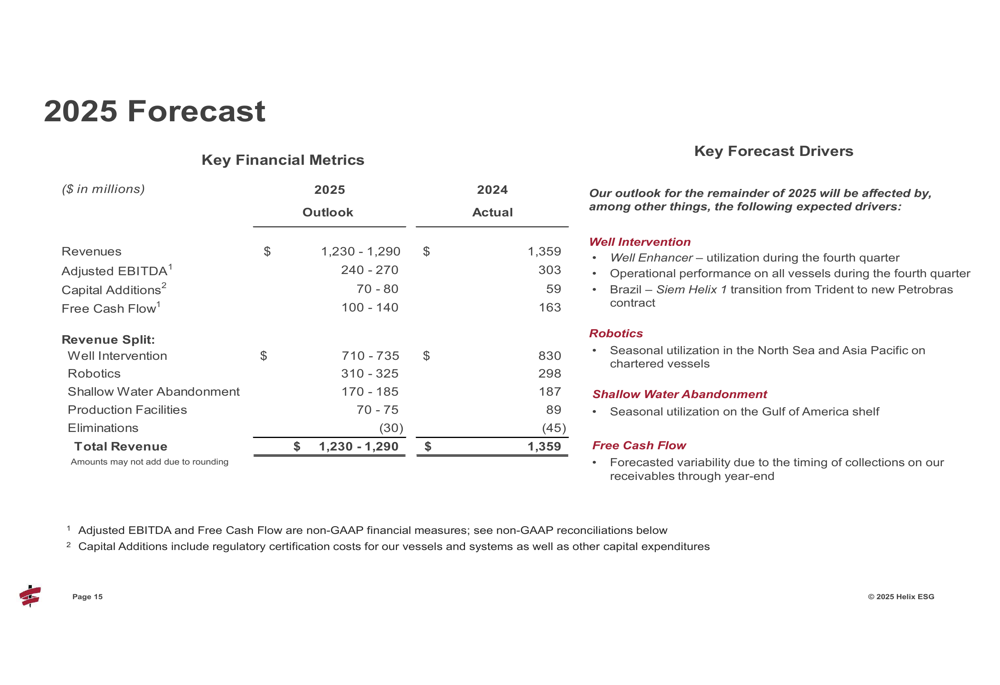
Helix's 2025 forecast indicates some moderation compared to 2024 results, with projected revenues of $1,230-$1,290 million versus $1,359 million in 2024, and Adjusted EBITDA of $240-$270 million compared to $303 million in 2024. The company expects free cash flow of $100-$140 million, down from $163 million in 2024.
The detailed 2025 forecast is presented in the following chart:
Looking beyond 2025, Helix projects continued strength in its financial position, with negative net debt expected to exceed $100 million entering 2026. The company reports a backlog of $1.3 billion, with $540 million allocated for 2026 and $560 million for 2027 and beyond, providing solid visibility for future revenues.
During the earnings call, CEO Owen Kratz expressed optimism about market conditions, stating, "We believe we're in a trough, but at the cusp of an upcycle." This sentiment, combined with the company's strong balance sheet and diverse service offerings, appears to have resonated with investors despite the mixed quarterly results.
The company faces several challenges, including regulatory issues in the UK North Sea, rising supply chain and labor costs, and operational difficulties in the shallow water abandonment market. However, its strategic positioning across multiple offshore energy segments and strong financial foundation provide resilience against these headwinds.
With its stock trading at 6.79% above the previous close following the earnings release, market sentiment appears to be focusing on Helix's revenue growth and long-term potential rather than the quarterly earnings miss.
Full presentation:
This article was generated with the support of AI and reviewed by an editor. For more information see our T&C.