Dollar edges higher ahead of Fed minutes; sterling gains after CPI increase

Heritage Financial Corporation (NASDAQ:HFWA) presented its Q2 2025 investor slides on July 24, 2025, revealing continued profitability challenges despite ongoing strategic initiatives. The bank’s stock declined 3.43% to $24.10 following the presentation, reflecting investor concerns about the company’s performance trajectory.
Quarterly Performance Highlights
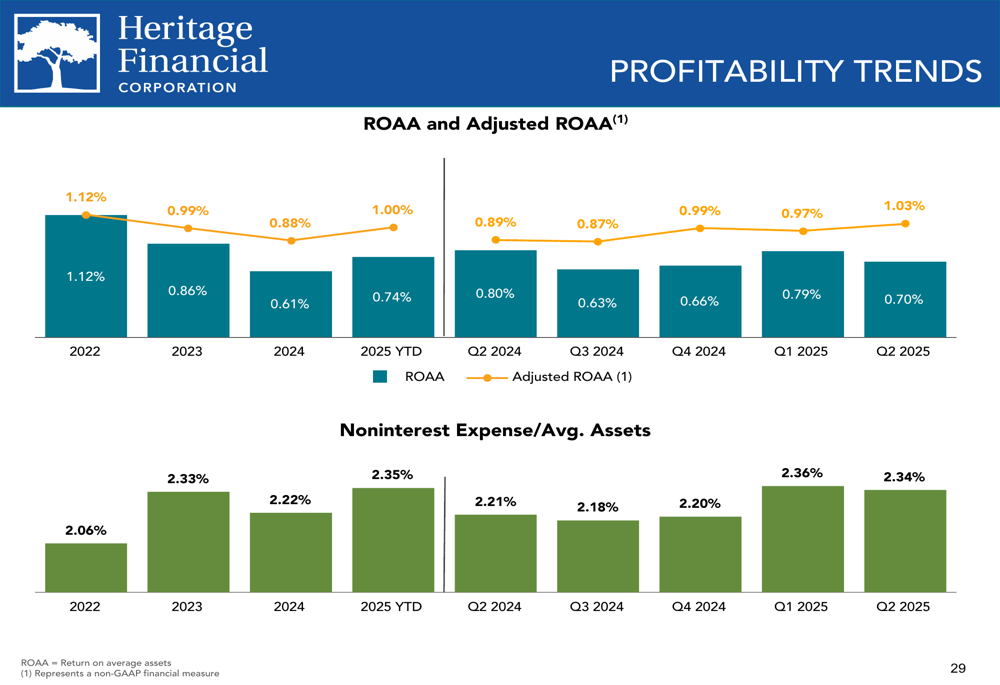
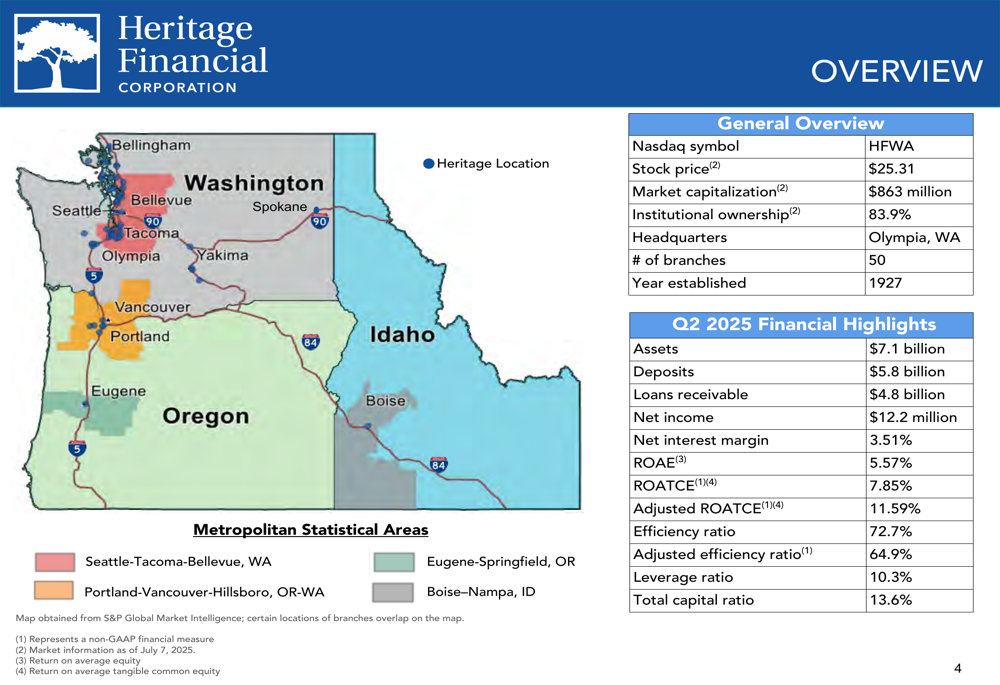
Heritage Financial reported Q2 2025 net income of $12.2 million, a significant decrease from the same period in previous years. The company’s key profitability metrics showed mixed results, with net interest margin improving to 3.51% while return on average equity (ROAE) declined to 5.57% and return on average assets (ROAA) fell to 0.70%.
The company emphasized adjusted metrics that paint a more favorable picture, with adjusted return on average tangible common equity (ROATCE) at 11.59% compared to the GAAP ROATCE of 7.85%. Similarly, the adjusted efficiency ratio of 64.9% compared favorably to the GAAP efficiency ratio of 72.7%.
As shown in the following chart of profitability trends, Heritage’s net income and return metrics have declined significantly since 2022:
The bank’s loan portfolio continued to grow, with total loans receivable reaching $4.8 billion in Q2 2025. The loan composition shows diversification across various sectors, with commercial real estate remaining the largest component.
The following chart illustrates the loan portfolio composition and its evolution over recent quarters:

Strategic Initiatives
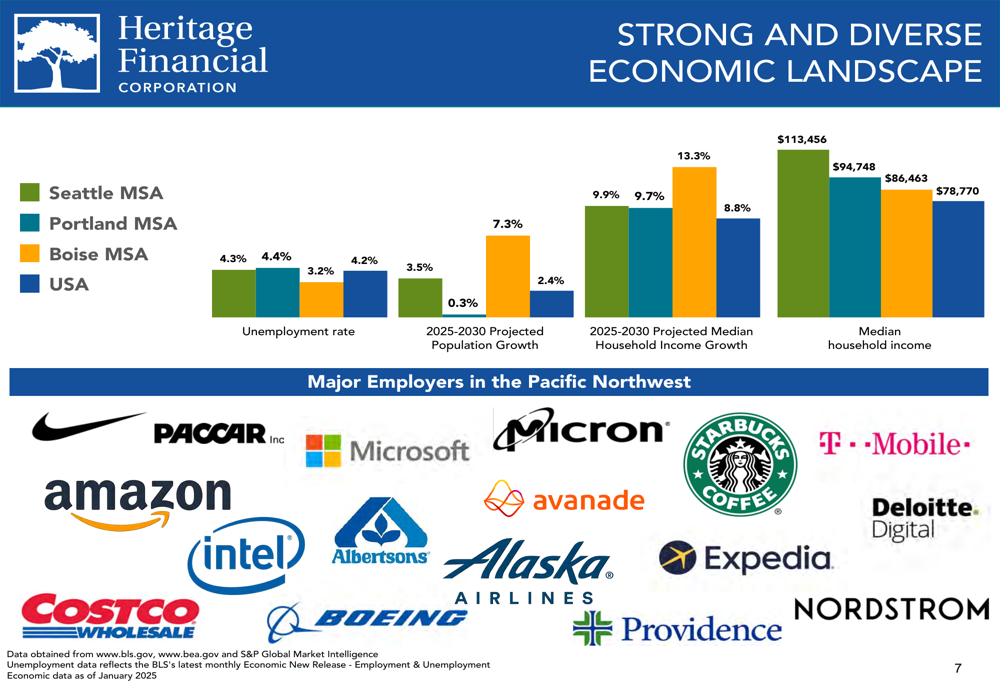
Heritage Financial continues to focus on its strategy of building a strong regional presence in the Pacific Northwest. The company operates 50 branches across Washington, Oregon, and Idaho, with a particular concentration in the Seattle metropolitan area, which accounts for 48.6% of loans and 44.0% of deposits.
The geographic distribution of the bank’s loans and deposits is illustrated in the following charts:
The company’s strategic priorities include organic growth, operational efficiency improvements, disciplined M&A approach, conservative underwriting, focus on core deposits, and proactive capital management. In 2025, Heritage expanded into the Spokane market with a new team, continuing its growth trajectory in the Pacific Northwest.
As shown in the following strategy overview, Heritage has maintained a consistent approach to growth and profitability:
Heritage has been actively repositioning its balance sheet to improve profitability, selling $91.6 million in investments during Q2 2025, resulting in a $6.9 million loss but an expected annualized pre-tax financial impact of $2.3 million. This follows similar actions in previous quarters aimed at optimizing the balance sheet structure.
Detailed Financial Analysis
Heritage’s deposit base remained relatively stable at $5.8 billion, though the composition has shifted over time. Noninterest demand deposits decreased to 27.4% of total deposits in Q2 2025, down from 35.5% in 2022, reflecting the industry-wide challenge of deposit migration in the current interest rate environment.
The following chart shows the evolution of deposit composition and costs:
The bank’s net interest margin has shown improvement, reaching 3.51% in Q2 2025, up from 3.33% in 2022. This positive trend contrasts with the declining profitability metrics, suggesting that while the core banking spread has improved, other factors are weighing on overall performance.
As illustrated in the following chart, net interest margin has been on an upward trajectory:
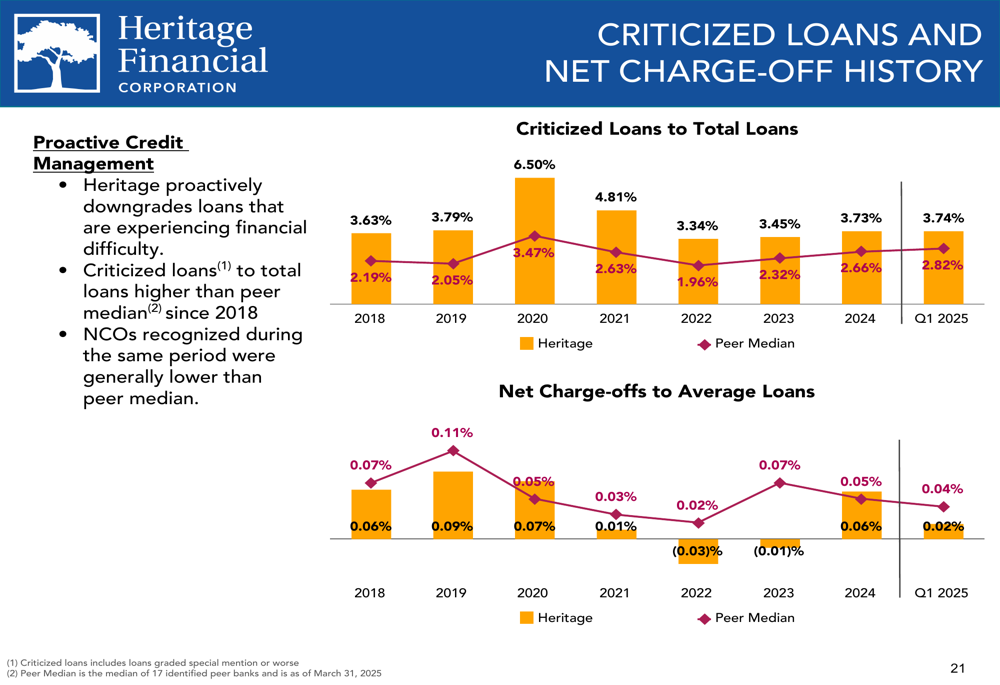
Credit quality metrics showed some deterioration, with nonaccrual loans increasing to $10 million in Q2 2025 from $6 million in 2022, though net charge-offs remained relatively low at 0.04% in Q2 2025. The allowance for credit losses on loans stood at 1.10% of total loans.
Capital ratios remained strong, with a leverage ratio of 10.3% and a total capital ratio of 13.6%, providing a solid foundation for the bank’s operations and potential growth initiatives.
Forward-Looking Statements
Heritage Financial continues to focus on shareholder returns, maintaining a dividend yield of 3.79% with quarterly dividends of $0.24 per share. The company’s tangible book value per share has shown steady growth, reaching $18.99 in Q2 2025, up from $11.86 in 2016.
The following chart illustrates the company’s shareholder return metrics:

Looking ahead, Heritage is positioning itself for potential growth through both organic expansion and strategic acquisitions. The company has identified numerous potential M&A targets in its footprint, with 36 banks in the $200 million to $3.5 billion asset range that could be acquisition candidates.
Heritage’s Q2 2025 presentation follows a disappointing Q1 2025, where the company missed EPS forecasts ($0.40 vs. expected $0.45) and reported revenue below expectations ($57.59 million vs. expected $61.74 million). The continued stock price pressure suggests investors remain concerned about the bank’s ability to reverse the declining profitability trend despite its strategic initiatives.
While Heritage Financial faces profitability challenges, its strong capital position, improving net interest margin, and strategic focus on the economically robust Pacific Northwest region provide potential pathways for performance improvement in future quarters. The company’s emphasis on adjusted metrics highlights management’s view that underlying performance is stronger than GAAP figures suggest, though investors appear to remain cautious about the bank’s near-term prospects.
Full presentation:
This article was generated with the support of AI and reviewed by an editor. For more information see our T&C.