Bitcoin price today: falls to 2-week low below $113k ahead of Fed Jackson Hole

Introduction & Market Context
Hologic, Inc. (NASDAQ:HOLX) released its Q2 fiscal 2025 corporate presentation on May 1, 2025, revealing mixed quarterly results against a backdrop of long-term growth. The women’s health-focused company reported flat earnings per share and a slight revenue decline, contributing to a 1.62% drop in share price to $57.26 during regular trading, with an additional 1.8% decline in after-hours trading.
The presentation comes as Hologic navigates macroeconomic headwinds while maintaining its position as a leader in women’s health diagnostics and breast imaging. Despite the recent challenges, the company emphasized its 10-year track record of consistent growth and strong financial fundamentals.
Quarterly Performance Highlights
Hologic reported Q2’25 revenue of $1,005.3 million, representing a 1.2% year-over-year decline (0.5% in constant currency). Non-GAAP earnings per share remained flat at $1.03 compared to the same quarter last year, meeting analyst expectations.
As shown in the following detailed breakdown of Q2’25 revenue by segment:
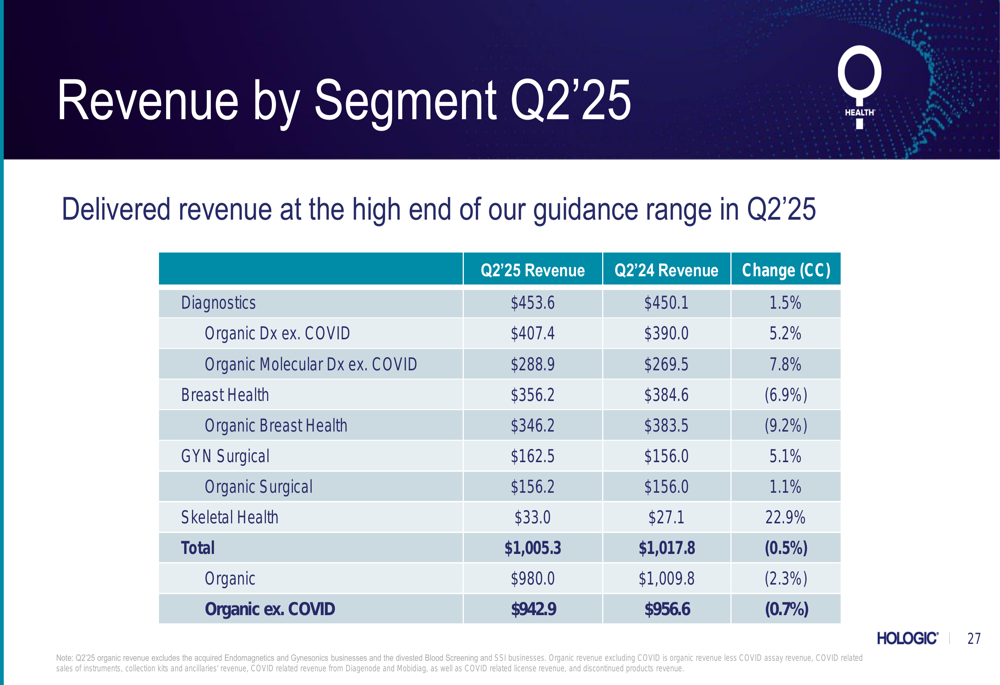
Performance varied significantly across business segments. Molecular Diagnostics (excluding COVID) showed robust growth of 7.8% in constant currency, while the Breast Health segment declined by 6.9%. The Surgical segment grew by 5.1%, and Skeletal Health delivered impressive growth of 22.9%.
The company’s overall financial performance for Q2’25 on a non-GAAP basis showed resilience in profitability metrics despite the revenue challenges:
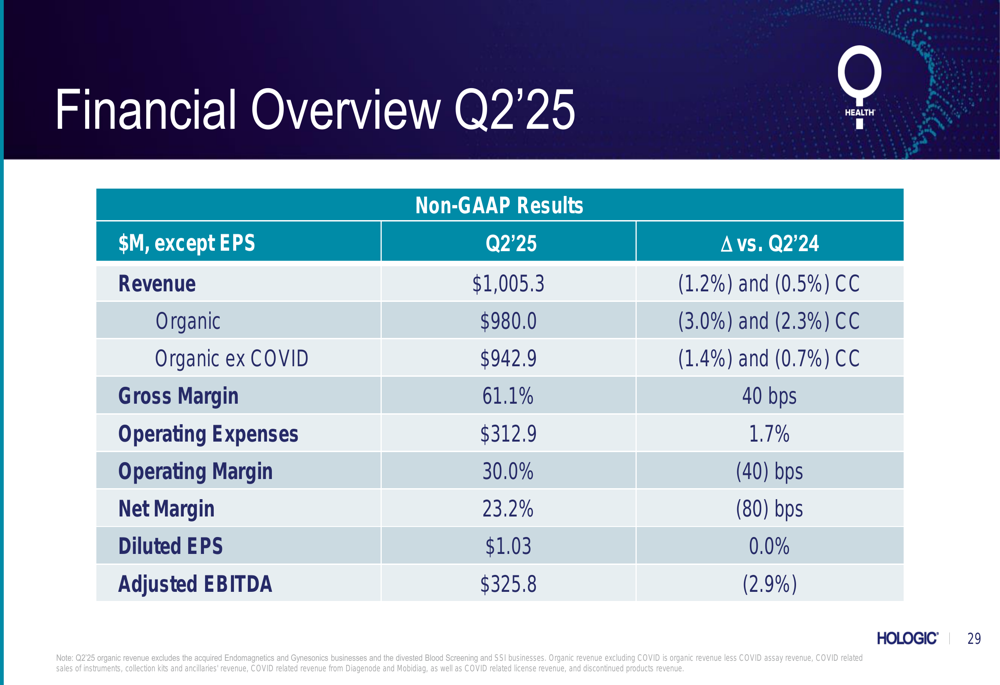
Hologic maintained a strong gross margin of 61.1%, up 40 basis points year-over-year, while operating margin decreased slightly to 30.0%, down 40 basis points. The company’s adjusted EBITDA was $325.8 million, down 2.9% compared to the same period last year.
Detailed Financial Analysis
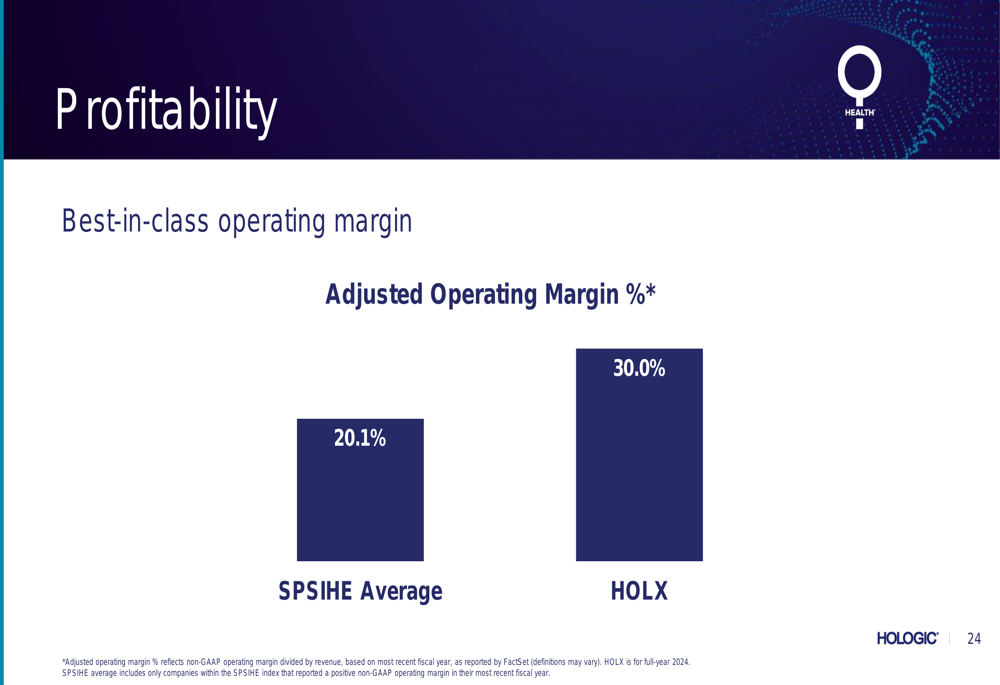
Hologic’s presentation highlighted its exceptional financial strength relative to industry peers. The company’s adjusted operating margin of 30.0% significantly outperforms the industry average of 20.1%, as illustrated in the following comparison:
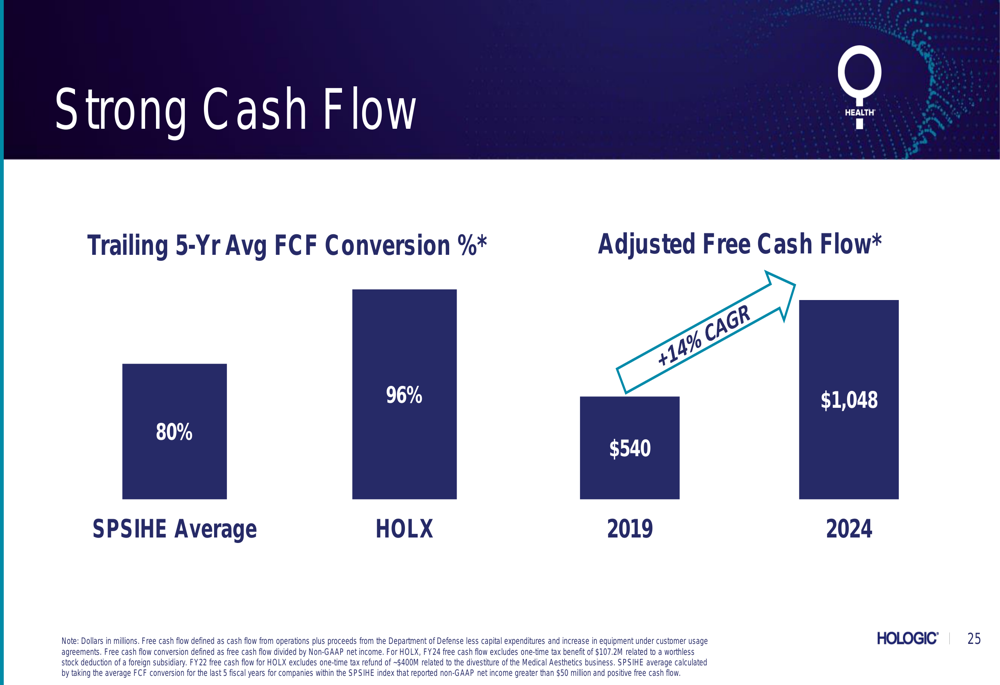
The company also emphasized its strong cash flow generation capabilities, with a trailing 5-year average free cash flow conversion rate of 96%, compared to the industry average of 80%. Adjusted free cash flow has grown at a 14% CAGR from 2019 to 2024, reaching $1,048 million.
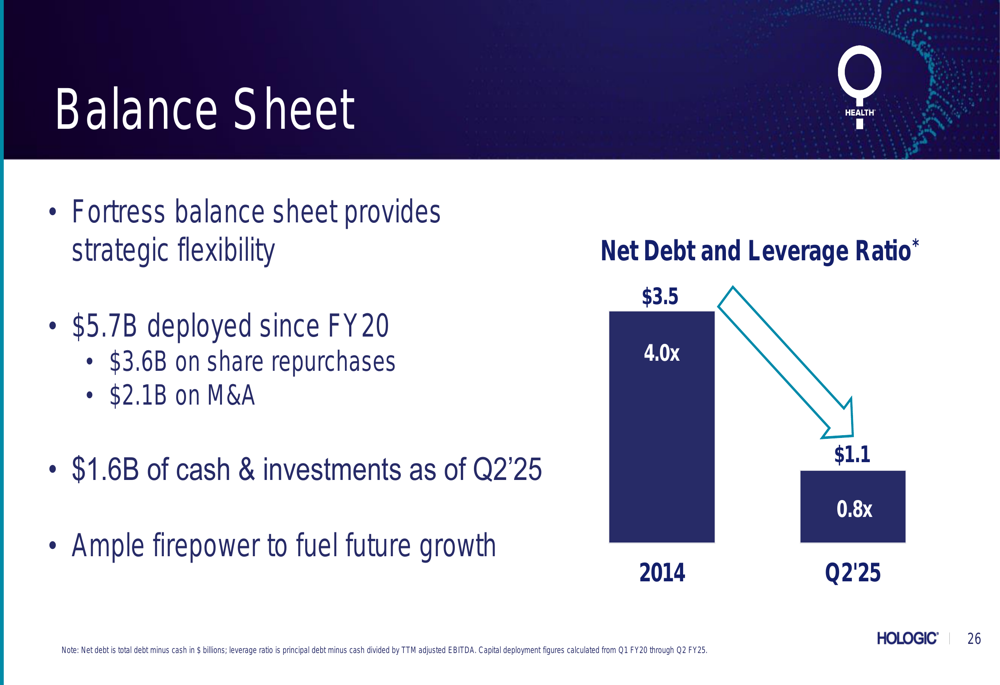
Hologic has maintained a fortress balance sheet, reducing its net debt to leverage ratio from 4.0x in 2014 to just 0.8x in Q2’25. Since fiscal 2020, the company has deployed $5.7 billion in capital, with $3.6 billion allocated to share repurchases and $2.1 billion to acquisitions.
Strategic Initiatives
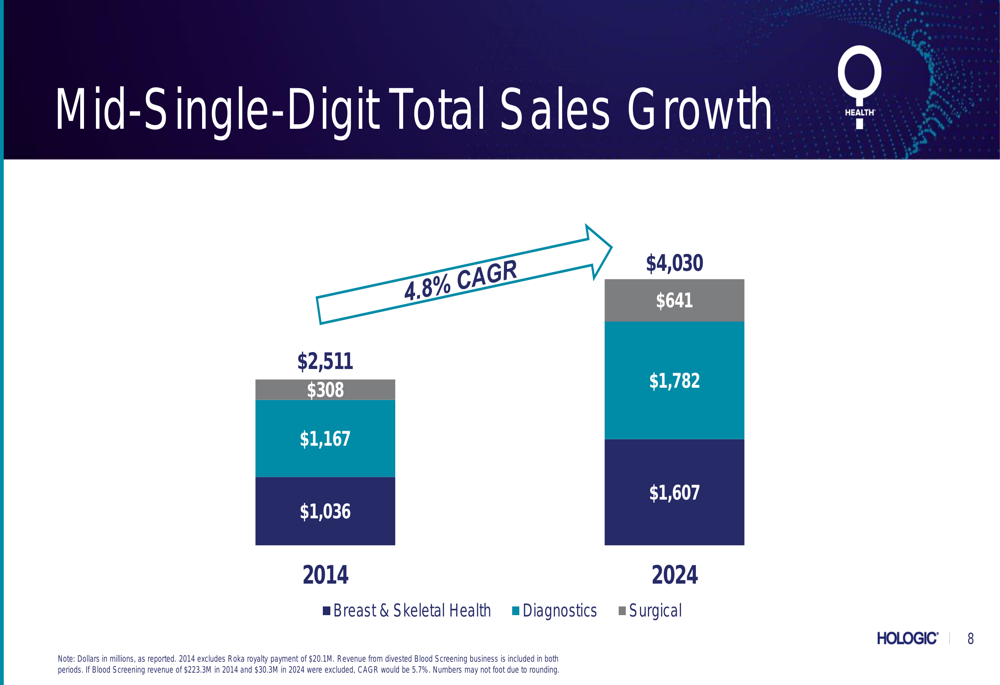
The presentation emphasized Hologic’s long-term growth strategy built around market-leading core franchises and expansion initiatives. Over the past decade, the company has achieved a 4.8% compound annual growth rate in total sales, increasing from $2.5 billion in 2014 to $4.0 billion in 2024.
As shown in the following chart of 10-year revenue growth:
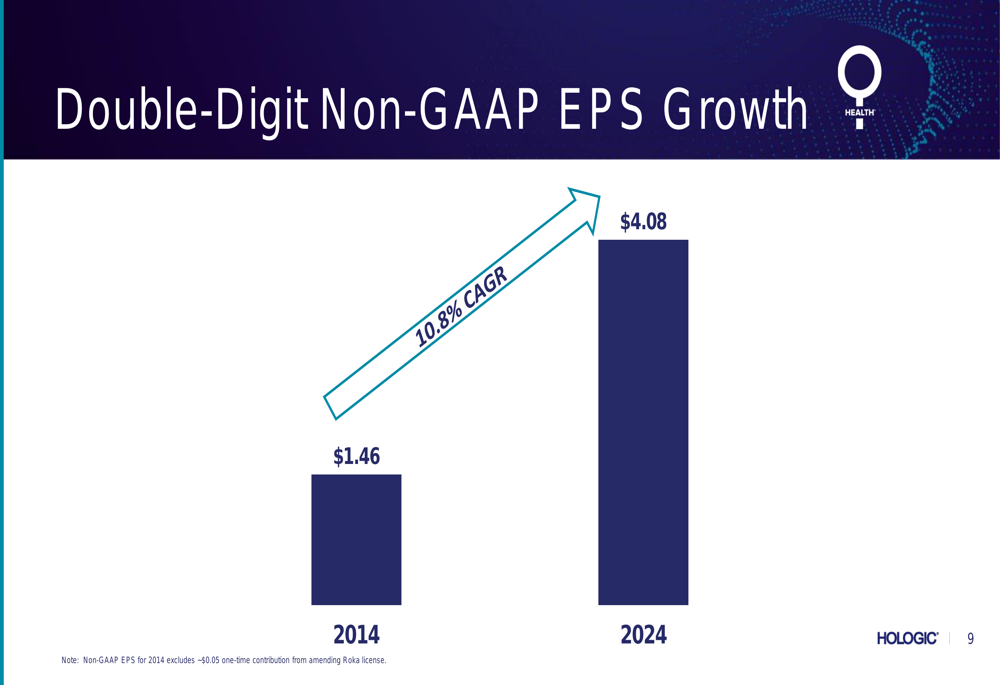
This growth has translated into even stronger earnings performance, with non-GAAP EPS growing at a 10.8% CAGR over the same period, from $1.46 in 2014 to $4.08 in 2024:
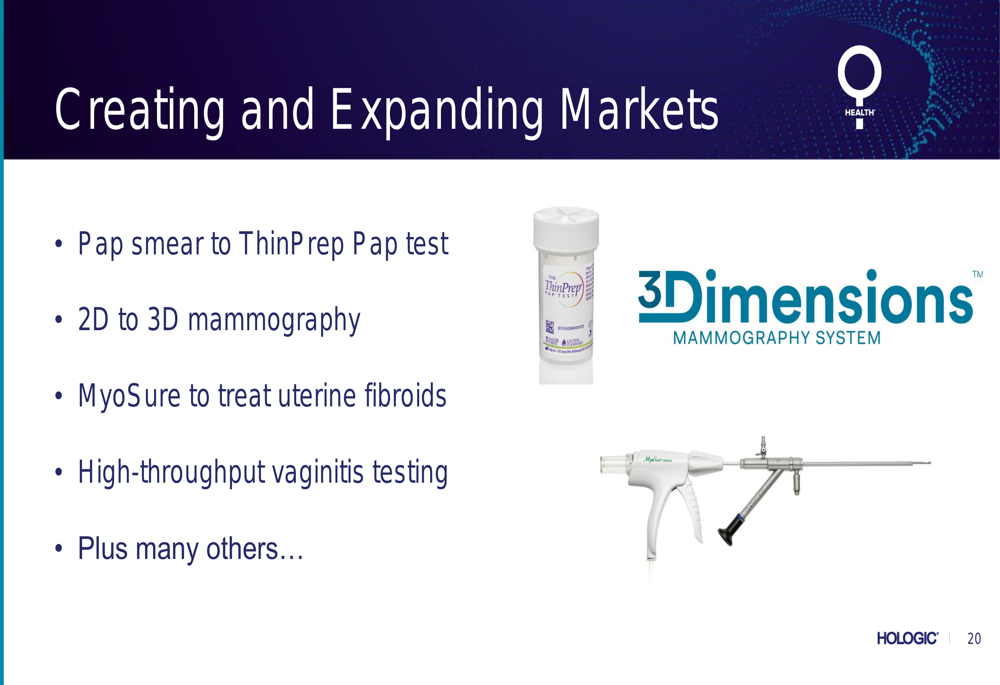
A key driver of Hologic’s long-term success has been its strategy of creating and expanding markets through innovation:
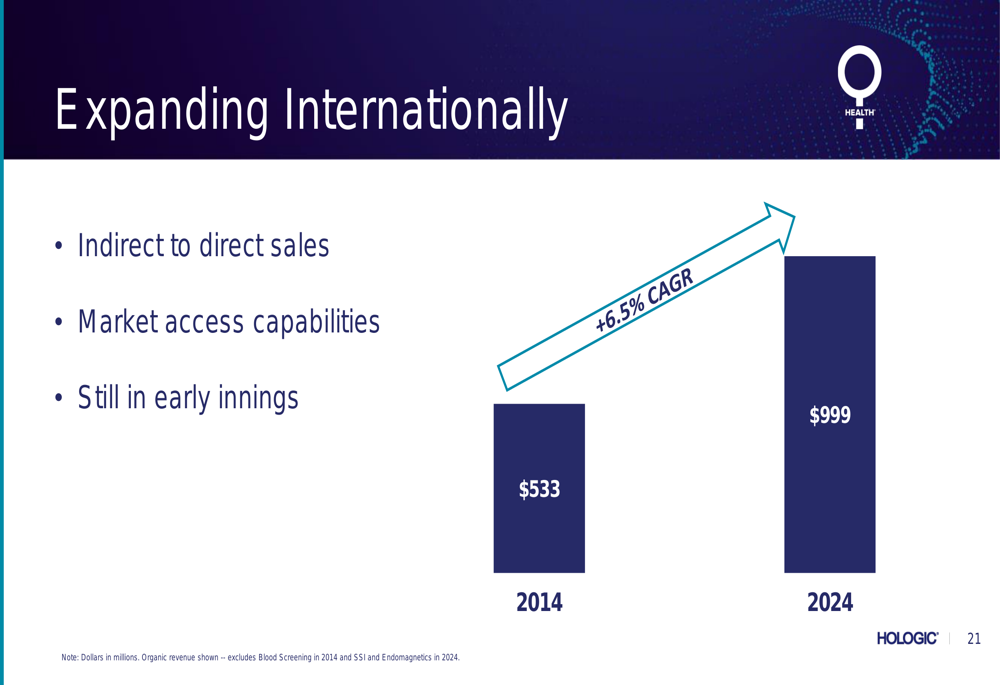
The company has also focused on international expansion, growing international revenue at a 6.5% CAGR from $533 million in 2014 to $999 million in 2024, though the earnings call transcript suggests challenges in China may be affecting recent performance.
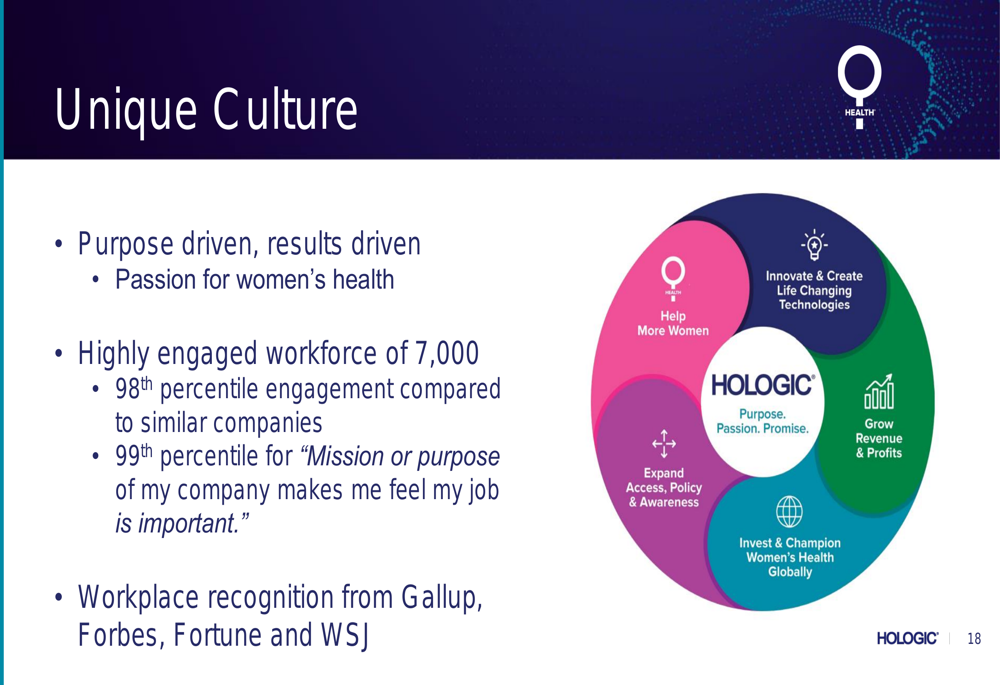
Hologic highlighted its unique corporate culture as a competitive advantage, with employee engagement in the 98th percentile compared to similar companies:
Forward-Looking Statements
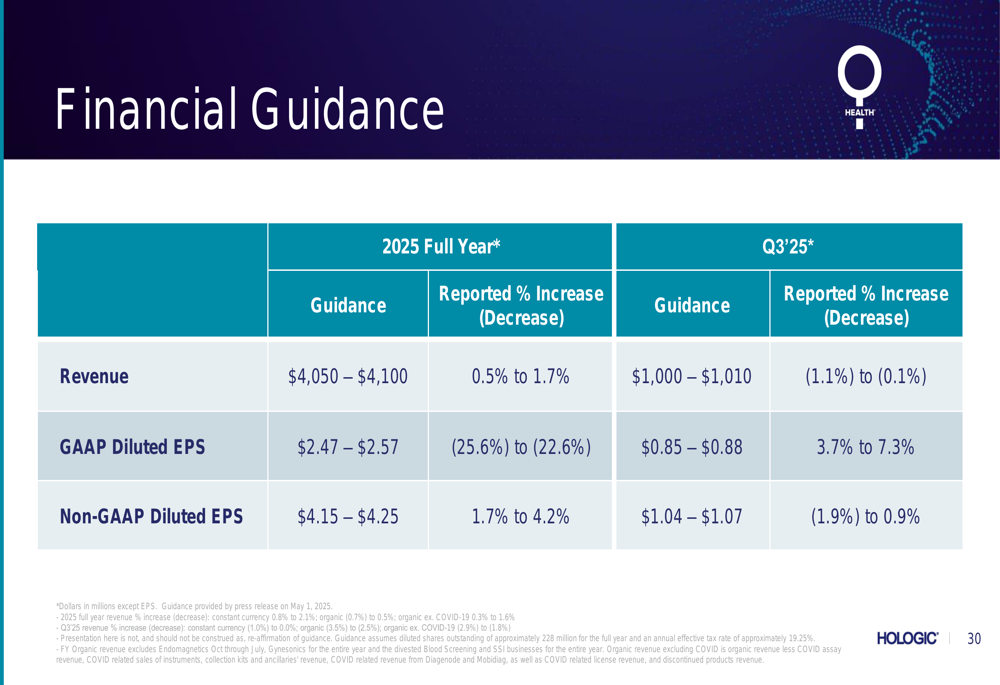
Despite the mixed Q2 results, Hologic maintained its full-year fiscal 2025 guidance, projecting revenue between $4,050 million and $4,100 million (0.5% to 1.7% increase) and non-GAAP diluted EPS of $4.15 to $4.25 (1.7% to 4.2% increase).
For Q3’25, the company expects revenue between $1,000 million and $1,010 million (a 1.1% decrease to 0.1% decrease) and non-GAAP diluted EPS between $1.04 and $1.07 (a 1.9% decrease to 0.9% increase).
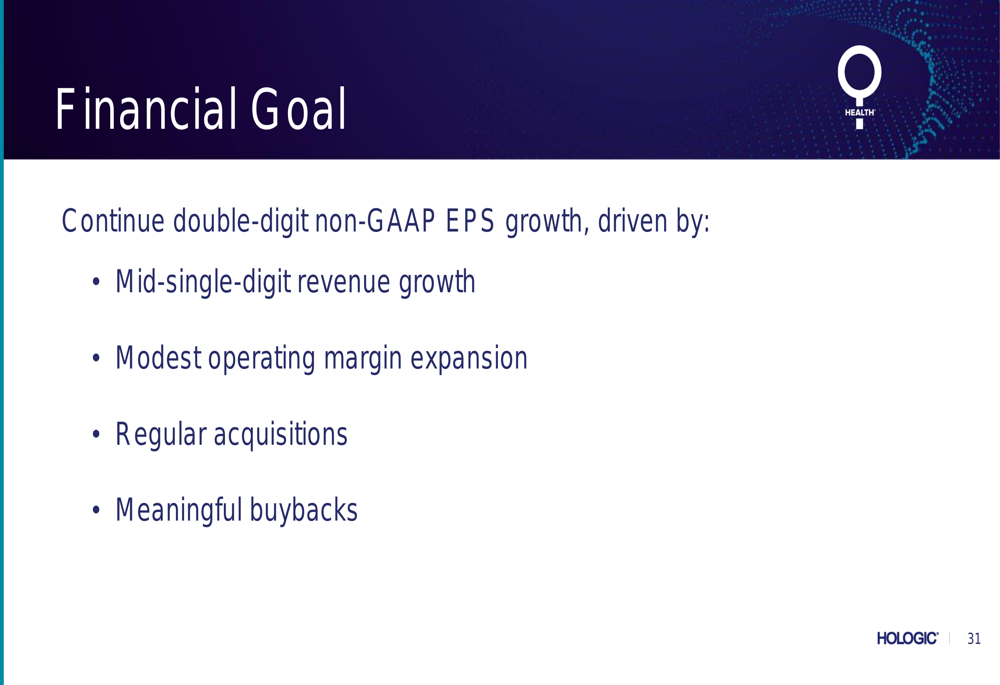
Looking beyond the current fiscal year, Hologic reaffirmed its long-term financial goal of continuing double-digit non-GAAP EPS growth, driven by mid-single-digit revenue growth, modest operating margin expansion, regular acquisitions, and share repurchases.
While the presentation maintained an optimistic outlook, the earnings call transcript revealed some challenges not prominently addressed in the slides, including reduced revenue expectations from China, extended gantry replacement cycles affecting the Breast Health segment, and disruptions in African testing infrastructure due to funding cuts.
Despite these near-term headwinds, Hologic’s presentation emphasized the company’s strong market position in women’s health diagnostics and breast imaging, supported by a robust financial foundation and long-term growth strategy.
Full presentation:
This article was generated with the support of AI and reviewed by an editor. For more information see our T&C.