China’s Xi speaks with Trump by phone, discusses Taiwan and bilateral ties

Introduction & Market Context
Hub Group Inc (NASDAQ:HUBG) presented its third quarter 2025 results on October 30, showing signs of stabilization after several quarters of sequential revenue decline. The supply chain solutions provider reported revenue of $934 million, exceeding analyst expectations of $923.77 million, while adjusted earnings per share met forecasts at $0.49.
Following the earnings announcement, Hub Group's stock rose 0.81% in aftermarket trading to $36.01, reflecting positive investor sentiment despite the company's year-over-year revenue decline of 5%. The stock remains closer to its 52-week low of $30.75 than its high of $53.21, suggesting potential room for growth as the company executes its strategic initiatives.
Quarterly Performance Highlights
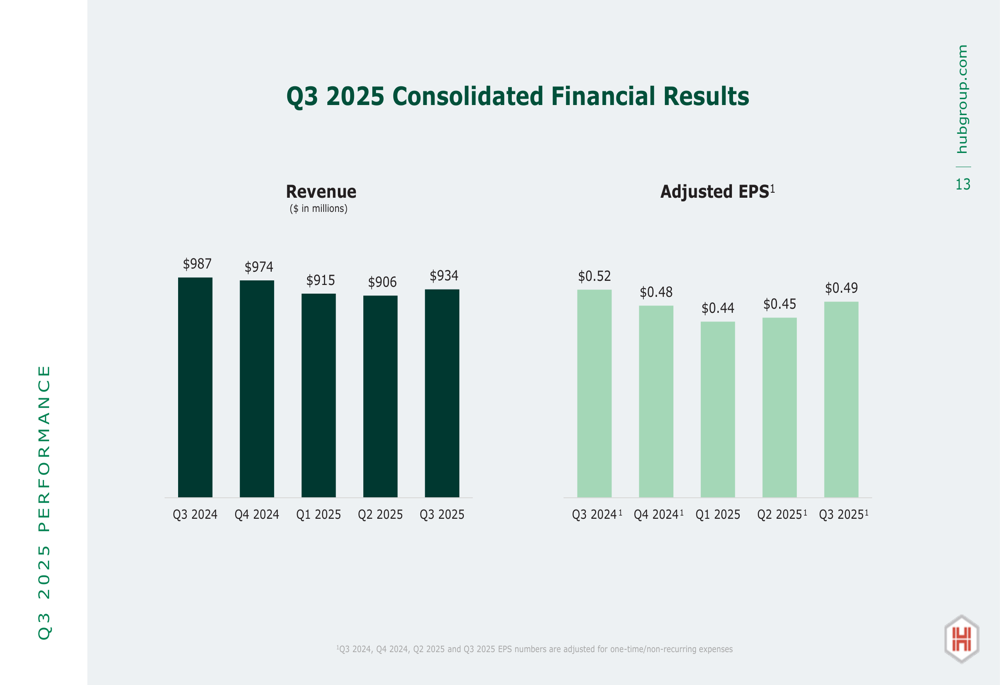
Hub Group's Q3 2025 results showed modest sequential improvement from the previous quarter, with revenue increasing from $906 million in Q2 to $934 million in Q3. Adjusted EPS also improved from $0.45 to $0.49 during the same period.
The company reported adjusted operating income of $41 million, representing 4.4% of revenue, a slight improvement in margin compared to previous quarters. This performance comes amid what the company described as "sub-seasonal demand" in the transportation sector.
As shown in the following chart of quarterly financial results, Hub Group has maintained relatively stable performance throughout 2025 despite market challenges:
Segment Analysis
Hub Group operates through two primary business segments: Intermodal & Transportation Solutions (ITS) and Logistics, which contributed 45% and 55% of the company's revenue respectively in fiscal year 2024.
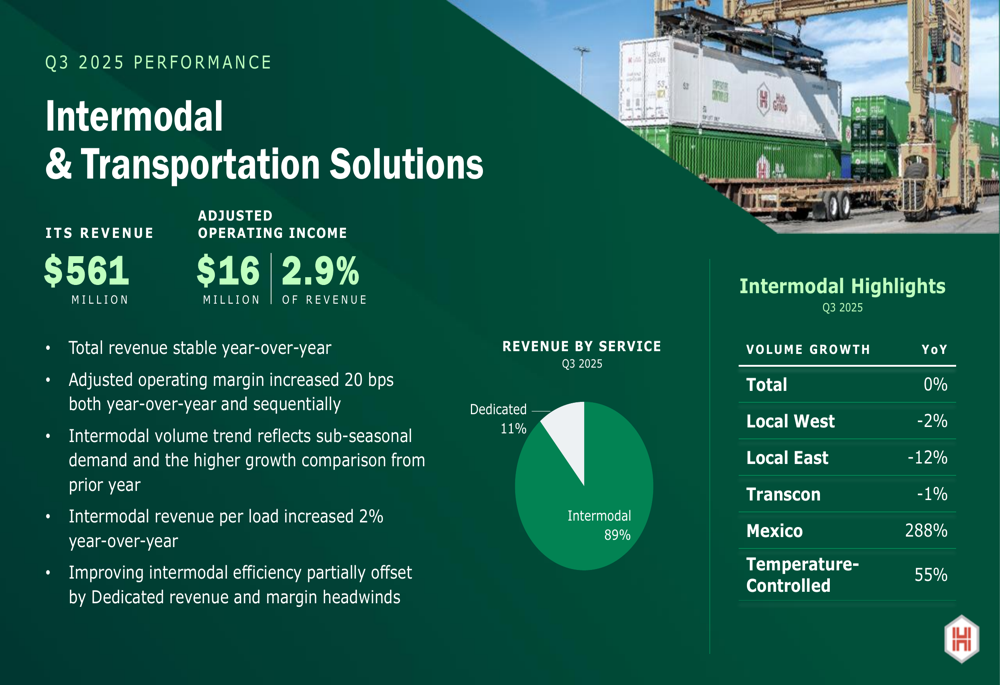
In Q3 2025, the Intermodal & Transportation Solutions segment generated revenue of $561 million with adjusted operating income of $16 million, representing a margin of 2.9%. The segment's operating margin increased 20 basis points year-over-year and sequentially. Intermodal volumes remained flat year-over-year in total, though the company saw significant growth in Mexico (288%) and Temperature Controlled (55%) services, offset by declines in Local East (-12%) and Local West (-2%).
The following breakdown illustrates the ITS segment's performance:
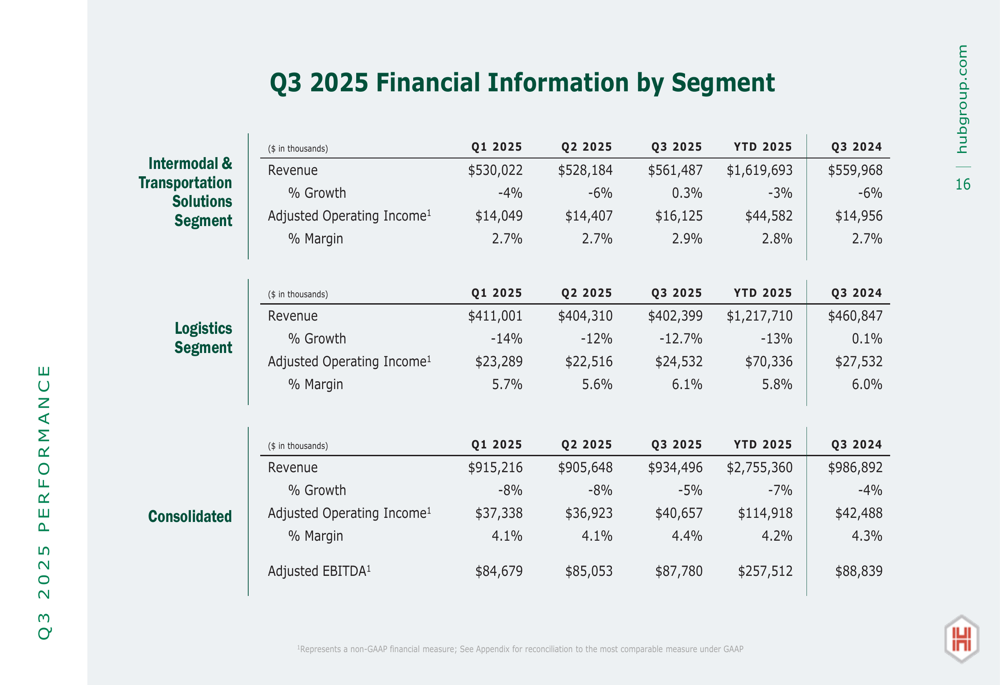
Meanwhile, the Logistics segment delivered stronger profitability with revenue of $402 million and adjusted operating income of $25 million, representing a higher margin of 6.1%. This segment benefited from $150 million of annualized revenue from Final Mile services.
The detailed financial breakdown by segment shows the relative strength of the Logistics business in terms of profitability:
Balance Sheet Strength & Capital Allocation
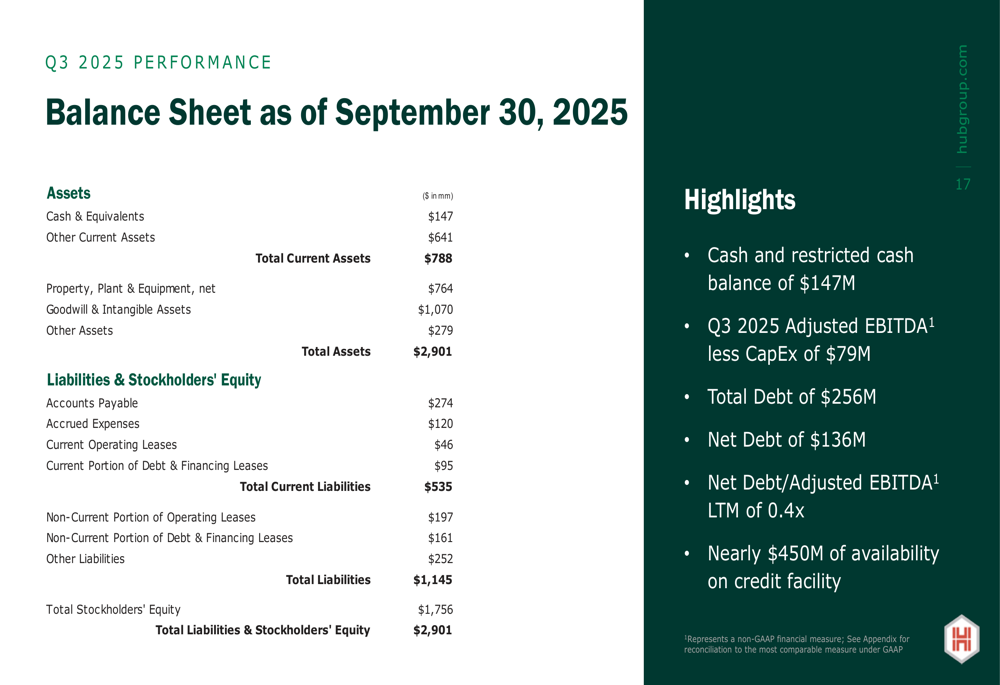
Hub Group maintains a strong financial position with $147 million in cash and equivalents as of September 30, 2025. The company's total debt stands at $256 million, resulting in net debt of $136 million and a net debt to adjusted EBITDA ratio of just 0.4x, indicating significant financial flexibility.
The company's balance sheet as of September 30, 2025, reflects total assets of $2.9 billion and total stockholders' equity of $1.76 billion:
Hub Group's capital allocation strategy focuses on three key areas: investing in its core business, pursuing strategic acquisitions, and returning capital to shareholders. The company has returned $36 million to shareholders year-to-date and recently closed on the acquisitions of Marten Transport Intermodal and SITH, LLC to expand its service offerings and scale.
Strategic Initiatives & Outlook
Hub Group has demonstrated long-term growth in key financial metrics from 2017 to 2024, including a 14% CAGR in adjusted EPS, 25% CAGR in adjusted EBITDA less CapEx, and 17% CAGR in adjusted cash EPS. The company has also improved its financial profile with higher margins and lower leverage.
The following chart illustrates the company's improved performance across business cycles:
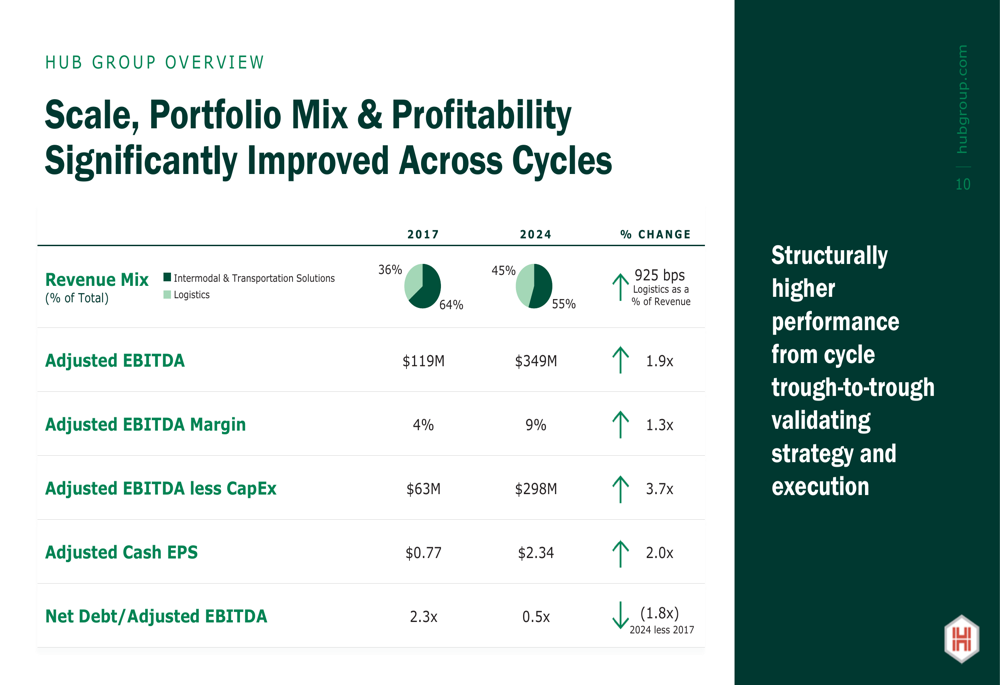
Looking ahead, Hub Group provided full-year 2025 guidance, projecting revenue of $3.6 to $3.7 billion and EPS of $1.80 to $1.90 per share. Capital expenditures are expected to remain below $50 million for the year, with a full-year tax rate of approximately 24.5%.
The company's long-term strategy focuses on high-service intermodal growth, expanding its logistics offerings, and achieving sustainable improvements in operations. Hub Group emphasizes its competitive advantages as a diversified supply chain solutions provider with a strong intermodal position, resilient performance, and significant balance sheet flexibility.
During the earnings call, CEO Phil Yeager emphasized the company's focus on "controlling what we can control in this dynamic environment," while CFO Kevin W. Beth highlighted operational efficiencies, noting potential improvements in container utilization even before anticipated rail mergers.
With its extensive North American network, diversified customer base, and focus on technology-enabled solutions, Hub Group aims to maintain its position as a leading supply chain solutions provider despite the current challenging market conditions.
Full presentation:
This article was generated with the support of AI and reviewed by an editor. For more information see our T&C.