Stock market today: Nasdaq closes above 23,000 for first time as tech rebounds

Introduction & Market Context
Interface Inc. (NASDAQ:TILE), a global leader in commercial flooring solutions, presented its Q1 2025 investor presentation on May 2, 2025, highlighting the company’s financial performance and strategic positioning. The presentation comes as Interface’s stock has experienced recent volatility, with shares trading at $18.85 at market close on May 1, 2025, followed by a 2.12% decline in aftermarket trading.
The company operates in a $39 billion global commercial flooring market, with Interface’s directly served market valued at over $9 billion. As return-to-office mandates continue to drive office space refreshes, particularly in premium Class A spaces, Interface is leveraging its position as a design and sustainability leader to capture market share.
Quarterly Performance Highlights
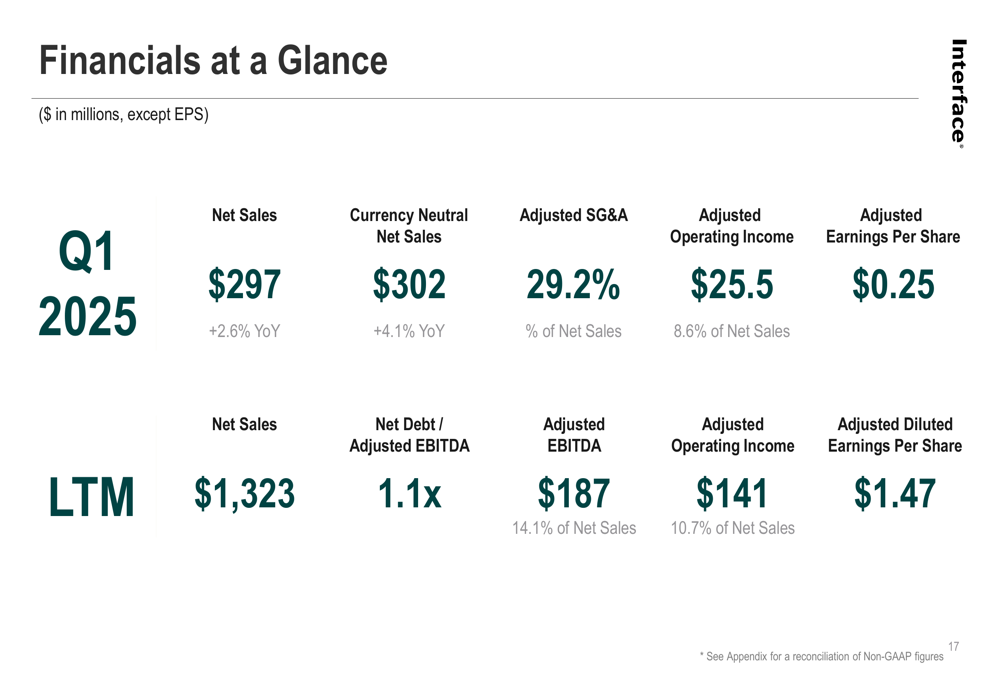
Interface reported Q1 2025 net sales of $297 million, representing a 2.6% year-over-year increase. On a currency neutral basis, net sales grew by 4.1% to $302 million. The company achieved adjusted operating income of $25.5 million (8.6% of net sales) and adjusted earnings per share of $0.25 for the quarter.
As shown in the following financial overview:
These results build upon Interface’s Q4 2024 performance, where the company reported earnings per share of $0.34, exceeding analyst expectations of $0.29, despite revenue of $335 million falling short of the projected $341.56 million.
For the last twelve months ending Q1 2025, Interface generated net sales of $1,323 million, with adjusted EBITDA of $187 million (14.1% of net sales) and adjusted operating income of $141 million (10.7% of net sales). The company’s adjusted diluted earnings per share for this period reached $1.47.
Strategic Initiatives
Interface’s "ONE Interface" strategy focuses on four key pillars: building strong global functions to support local sales teams, accelerating growth through enhanced commercial team productivity, expanding margins through global supply chain management, and leading in design, performance, and sustainability.
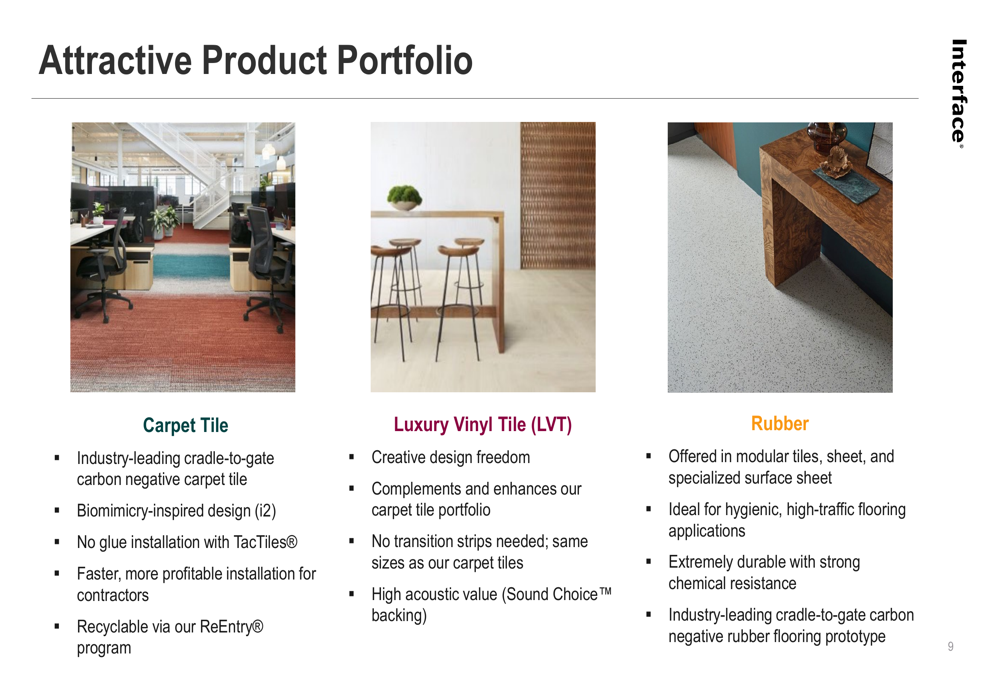
The company’s product portfolio spans three main categories: carpet tile, luxury vinyl tile (LVT), and rubber flooring. Interface is particularly proud of its sustainability achievements, offering the industry’s first cradle-to-gate carbon negative carpet tile and rubber flooring prototype.
As illustrated in the company’s product portfolio:
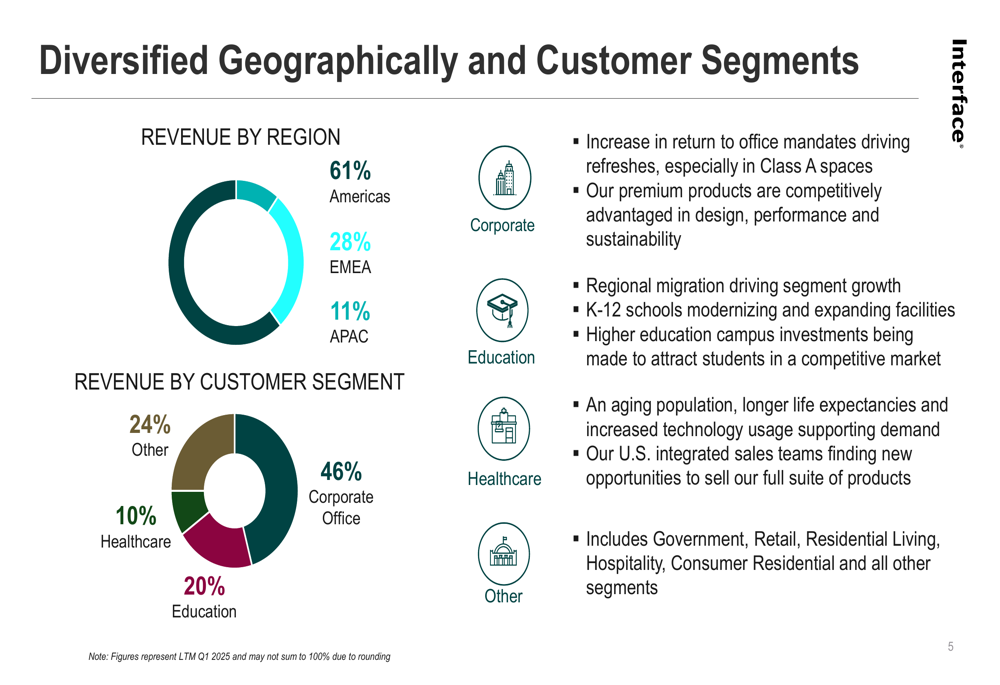
Interface’s geographic and customer segment diversification provides stability and multiple growth avenues. The Americas represent 61% of net sales, followed by EMEA (28%) and APAC (11%). By customer segment, corporate office leads with 46% of sales, followed by education (20%), healthcare (10%), and other segments (24%).
This diversification is visualized in the following breakdown:
Competitive Industry Position
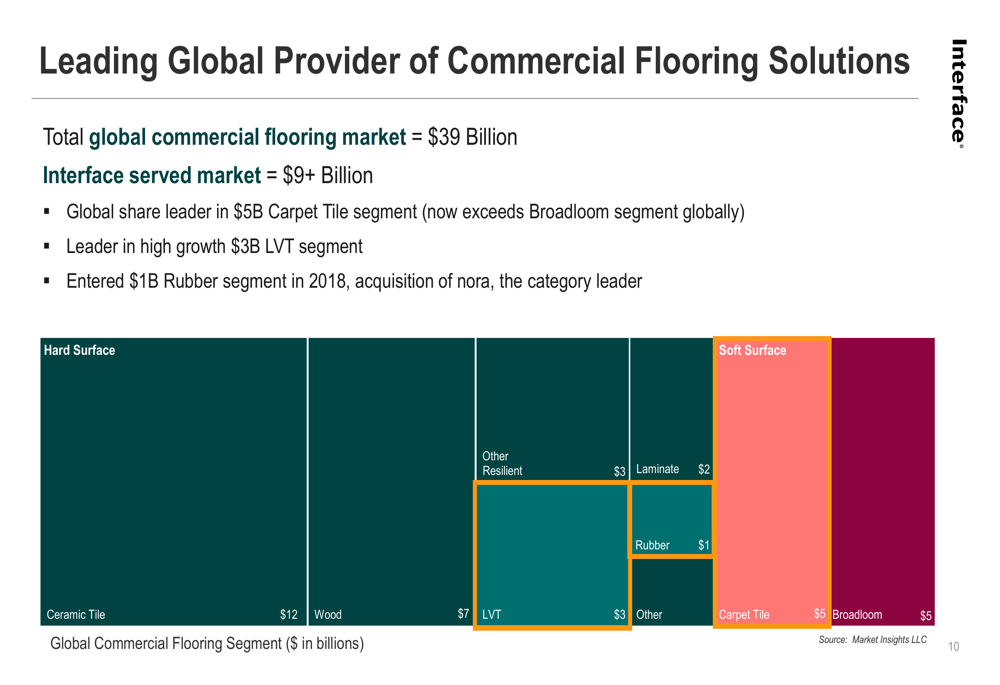
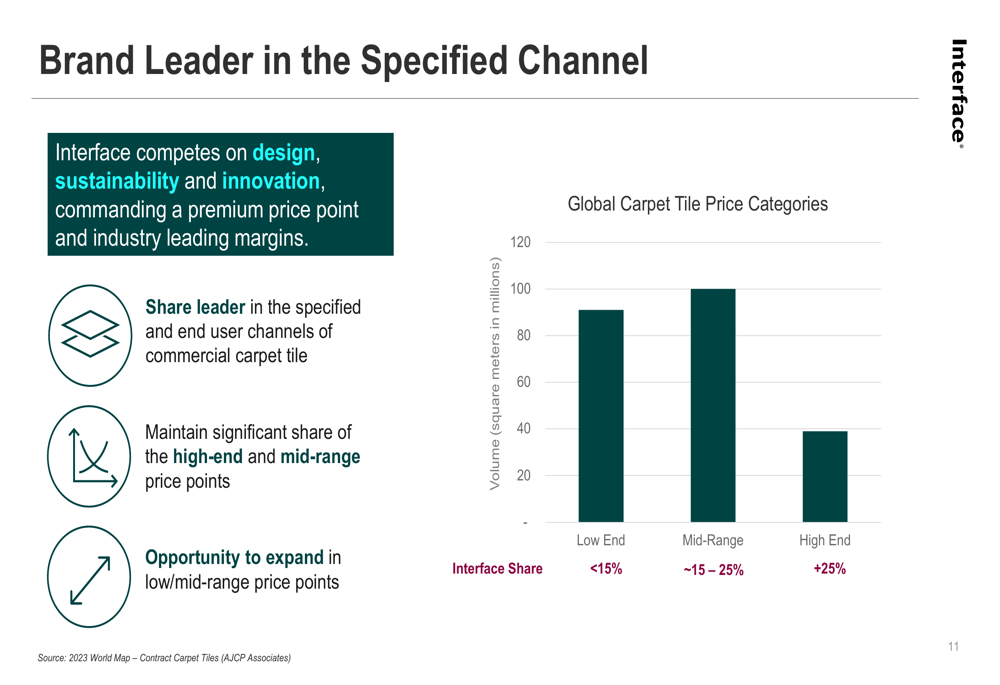
Interface maintains a leadership position in the commercial flooring market, particularly in the carpet tile segment where it is the global share leader in a $5 billion market. The company is also a leader in the high-growth $3 billion LVT segment and entered the $1 billion rubber segment in 2018 through its nora acquisition.
The company’s market positioning is illustrated in this overview:
Interface competes primarily on design, sustainability, and innovation, commanding premium price points and industry-leading margins. The company has significant market share in high-end (>25%) and mid-range (15-25%) price points, with opportunities to expand in the low/mid-range segments where its current share is below 15%.
As shown in the following market share analysis:
Financial Analysis
Interface has demonstrated consistent improvement in its financial position, particularly in debt reduction. The company’s net debt decreased from $474 million in FY20 to $205 million in Q1 2025, while its net debt to adjusted EBITDA ratio improved from 3.2x to 1.1x during the same period.
This financial strengthening is visualized in the following chart:
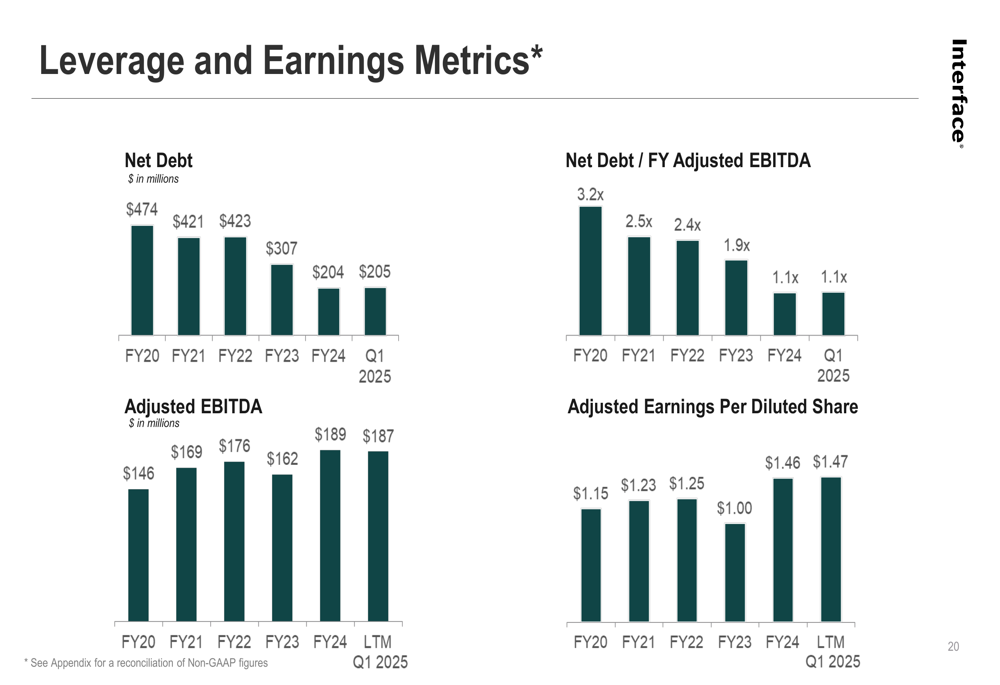
The company’s adjusted earnings per diluted share has also shown positive momentum, growing from $1.15 in FY20 to $1.47 for the last twelve months ending Q1 2025, despite some fluctuations in between.
Interface’s capital allocation priorities focus on investing in the business, managing leverage, exploring M&A opportunities, and returning excess cash to shareholders. This disciplined approach has helped the company maintain financial stability while pursuing growth initiatives.
Forward-Looking Statements
Based on the Q4 2024 earnings report, Interface projects net sales between $1,315 million and $1,365 million for 2025. The company expects to continue implementing its "ONE Interface" strategy with a focus on margin expansion.
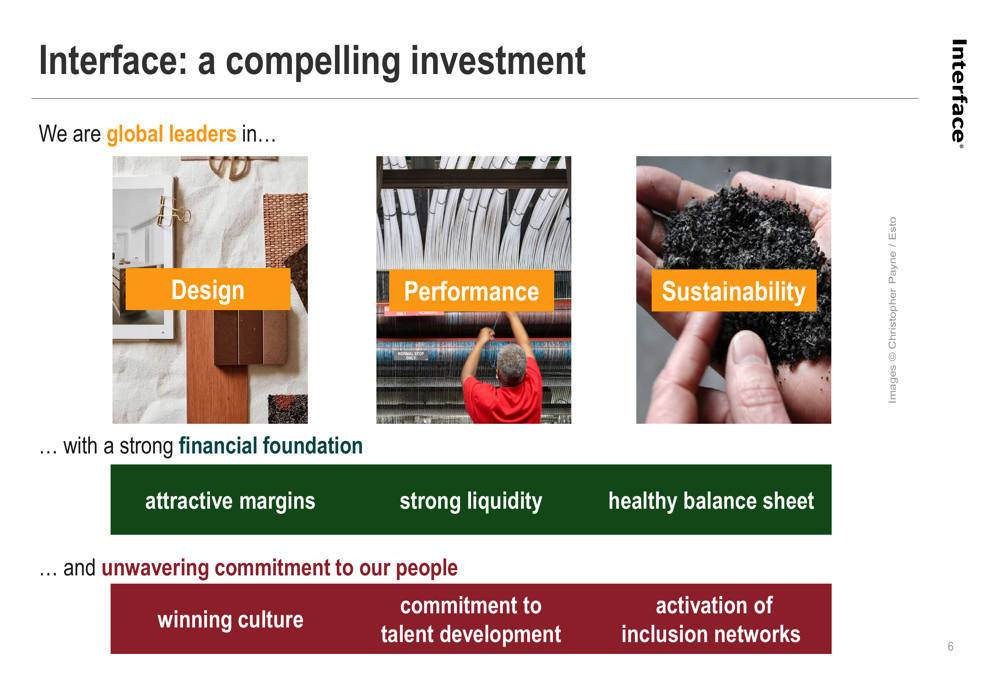
Interface positions itself as a compelling investment based on three key pillars: global leadership in design, performance, and sustainability; a strong financial foundation with attractive margins and healthy balance sheet; and an unwavering commitment to its people through a winning culture and talent development.
As illustrated in the company’s investment thesis:
The company’s ESG initiatives remain central to its strategy, with 2024 highlights including a 4% reduction in greenhouse gas emissions, decreased carbon footprint across all product categories, and the collection of over 9 million pounds of post-consumer carpet. Interface has been certified as a Great Place to Work® in nine countries and has expanded its employee learning and development programs.
While Interface faces challenges including supply chain disruptions, market saturation, and macroeconomic pressures, its diversified business model and strong balance sheet position the company to navigate these headwinds while pursuing its long-term growth strategy.
Full presentation:
This article was generated with the support of AI and reviewed by an editor. For more information see our T&C.