Gold soars to record high over $3,900/oz amid yen slump, US rate cut bets

Interface Inc (NASDAQ:TILE) delivered strong second-quarter results according to its August 2025 investor presentation, with significant year-over-year improvements in revenue, profitability, and balance sheet metrics. The commercial flooring leader’s stock jumped 11.49% in premarket trading following the release, reflecting investor enthusiasm for the company’s performance.
Quarterly Performance Highlights
Interface reported Q2 2025 net sales of $375.5 million, representing an 8.3% increase compared to the same period last year. This performance exceeded the company’s previously issued guidance of $355-365 million for the quarter. More impressively, adjusted earnings per share reached $0.60, a 50% improvement year-over-year.
The company demonstrated substantial margin expansion, with adjusted gross profit margin increasing by 402 basis points to 39.8% and adjusted operating income margin growing by 346 basis points to 14.9% of net sales. Adjusted EBITDA margin also improved significantly to 17.3%, up 270 basis points from Q2 2024.
As shown in the following financial overview:
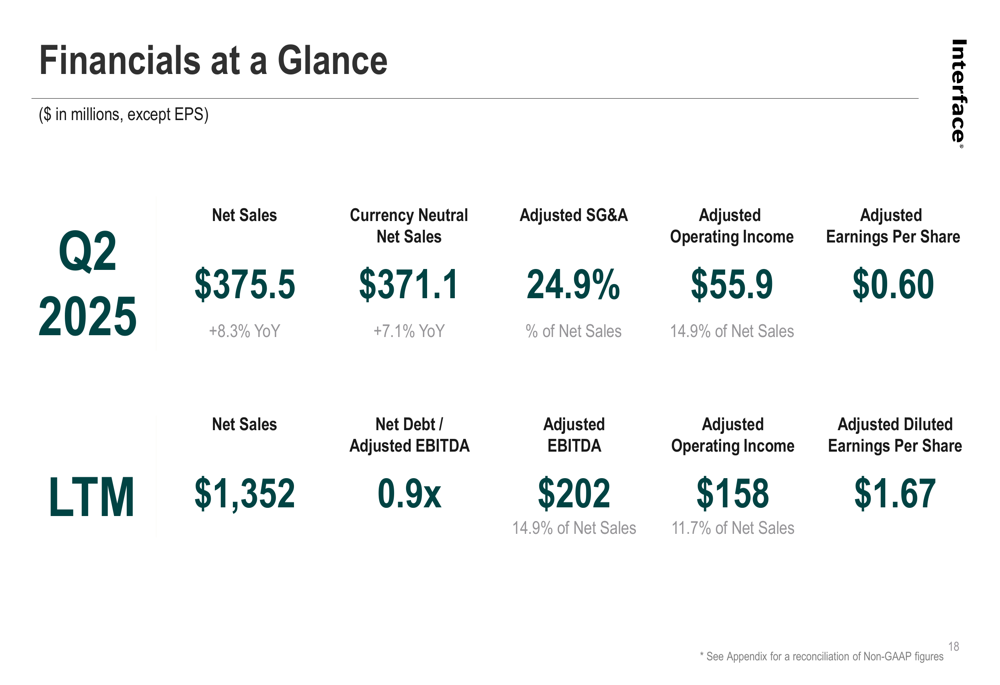
This strong quarterly performance contributes to impressive last twelve months (LTM) results, with net sales of $1.352 billion and adjusted EBITDA of $202 million, representing a 14.9% margin. The company’s adjusted operating income for the LTM period reached $158 million, or 11.7% of net sales.
Financial Strength and Debt Reduction
Interface has made remarkable progress in strengthening its balance sheet over recent years. The company’s net debt has declined from $474 million in FY2020 to just $183 million in Q2 2025, while its leverage ratio (net debt to adjusted EBITDA) has improved from 3.2x to 0.9x during the same period.
This financial transformation is clearly illustrated in the following chart:
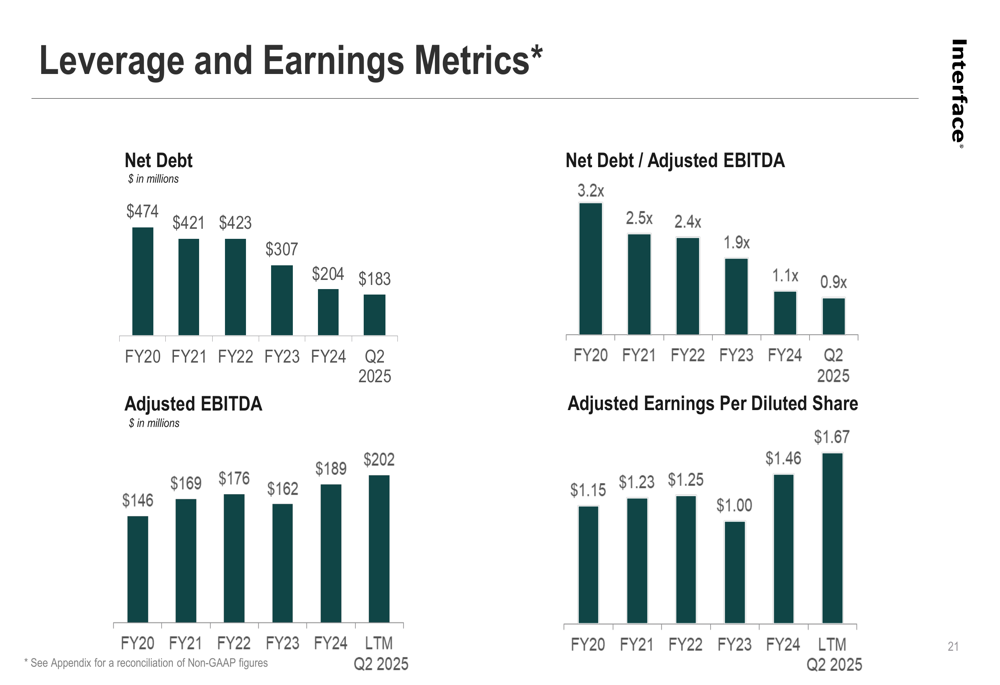
The company’s adjusted earnings per share have also shown consistent improvement, growing from $1.15 in FY2020 to $1.67 for the LTM period ending Q2 2025. This represents a 45% increase over five years, demonstrating Interface’s ability to generate increasing shareholder value while simultaneously reducing debt.
Strategic Positioning and Market Leadership
Interface maintains its position as a global leader in commercial flooring, with $1.3 billion in net sales in FY2024 and 3,600 employees worldwide. The company operates six manufacturing facilities across four continents, allowing it to efficiently serve markets globally while maintaining a focus on local needs.
The company’s revenue is well-diversified both geographically and by customer segment:
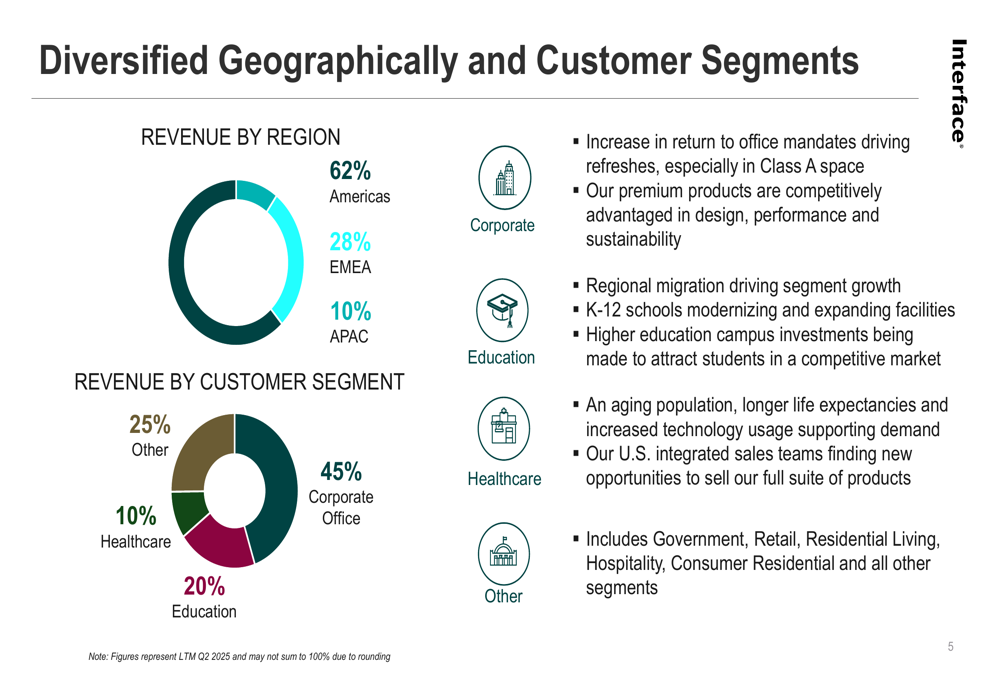
With 62% of revenue coming from the Americas, 28% from EMEA, and 10% from Asia-Pacific, Interface has established a strong global presence. From a customer segment perspective, corporate office remains the largest at 45% of revenue, followed by education (20%), healthcare (10%), and other segments (25%).
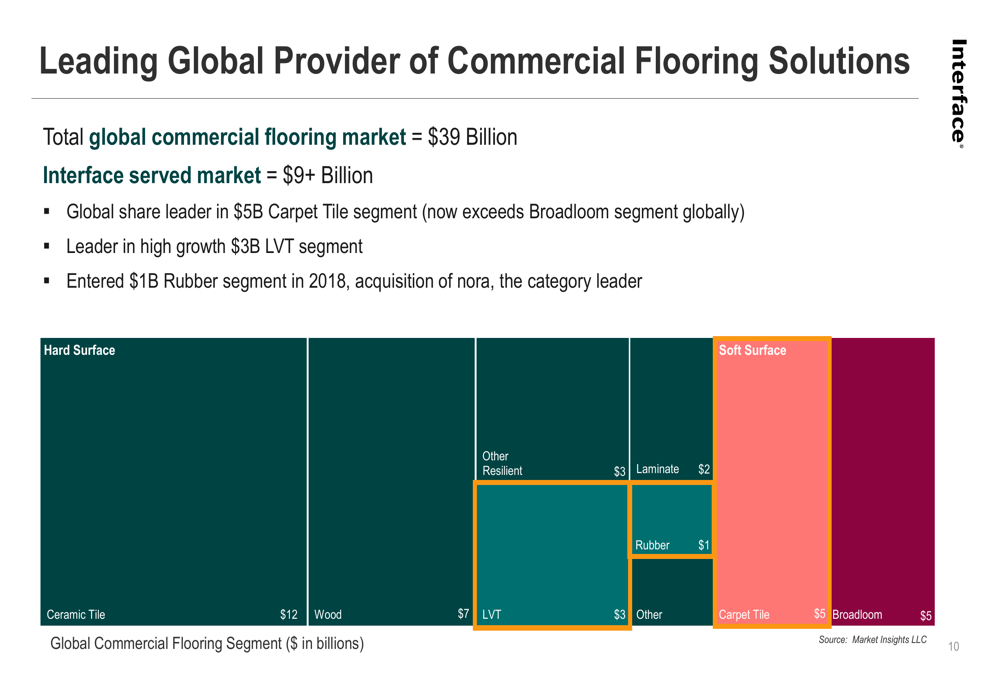
Interface competes in a $39 billion global commercial flooring market, with its served market estimated at over $9 billion. The company is particularly strong in the carpet tile segment, where it maintains global leadership, and has established positions in the growing luxury vinyl tile (LVT) and rubber flooring segments.
Product Portfolio and Innovation
Interface’s product portfolio spans three main categories: carpet tile, luxury vinyl tile (LVT), and rubber flooring. The company emphasizes design, performance, and sustainability across all product lines, which helps maintain premium pricing and attractive margins.
The company’s product offerings include:
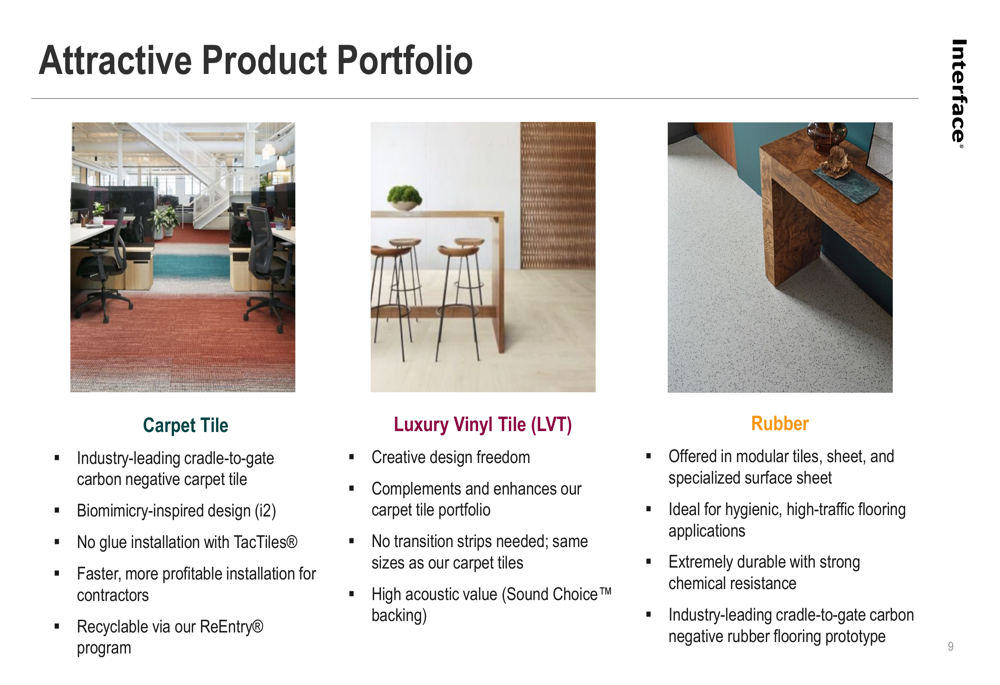
A key competitive advantage for Interface is its leadership in sustainability within the flooring industry. The company has developed the industry’s first cradle-to-gate carbon negative carpet tile and rubber flooring prototype, positioning it favorably as customers increasingly prioritize environmental considerations in purchasing decisions.
ESG Initiatives and Sustainability Progress
Interface continues to make significant progress on its environmental, social, and governance (ESG) initiatives. The company has set ambitious targets, including becoming "all in" on carbon negative by 2040, and has already achieved notable results in reducing its environmental footprint.
Key sustainability metrics for 2024 include:
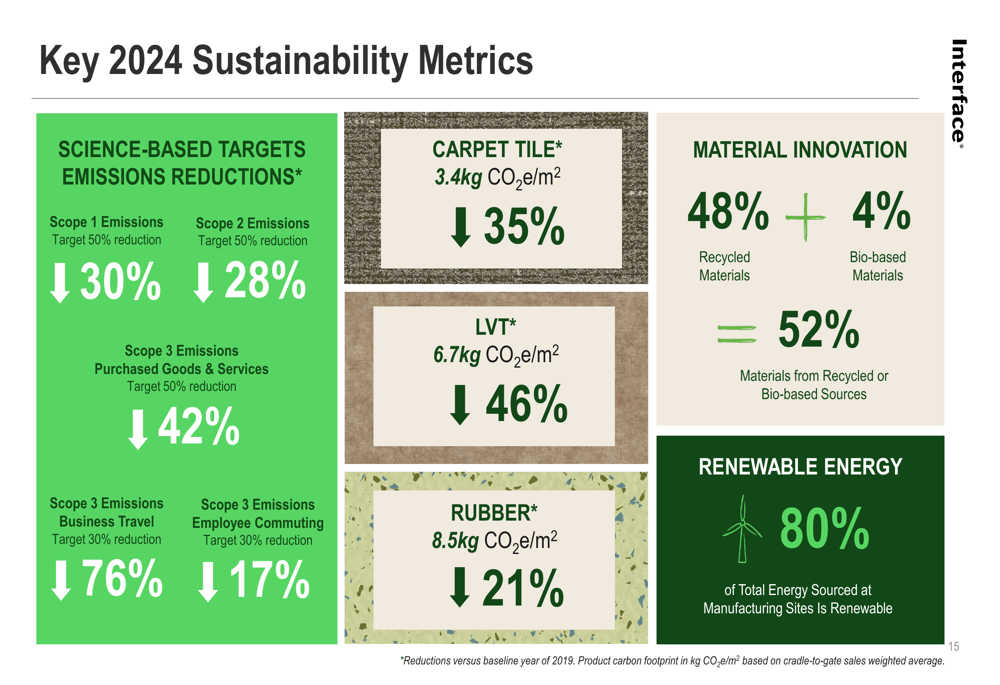
The company has reduced greenhouse gas emissions by 4% and decreased the carbon footprint across all product categories. Currently, 80% of total energy sourced at manufacturing sites is renewable, and 52% of materials used come from recycled or bio-based sources.
Outlook and Strategic Direction
Interface’s "One Interface" strategy focuses on building strong global functions to support local sales teams, accelerating growth through enhanced productivity, expanding margins through global supply chain management and complexity reduction, and maintaining leadership in design, performance, and sustainability.
The company’s capital allocation priorities include reinvesting in the business, managing leverage, exploring M&A opportunities, and returning excess cash to shareholders. With its significantly improved balance sheet, Interface now has greater flexibility to pursue these strategic initiatives.
Looking ahead, Interface appears well-positioned to continue its growth trajectory, supported by increasing return-to-office mandates driving corporate office refreshes, regional migration driving segment growth, K-12 schools modernizing facilities, and demographic trends supporting healthcare demand.
The market’s strongly positive reaction to Interface’s Q2 2025 results suggests investors are recognizing the company’s improved financial performance and strategic positioning. With continued execution of its strategy, Interface aims to deliver sustained value for shareholders while maintaining its leadership in sustainable commercial flooring solutions.
Full presentation:
This article was generated with the support of AI and reviewed by an editor. For more information see our T&C.