TPI Composites files for Chapter 11 bankruptcy, plans delisting from Nasdaq

Executive Summary
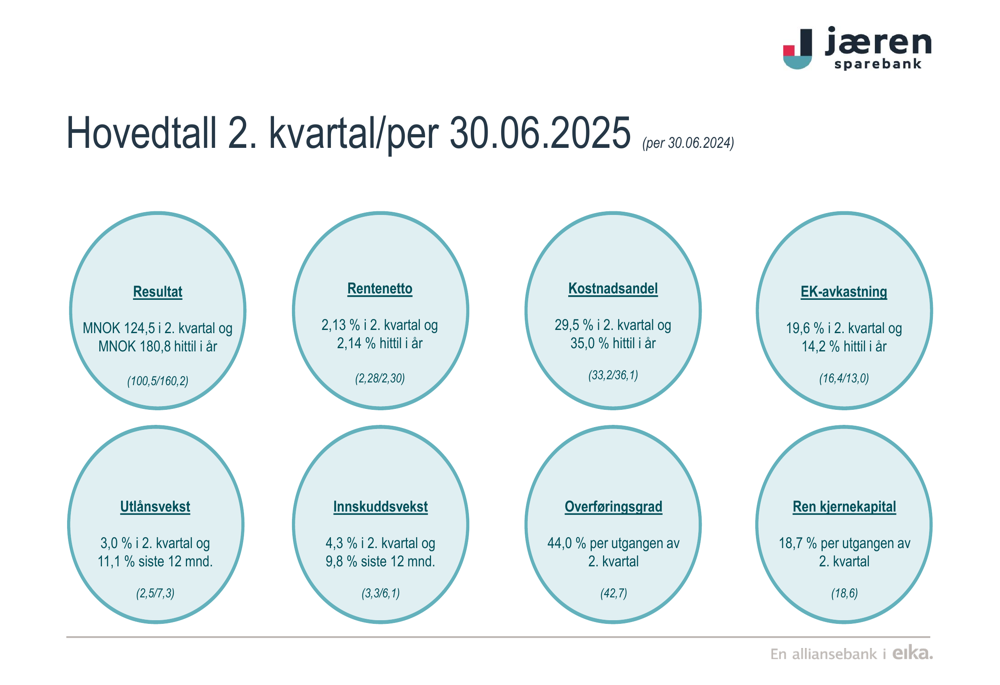
Jæren Sparebank (OB:JAREN) reported strong second-quarter 2025 results, with profit after tax jumping 24% year-over-year to NOK 124.5 million, according to the bank’s quarterly presentation released on August 14, 2025. The Norwegian regional bank, which operates primarily in the Jæren region, demonstrated solid growth with loans increasing 11.1% over the past 12 months while maintaining a robust capital position.
Return on equity surged to 19.6% in Q2 2025, compared to 16.4% in the same period last year, while the cost-to-income ratio improved significantly to 29.5% from 33.2% a year earlier. The bank continues to strengthen its market leadership position in home loans within its primary market area, which includes the municipalities of Klepp, Time, Hå, and Gjesdal.
As shown in the following key financial highlights from the presentation, Jæren Sparebank has outperformed its strategic targets across multiple metrics:
Quarterly Performance Highlights
Jæren Sparebank’s profit before tax for Q2 2025 increased by 19% to NOK 125.3 million compared to NOK 105.3 million in Q2 2024. The year-to-date profit reached NOK 180.8 million, up from NOK 160.2 million in the same period last year. This performance was driven by stable net interest income, normalized commission income, and improved operational efficiency.
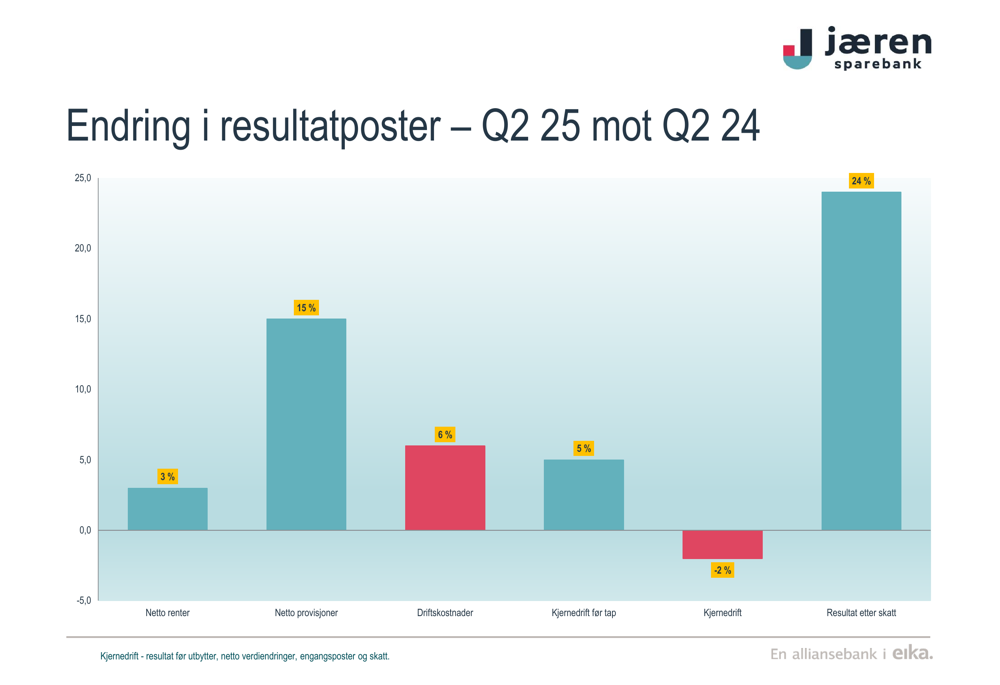
The bank’s net interest income remained relatively stable with a slight increase of 3% compared to Q2 2024, while net commission income grew by 15%. Despite a 6% increase in operating costs, the bank’s core operations before impairments improved by 5% year-over-year.
The following chart illustrates the changes in key income statement items compared to Q2 2024:
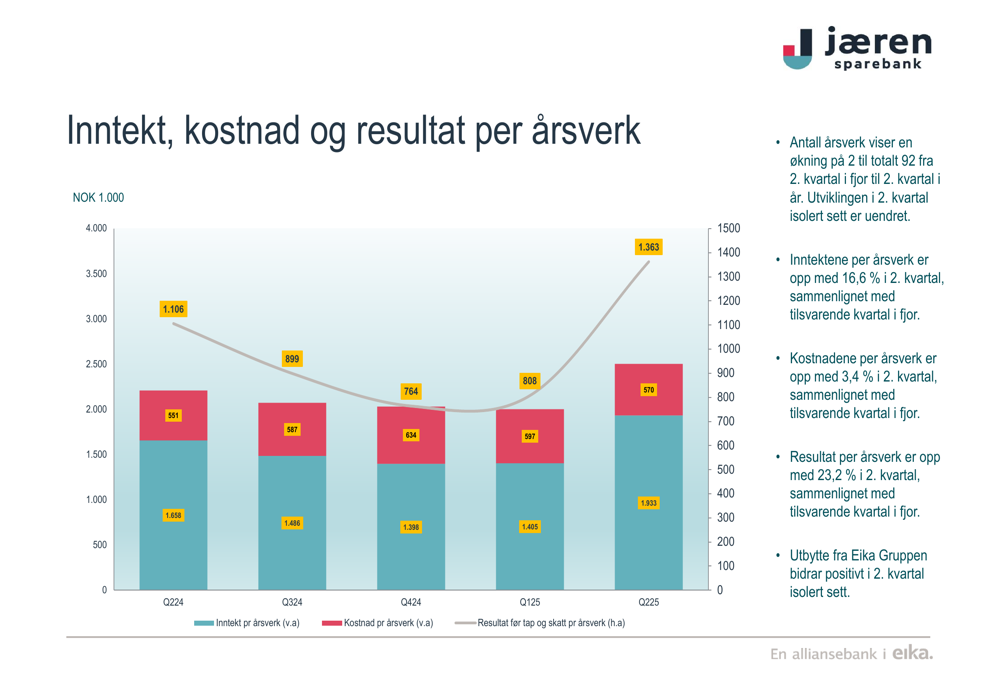
The bank’s productivity metrics also showed improvement, with income per full-time employee increasing by 16.6% in Q2, while costs per employee rose by only 3.4%. This operational leverage resulted in a 23.2% increase in profit per employee, as shown in the presentation:
Market Position
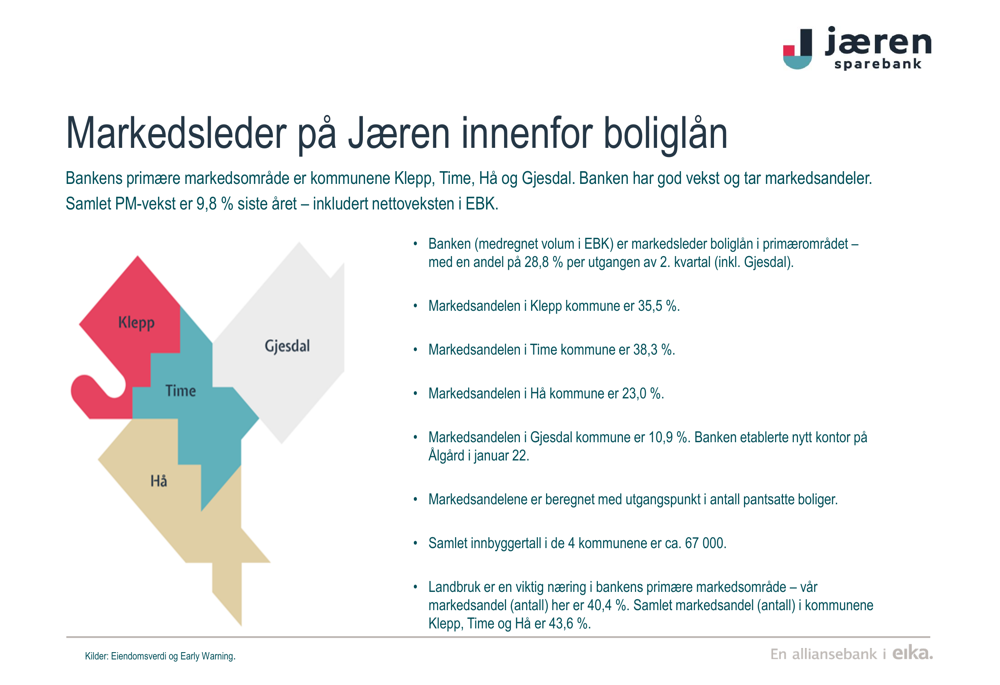
Jæren Sparebank continues to strengthen its position as the market leader in home loans within its primary market area. The bank reported a 28.8% market share in home loans across its core municipalities, with particularly strong positions in Klepp (35.5%) and Time (38.3%). In the agricultural sector, which is vital to the region, the bank maintains a dominant 40.4% market share.
The bank’s growth in the personal market segment reached 9.8% over the past year, significantly outpacing the general credit growth of 3.7% in its primary market area. This growth has been supported by strategic initiatives including a new office opened in Ålgård in January 2022, a dedicated sales team, and increased marketing efforts.
The following image from the presentation illustrates the bank’s market leadership position:
Capital and Funding
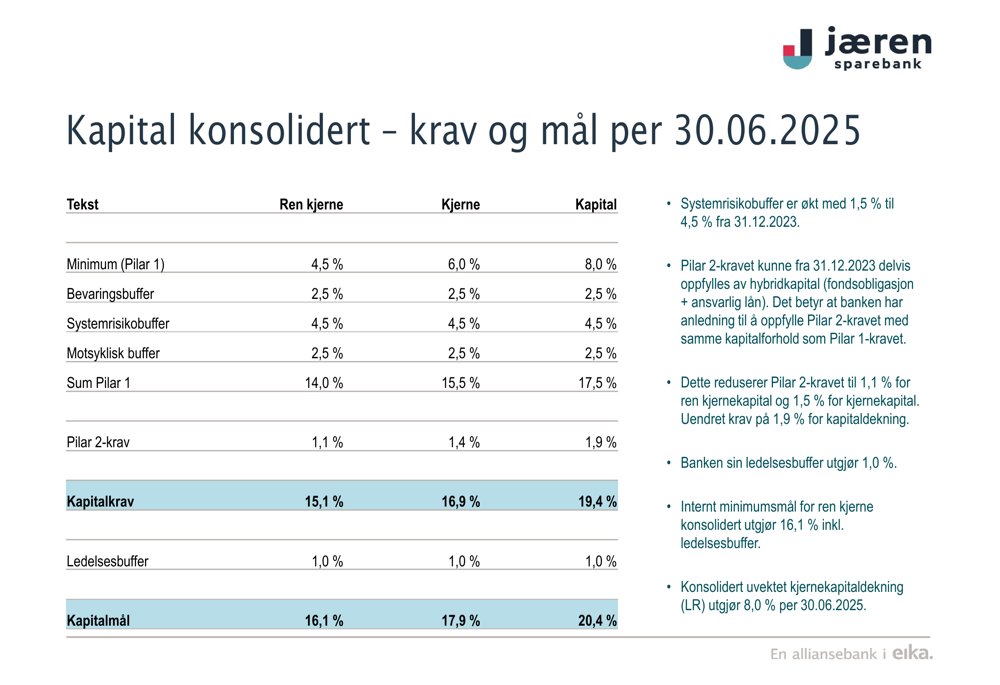
Jæren Sparebank maintains a strong capital position with a Common Equity Tier 1 (CET1) ratio of 18.7% at the end of Q2 2025, well above both regulatory requirements and the bank’s internal minimum target of 16.1%. The bank’s leverage ratio stands at a solid 8.0%.
The bank’s funding profile remains diversified and stable. Deposits grew by 9.8% over the past 12 months, with the deposit-to-loan ratio improving to 82.0% at the end of Q2 2025, exceeding the bank’s target of 70%. Personal customer deposits, which typically represent more stable funding, account for 70.8% of total deposits.
Eika Boligkreditt (EBK) continues to be an important funding source for the bank, with transferred loan volume reaching NOK 7.9 billion at the end of Q2 2025. The transfer rate to EBK increased to 44.0%, up from 42.7% a year earlier.
As shown in the following capital adequacy chart, the bank maintains a significant buffer above regulatory requirements:
Asset Quality and Risk Management
Jæren Sparebank continues to demonstrate strong asset quality with problem loans (non-performing and doubtful loans) at a very low level of 0.45% of gross loans. This figure remains significantly below industry averages, reflecting the bank’s prudent risk management practices and the relatively stable economic conditions in its primary market area.
Loan loss provisions in stages 1 and 2 (performing loans) amount to 0.15% of gross loans and 0.39% of corporate loans. The bank has maintained stable impairment levels, with stage 3 provisions (non-performing loans) increasing by only NOK 0.1 million from Q1 to Q2 2025.
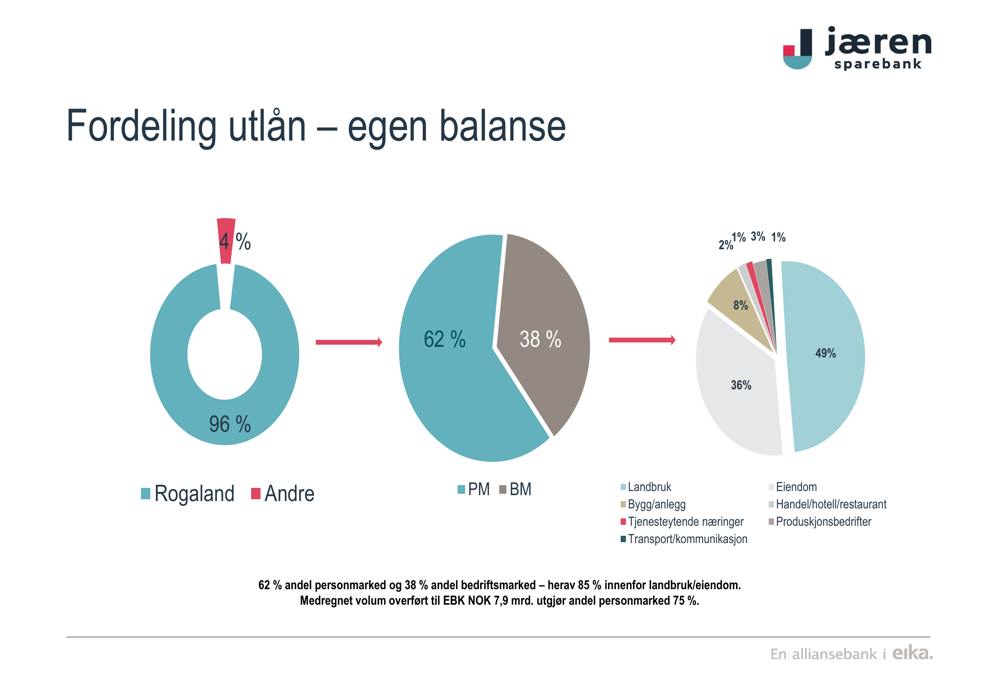
The distribution of the loan portfolio remains well-balanced, with 62% allocated to personal customers and 38% to corporate customers. When including loans transferred to Eika Boligkreditt, the personal customer segment represents 75% of total lending. Within the corporate segment, agricultural loans account for 49.4% of corporate lending, reflecting the bank’s strong position in this sector.
The following chart illustrates the bank’s loan portfolio distribution:
Strategic Outlook
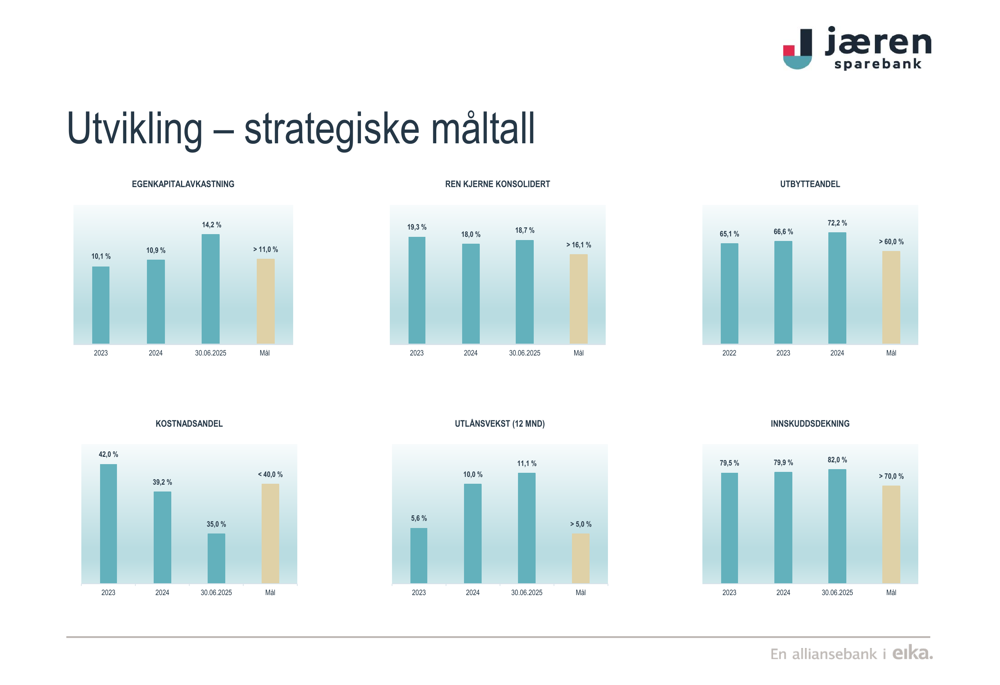
Jæren Sparebank continues to perform strongly against its strategic targets, with all key metrics exceeding goals as of Q2 2025. Return on equity of 19.3% significantly surpasses the target of >11.0%, while the cost-to-income ratio of 35.0% is well below the <40.0% target. Loan growth of 10.0% exceeds the >5.0% target, and the deposit-to-loan ratio of 82.0% comfortably exceeds the >70.0% target.
The bank expects relatively stable interest rate levels in the near term, with the Norwegian central bank potentially lowering rates in the second half of the year according to the latest interest rate projections. This could impact margins, but the bank’s diversified income streams and operational efficiency improvements position it well to navigate changing interest rate environments.
As illustrated in the strategic targets chart below, Jæren Sparebank is exceeding all of its key performance indicators:
Jæren Sparebank’s stock (OB:JAREN) was trading at NOK 369 as of August 13, 2025, representing a price-to-book ratio of 1.36 and a price-to-earnings ratio of 9.5 based on Q2 2025 results. The stock has traded between NOK 293.05 and NOK 380 over the past 52 weeks.
Full presentation:
This article was generated with the support of AI and reviewed by an editor. For more information see our T&C.