Street Calls of the Week

Introduction & Market Context
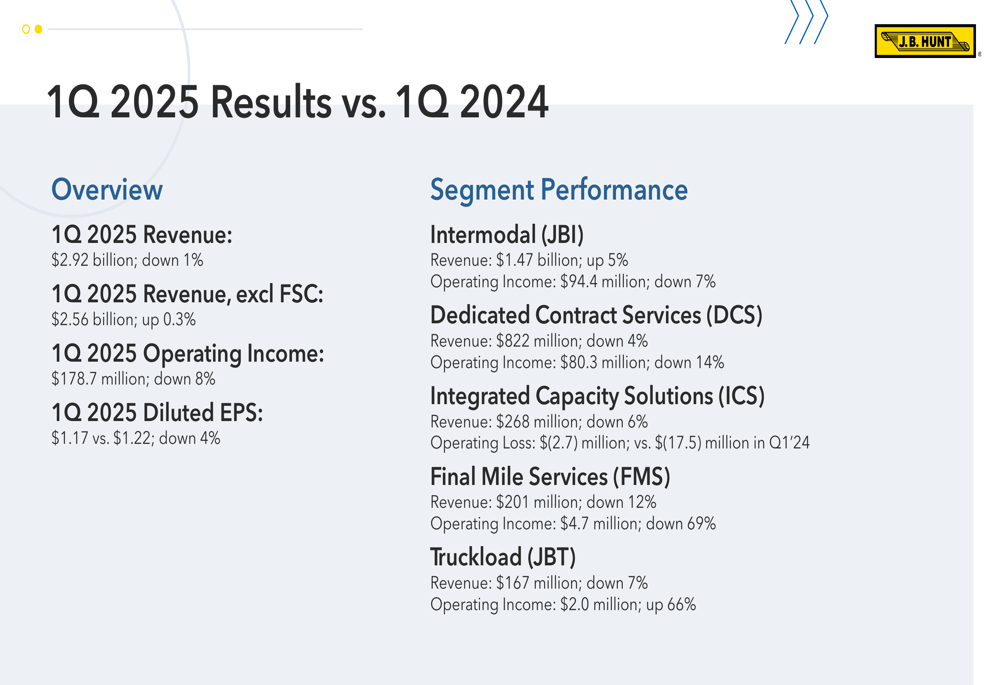
J.B. Hunt Transport Services Inc. (NASDAQ:JBHT) reported mixed first-quarter 2025 results on July 15, with revenue slightly declining year-over-year despite volume growth in its largest segment. The transportation and logistics company’s stock reacted negatively to the results, dropping 2.19% during regular trading to $152.20, though it recovered slightly in aftermarket trading, gaining 0.51% to $152.98.
The company’s quarterly performance reflects the challenging market environment that has persisted in the transportation sector, with inflationary pressures weighing on margins despite some volume improvements. J.B. Hunt’s results come amid what CEO Shelly Simpson described as an unprecedented three-year recessionary environment in the transportation industry.
Quarterly Performance Highlights
J.B. Hunt reported Q1 2025 revenue of $2.92 billion, down 1% compared to the same period in 2024, while revenue excluding fuel surcharges increased marginally by 0.3% to $2.56 billion. Operating income declined 8% to $178.7 million, and diluted earnings per share fell 4% to $1.17 from $1.22 in the prior-year period.
As shown in the following comprehensive overview of the company’s quarterly results compared to the previous year:
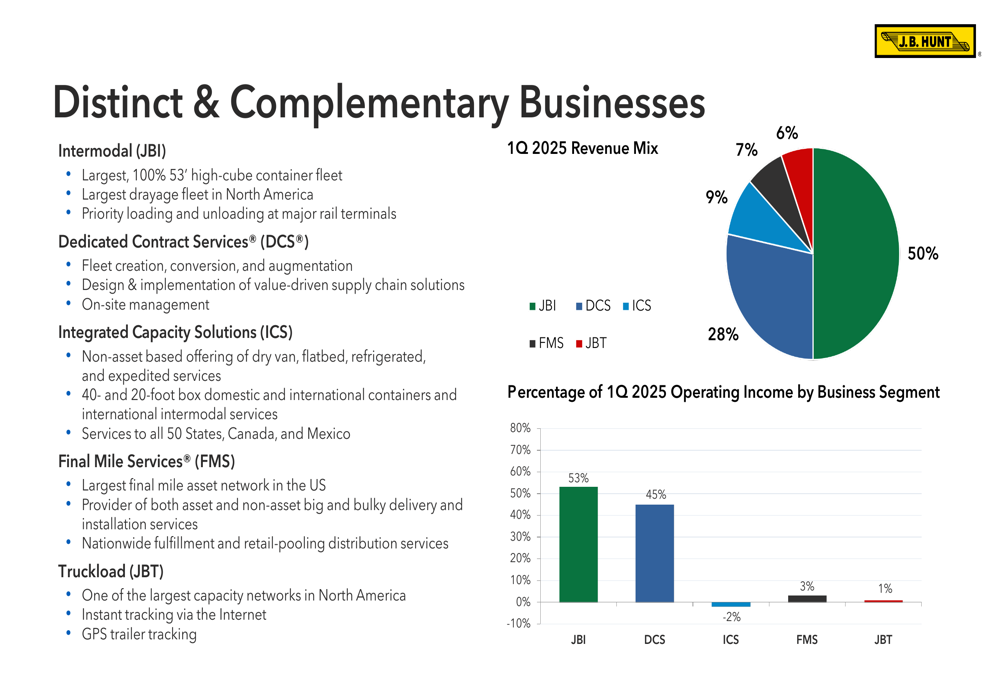
The company’s business portfolio consists of five distinct segments, with Intermodal (JBI) representing half of the company’s revenue and 53% of operating income. Dedicated Contract Services (DCS) accounts for 28% of revenue and 45% of operating income, highlighting the importance of these two segments to J.B. Hunt’s overall performance.
The following chart illustrates the company’s revenue mix and operating income contribution by segment:
Segment Analysis
Intermodal (JBI)
The Intermodal segment, J.B. Hunt’s largest business unit, delivered 5% revenue growth to $1.47 billion, driven by an 8% increase in load volume. This growth was partially offset by a 2% decrease in revenue per load, with revenue per load excluding fuel surcharges down 1%. Despite the volume growth, operating income declined 7% year-over-year, indicating margin pressure in this key segment.
The following chart shows the historical revenue trend for the Intermodal segment:
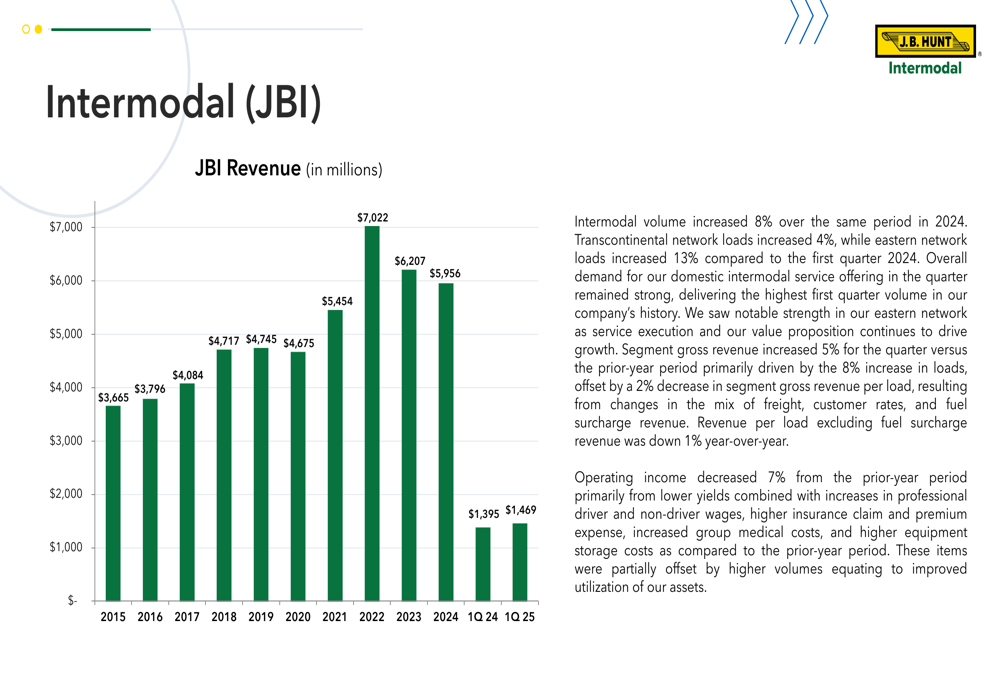
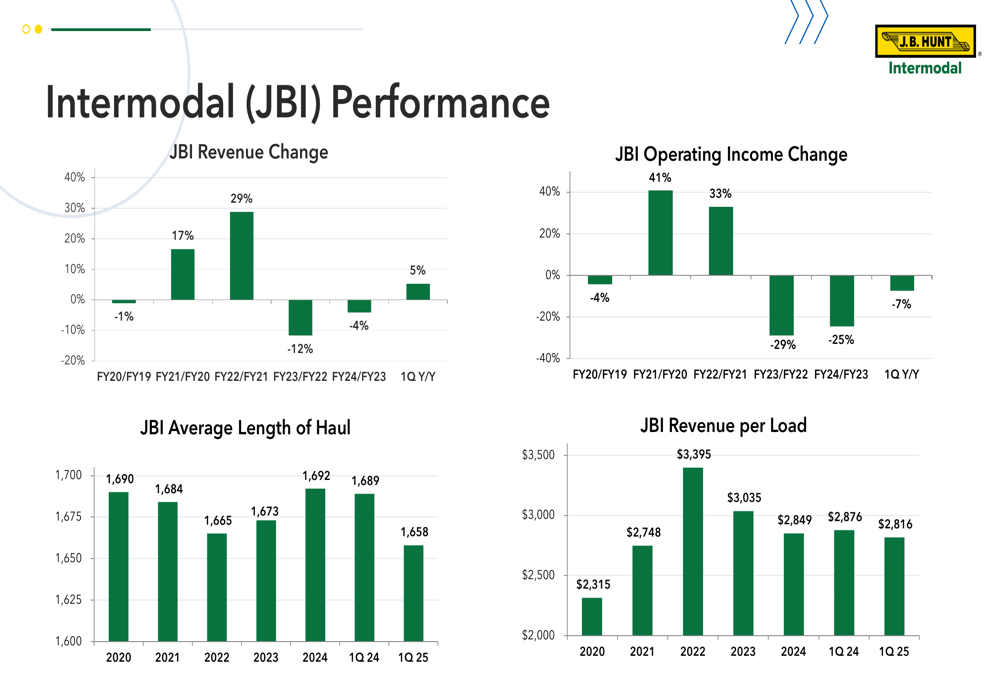
A deeper analysis of Intermodal performance metrics reveals that transcontinental network loads increased 4%, while eastern network loads grew more significantly at 13%. The average length of haul decreased slightly from 1,689 miles in Q1 2024 to 1,658 miles in Q1 2025, which may have contributed to the lower revenue per load.
The following charts provide additional insight into Intermodal performance trends:
Dedicated Contract Services (DCS)
The Dedicated Contract Services segment experienced a 4% revenue decline to $822 million in Q1 2025, primarily due to a 5% reduction in average truck count. This was partially offset by a 2% increase in productivity. Operating income decreased more substantially, falling 14% compared to the same period in 2024.
The following chart illustrates the DCS revenue trend:
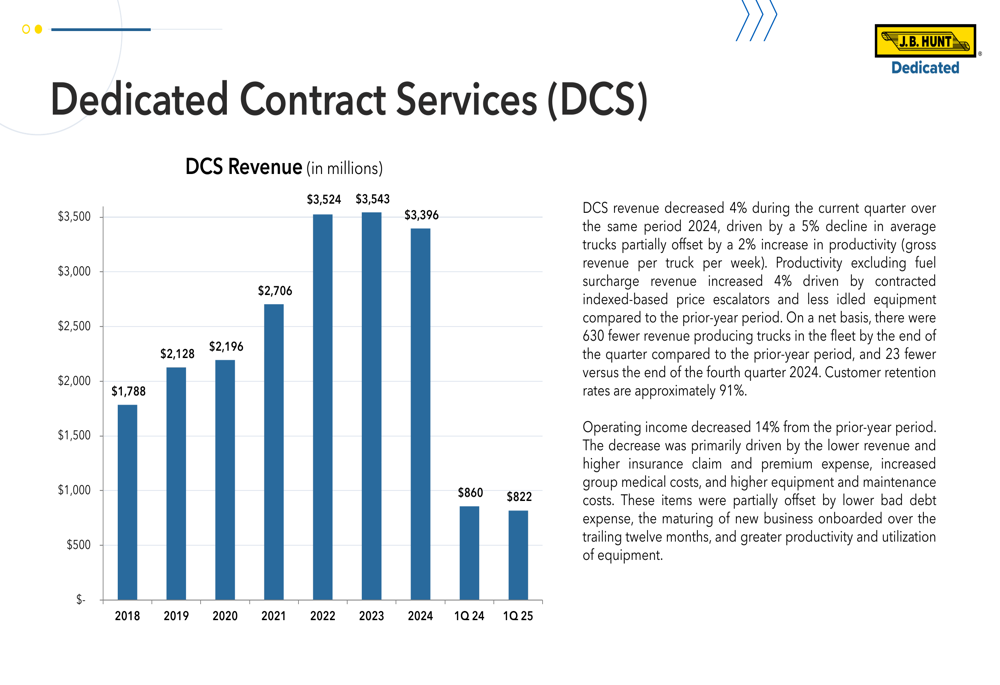
Despite the revenue and operating income declines, DCS saw improvement in revenue per truck per week, which increased from $5,021 in Q1 2024 to $5,127 in Q1 2025. However, total loads decreased from 1,004,337 to 942,894, reflecting the reduced truck count.
Integrated Capacity Solutions (ICS)
The Integrated Capacity Solutions segment, which provides freight brokerage services, reported a 6% revenue decline to $268 million in Q1 2025. Overall segment volume decreased 13% compared to the prior year. However, the segment significantly reduced its operating loss to $2.7 million, a substantial improvement from the $55.9 million loss in Q1 2024.
The following chart shows the ICS revenue trend:
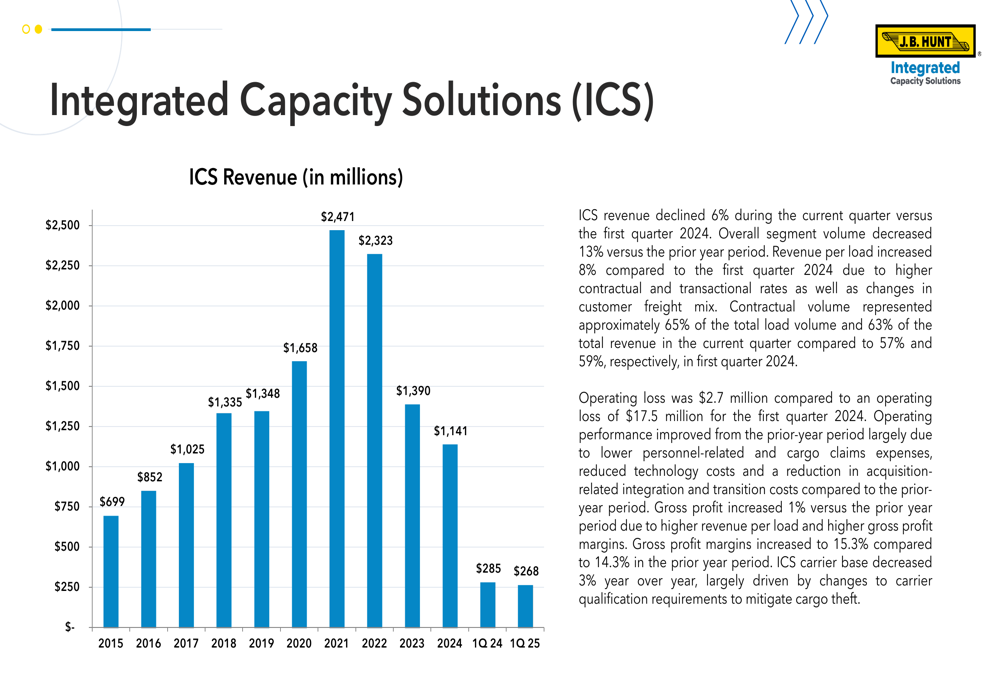
The improved profitability in ICS can be attributed to better gross profit margin, which increased from 14.3% in Q1 2024 to 15.3% in Q1 2025. This improvement suggests more effective pricing and cost management within the segment despite lower volumes.
Final Mile Services (FMS)
The Final Mile Services segment, which handles home delivery and installation services, experienced the largest revenue decline among all segments, falling 12% to $201 million in Q1 2025. More concerning was the 69% drop in operating income to $4.7 million compared to $15.1 million in the prior-year period.
The following chart illustrates the FMS revenue trend:
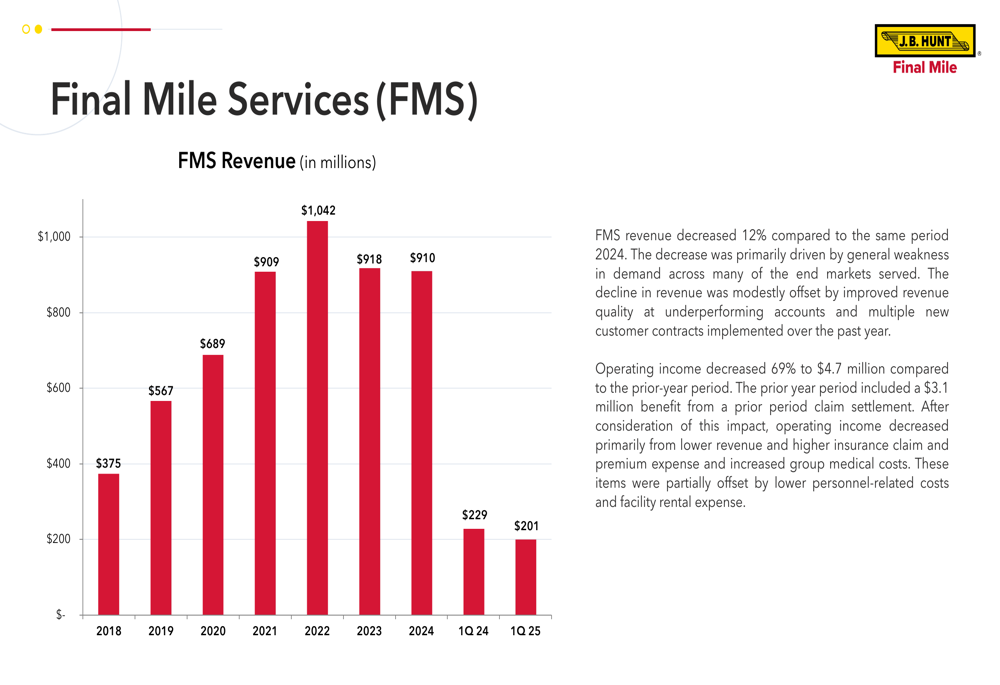
The significant decline in FMS performance is reflected in a 14.5% decrease in stops from 1,076,689 in Q1 2024 to 920,344 in Q1 2025, while average truck count decreased by 3.9% from 1,408 to 1,353.
Truckload (JBT)
The Truckload segment was the only business unit to report operating income growth, with a 66% increase to $2.0 million despite a 7% revenue decline to $167 million. Revenue excluding fuel surcharge decreased 4%, primarily due to a 6% decline in revenue per load excluding fuel surcharges.
The following chart shows the JBT revenue trend:
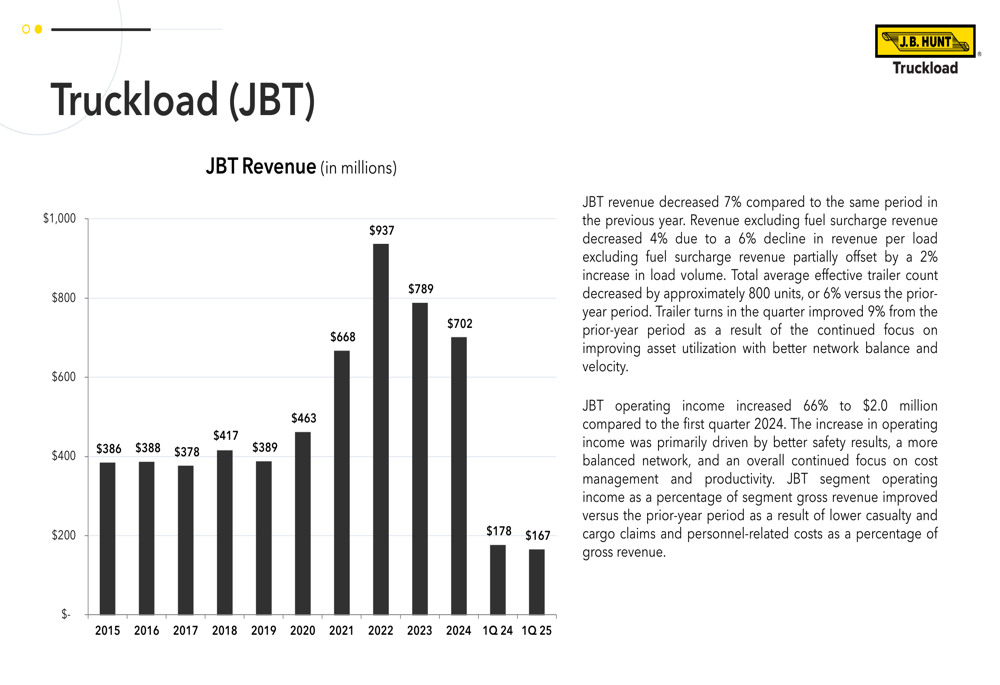
The improved profitability despite lower revenue suggests successful cost management and operational efficiency improvements in the Truckload segment. Load count actually increased by 1.6% from 93,685 to 95,143, while average effective trailing equipment decreased by 6.2% from 12,891 to 12,096, indicating better asset utilization.
Strategic Positioning
Despite the challenging quarter, J.B. Hunt continues to emphasize its competitive differentiation and strategic positioning in the transportation and logistics market. The company highlights its unique intermodal network, advantages in dedicated segments, and network economics as key differentiators.
The following summary slide outlines the company’s strategic positioning:
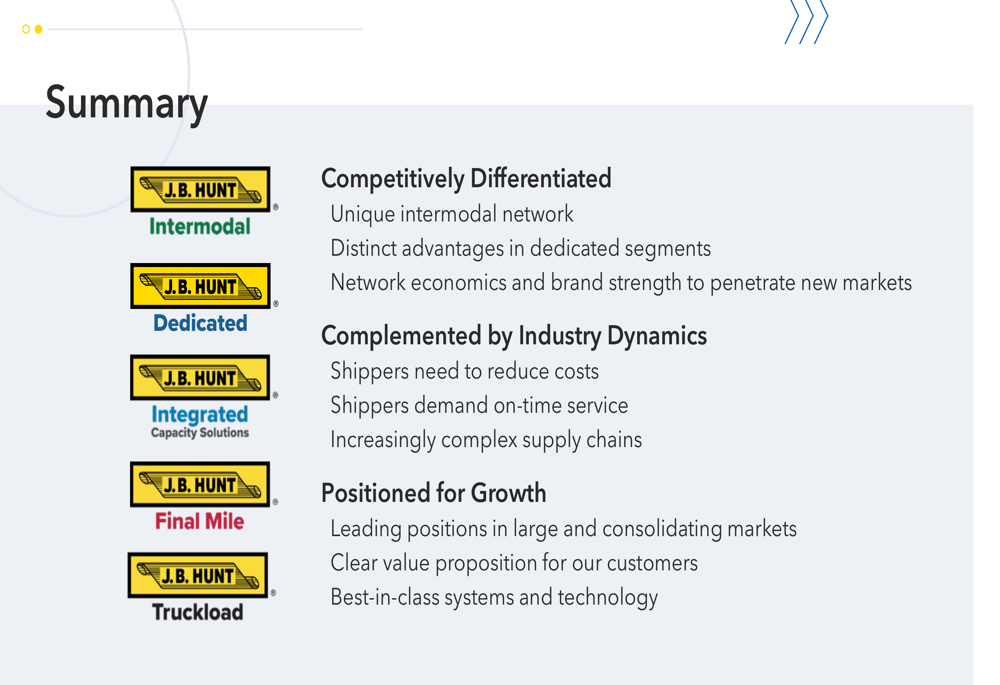
J.B. Hunt maintains that it is well-positioned for growth due to its leading positions in large markets, clear value proposition, and best-in-class technology. The company believes these strengths, combined with industry dynamics where shippers need to reduce costs while demanding on-time service, will support its long-term growth objectives.
Forward-Looking Statements
Looking ahead, J.B. Hunt has revised its capital expenditure guidance downward to $500-700 million from the previous range of $700-900 million, reflecting a more cautious approach to spending amid uncertain market conditions. The company remains focused on margin repair and cost management, with plans to return to net fleet growth in 2025.
Management emphasized during the earnings call that the company is maintaining pricing discipline, which has resulted in some business losses but is necessary for long-term profitability. Executives also noted that customers are exploring alternative sourcing strategies in response to tariff concerns.
The company’s balance sheet remains solid with total assets of $8.26 billion as of March 31, 2025, and stockholders’ equity of $3.87 billion. This financial strength provides J.B. Hunt with flexibility to navigate the ongoing challenges in the transportation market while continuing to invest in strategic growth initiatives.
As the transportation industry continues to face headwinds, J.B. Hunt’s diversified business model and focus on operational efficiency will be critical to improving performance in the coming quarters.
Full presentation:
This article was generated with the support of AI and reviewed by an editor. For more information see our T&C.