How are energy investors positioned?

Introduction & Market Context
Kadant Inc (NYSE:KAI) presented its first quarter 2025 business review on April 30, revealing a challenging start to the year with declining revenue and earnings, prompting a downward revision to full-year guidance. The industrial processing equipment manufacturer’s stock fell 4.87% in premarket trading to $300.21, reflecting investor concerns about the company’s growth trajectory.
The quarterly results come against a backdrop of persistent global trade uncertainties and geopolitical tensions affecting industrial demand, particularly in Europe and Asia. Despite these headwinds, Kadant highlighted record demand for aftermarket parts and strong free cash flow generation as bright spots in an otherwise difficult quarter.
Quarterly Performance Highlights
Kadant reported Q1 2025 revenue of $239.2 million, down 3.9% compared to the same period last year, while bookings increased 3.1% to $256.2 million, driven primarily by aftermarket parts demand. Net income decreased 2.5% to $24.1 million, with earnings per share (EPS) falling 2.9% to $2.04.
As shown in the following comprehensive performance summary:
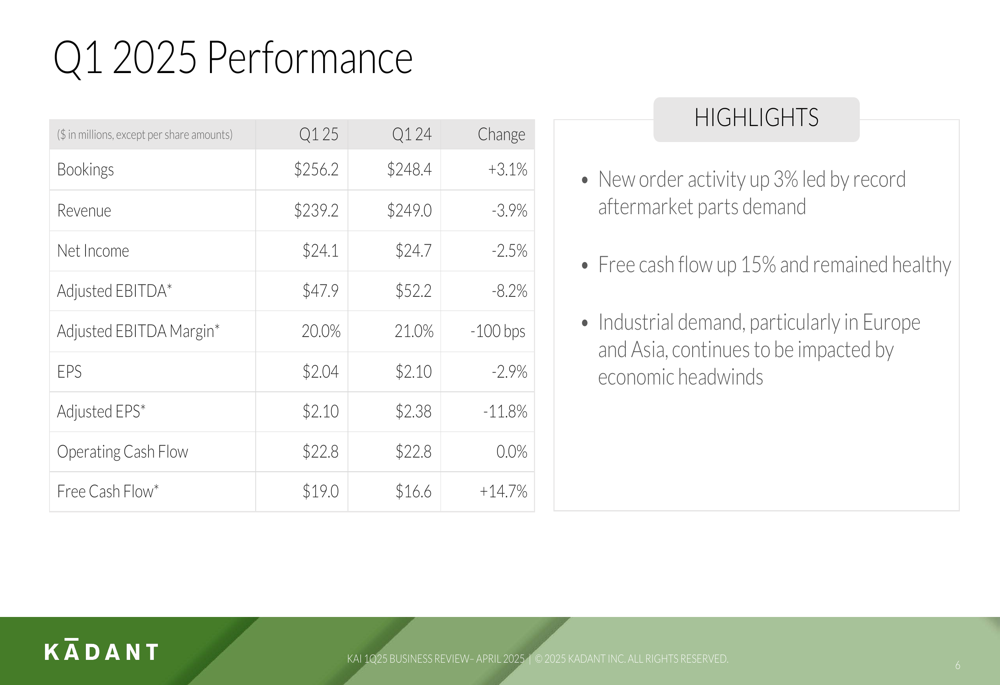
The company’s adjusted EBITDA declined 8.2% to $47.9 million, with adjusted EBITDA margin contracting 100 basis points to 20.0%. However, free cash flow increased 14.7% to $19.0 million, demonstrating Kadant’s continued ability to generate cash despite revenue challenges.
A key positive development was the increased contribution from aftermarket parts and consumables, which represented 75% of total revenue in Q1 2025, up from 69% in the prior-year period. This higher-margin business helped partially offset weakness in capital equipment sales.
Segment Performance Analysis
Kadant’s three operating segments delivered mixed results, with Flow Control showing strength while Industrial Processing faced significant headwinds.
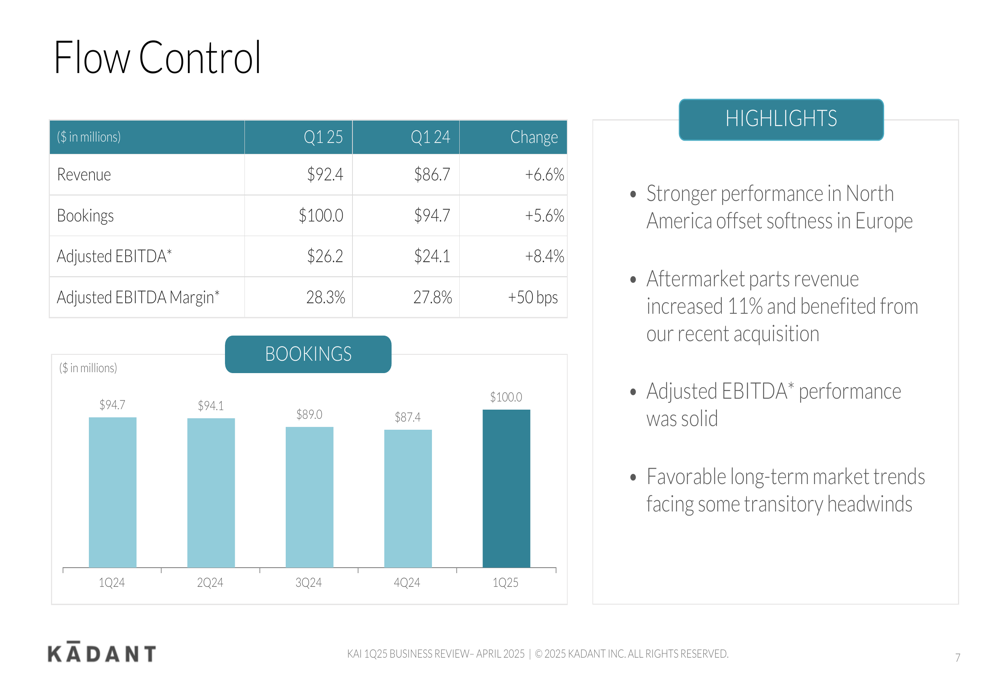
The Flow Control segment was the standout performer, with revenue increasing 6.6% to $92.4 million and bookings rising 5.6% to $100.0 million. Adjusted EBITDA grew 8.4% to $26.2 million, with margin expanding 50 basis points to 28.3%. Management attributed this performance to stronger demand in North America offsetting softness in Europe, with aftermarket parts revenue increasing 11%.
As illustrated in the Flow Control segment performance chart:
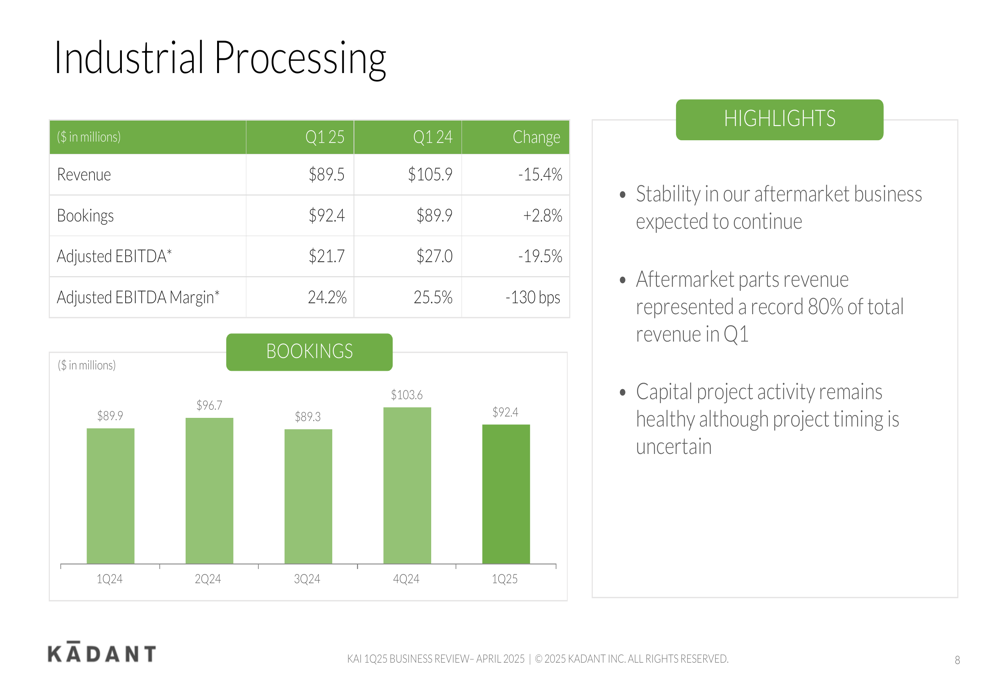
In contrast, the Industrial Processing segment struggled considerably, with revenue declining 15.4% to $89.5 million despite a 2.8% increase in bookings to $92.4 million. Adjusted EBITDA fell 19.5% to $21.7 million, with margin contracting 130 basis points to 24.2%. However, management highlighted that aftermarket parts revenue represented a record 80% of the segment’s total revenue, up from 69% in Q1 2024.
The segment’s performance is detailed in the following chart:
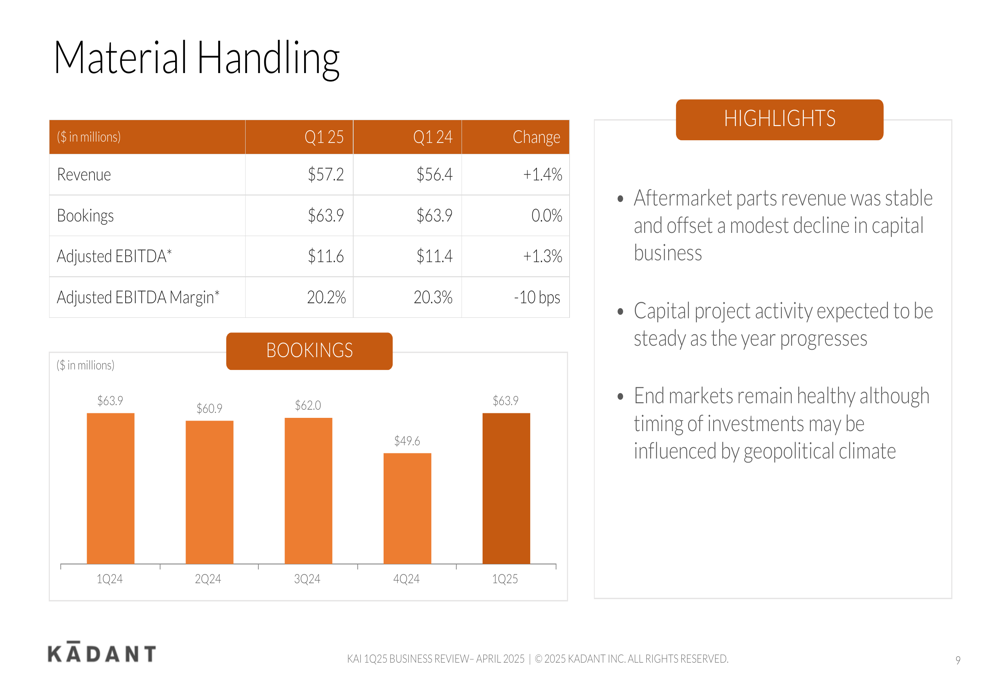
The Material Handling segment showed modest growth, with revenue increasing 1.4% to $57.2 million and bookings remaining flat at $63.9 million year-over-year. Adjusted EBITDA increased 1.3% to $11.6 million, while margin contracted slightly by 10 basis points to 20.2%.
The following chart illustrates the Material Handling segment’s performance:
Detailed Financial Analysis
Kadant’s gross margin improved to 46.1% in Q1 2025 from 44.6% in Q1 2024, benefiting from the higher mix of aftermarket parts and consumables revenue. However, SG&A expenses as a percentage of revenue increased to 29.8% from 28.2%, reflecting reduced operating leverage due to lower revenue.
The company’s adjusted EPS declined 11.8% to $2.10 from $2.38 in the prior-year period. The following waterfall chart breaks down the factors contributing to this decline:
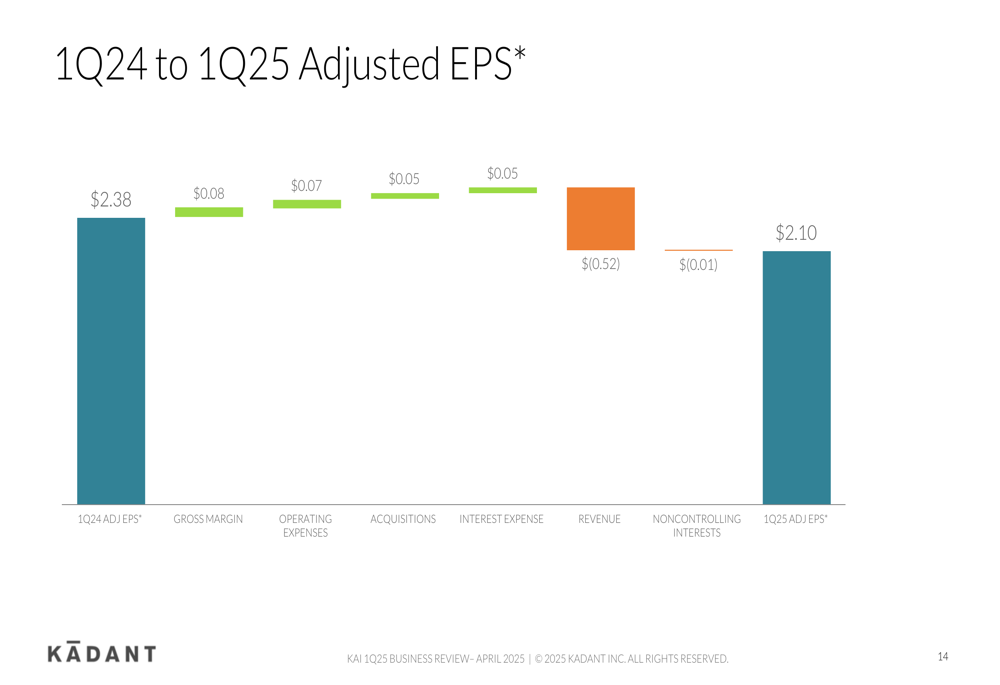
As shown in the chart, revenue decline was the largest negative factor, reducing EPS by $0.52, while improvements in gross margin, operating expenses, acquisitions, and interest expense provided partial offsets.
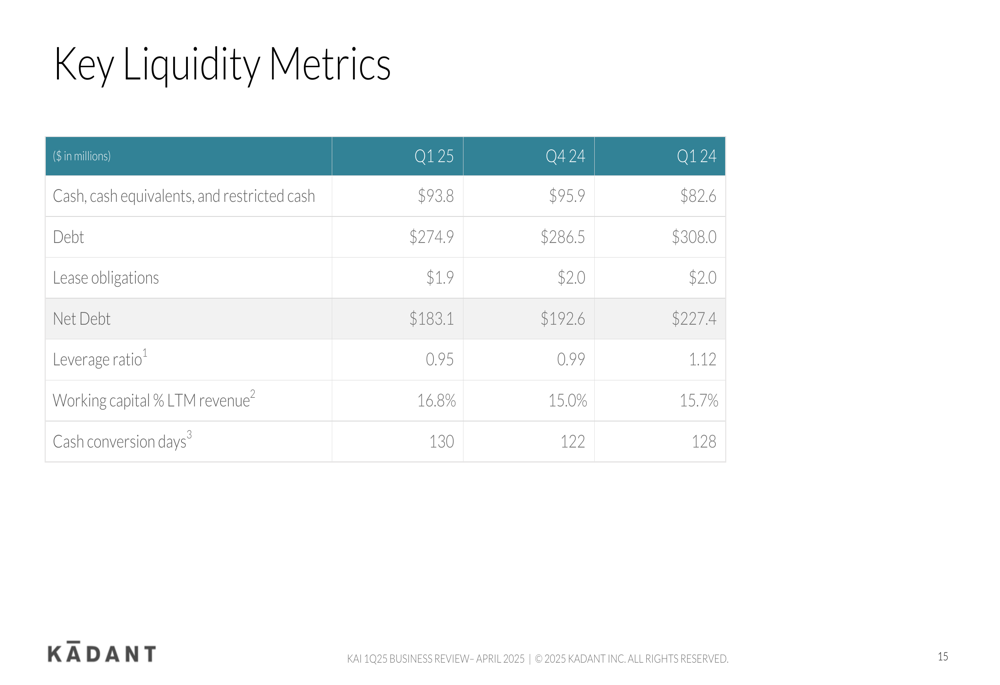
Kadant maintained a strong balance sheet, with cash and equivalents of $93.8 million and debt of $274.9 million as of the end of Q1 2025. The company’s net debt decreased to $183.1 million from $227.4 million a year earlier, with its leverage ratio improving to 0.95 from 1.12 in Q1 2024.
The following table details Kadant’s key liquidity metrics:
Forward-Looking Statements
In a significant development, Kadant revised its full-year 2025 guidance downward, citing ongoing challenges in industrial demand and project activity due to global trade uncertainties. The company now expects:
- FY 2025 revenue of $1.020 to $1.040 billion, down from previous guidance of $1.040 to $1.065 billion
- FY 2025 GAAP EPS of $8.97 to $9.17, reduced from $9.63 to $9.98
- FY 2025 adjusted EPS of $9.05 to $9.25, down from $9.70 to $10.05
For the second quarter of 2025, Kadant projects:
- Q2 2025 revenue of $243 to $250 million
- Q2 2025 GAAP EPS of $1.89 to $1.99
- Q2 2025 adjusted EPS of $1.90 to $2.00
This guidance revision represents a notable shift from the company’s more optimistic outlook following its strong Q4 2024 performance, when it had initially guided for 2025 revenue of $1.040 to $1.065 billion.
Despite the near-term challenges, management expressed confidence in the company’s long-term positioning, stating: "Our strong cash flow and healthy balance sheet position us well to capitalize on new opportunities." The company also emphasized that its aftermarket business is expected to remain healthy despite the current geopolitical environment.
Strategic Initiatives
Kadant outlined four key priorities for 2025:
1. Enable Sustainable Industrial Processing
2. Deliver Exceptional Stakeholder Value
3. Provide Strong Cash Flow
4. Capitalize on New Opportunities
The company’s focus on sustainability aligns with broader industry trends toward more environmentally friendly industrial processes. Meanwhile, the emphasis on cash flow generation and balance sheet strength suggests a strategic focus on maintaining financial flexibility in an uncertain economic environment.
Kadant’s geographic revenue breakdown reveals the impact of regional economic disparities, with North America showing resilience while Europe and Asia face more significant challenges. The following table illustrates this regional performance:
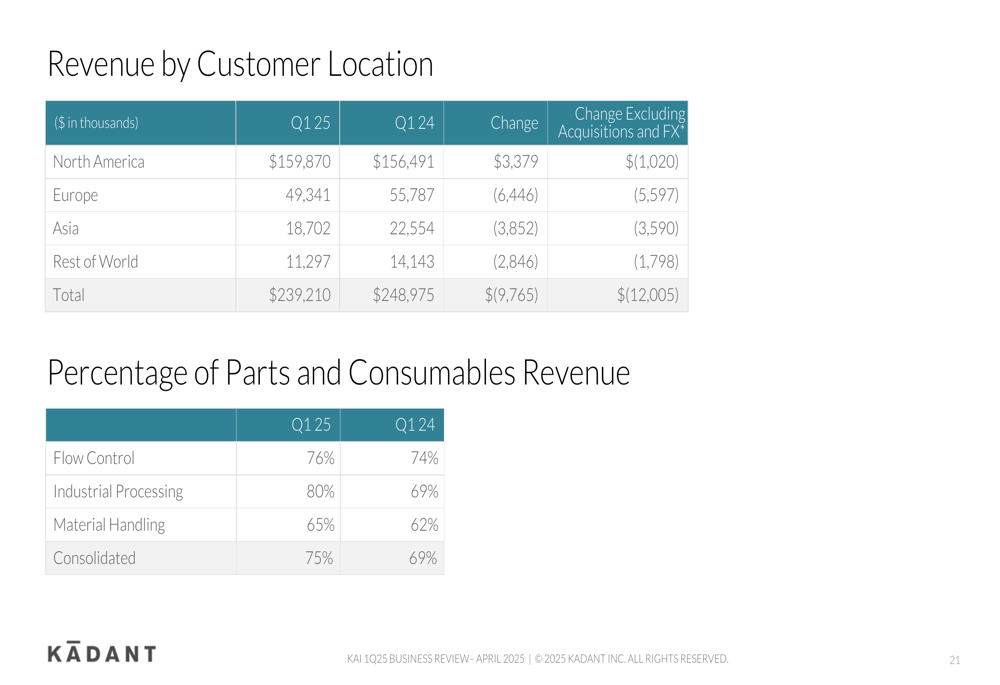
The company’s ability to maintain and grow its aftermarket parts and consumables business, which now represents 75% of total revenue, provides a degree of stability amid fluctuating capital equipment demand. This strategic emphasis on recurring revenue streams appears to be a key element of Kadant’s approach to navigating the current economic uncertainty.
Full presentation:
This article was generated with the support of AI and reviewed by an editor. For more information see our T&C.