BofA warns Fed risks policy mistake with early rate cuts

Kennametal Inc. (NYSE:KMT) reported a 6% year-over-year sales decline in its third quarter of fiscal year 2025, though the company managed to improve its adjusted EBITDA margin by 370 basis points. The industrial technology company’s presentation, delivered on May 7, 2025, highlighted strategies to navigate challenging market conditions and mitigate tariff impacts while continuing to return value to shareholders.
Quarterly Performance Highlights
Kennametal reported Q3 FY25 sales of $486 million, representing a 6% decrease from the prior year, with organic sales declining by 3%. Despite this top-line pressure, the company delivered adjusted earnings per share of $0.47, a significant improvement from $0.30 in the same period last year.
As shown in the following comprehensive financial overview, the company’s adjusted EBITDA reached $86.9 million with a margin of 17.9%, up 370 basis points year-over-year:
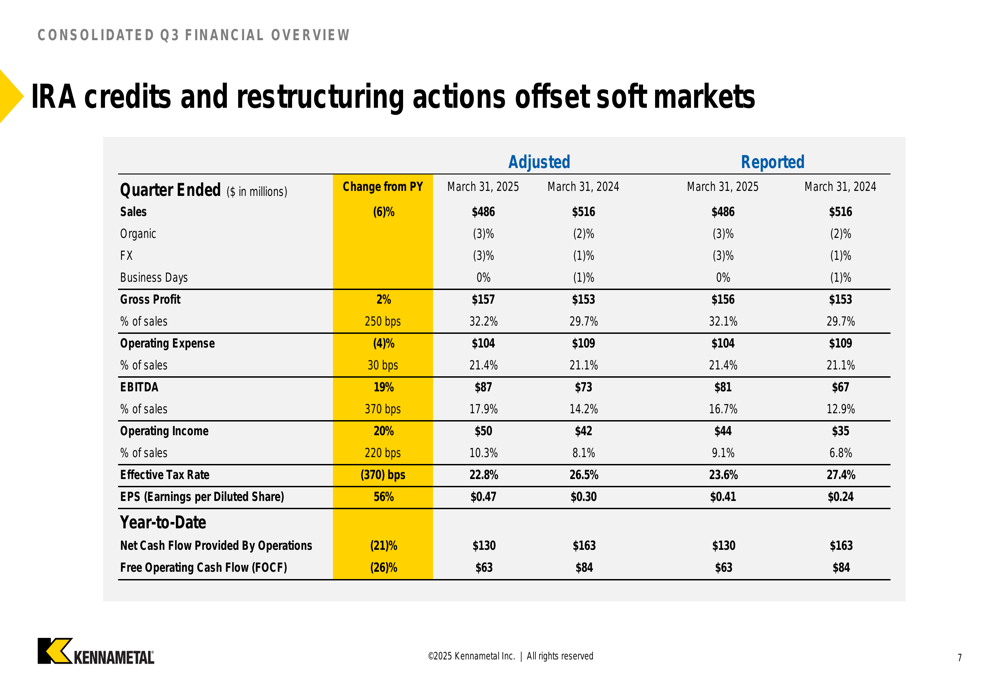
The improvement in profitability came despite sales challenges, with the company benefiting from lower raw material costs, favorable pricing, and restructuring savings of approximately $6 million. Additionally, Kennametal received an Inflation Reduction Act (IRA) advanced manufacturing production credit of approximately $10 million, which contributed to the margin expansion.
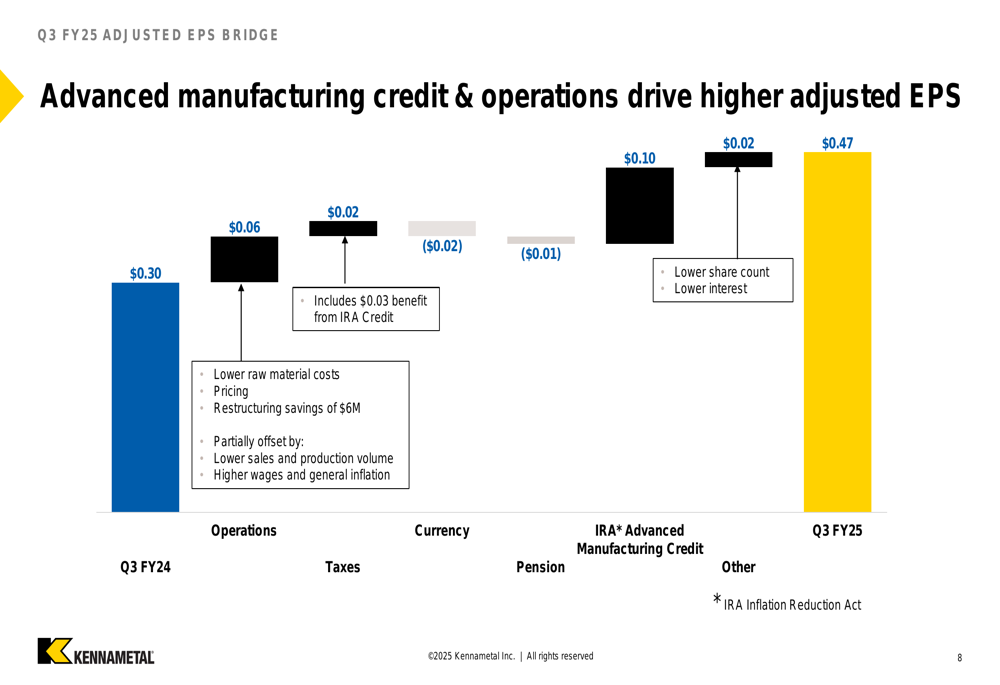
The following bridge analysis illustrates the various factors that contributed to the EPS improvement from $0.30 in Q3 FY24 to $0.47 in Q3 FY25:
Segment Performance Analysis
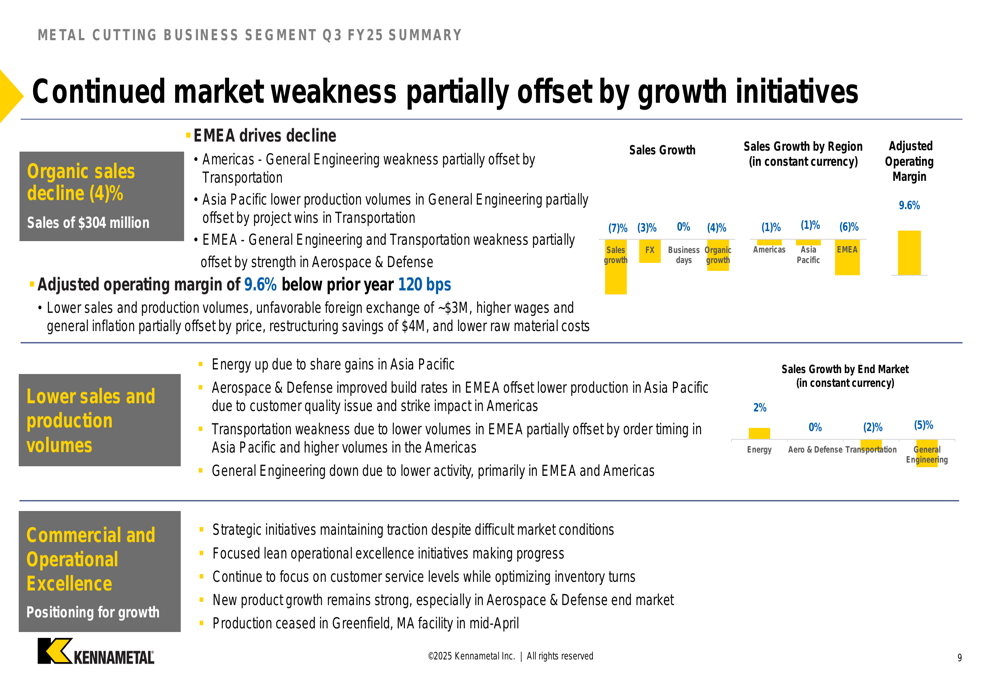
Kennametal’s two business segments delivered divergent results in the quarter. The Metal Cutting segment, which accounted for approximately 63% of total sales, experienced a 4% organic sales decline and saw its adjusted operating margin decrease by 120 basis points to 9.6%. This performance was attributed to lower sales, unfavorable foreign exchange, higher wages, and general inflation, partially offset by pricing actions, restructuring savings, and lower raw material costs.
The following slide details the Metal Cutting segment’s performance across regions and end markets:
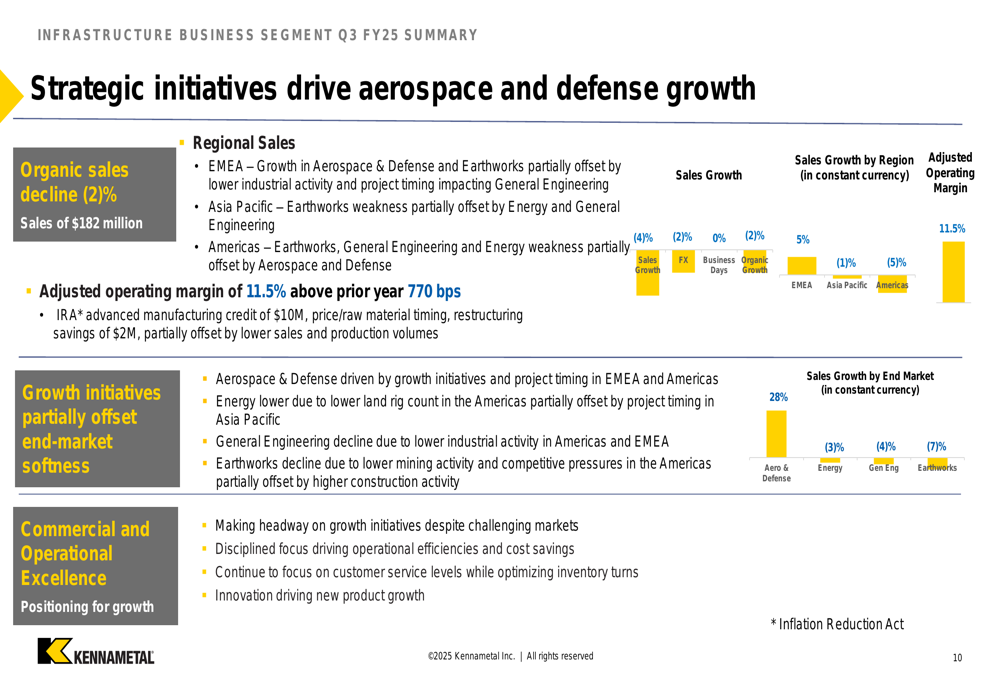
In contrast, the Infrastructure segment demonstrated significant margin improvement despite a 2% organic sales decline. Its adjusted operating margin increased by 770 basis points to 11.5%, benefiting from the IRA advanced manufacturing credit, favorable price/raw material timing, and restructuring savings.
The Infrastructure segment’s performance across regions and end markets is illustrated in this detailed breakdown:
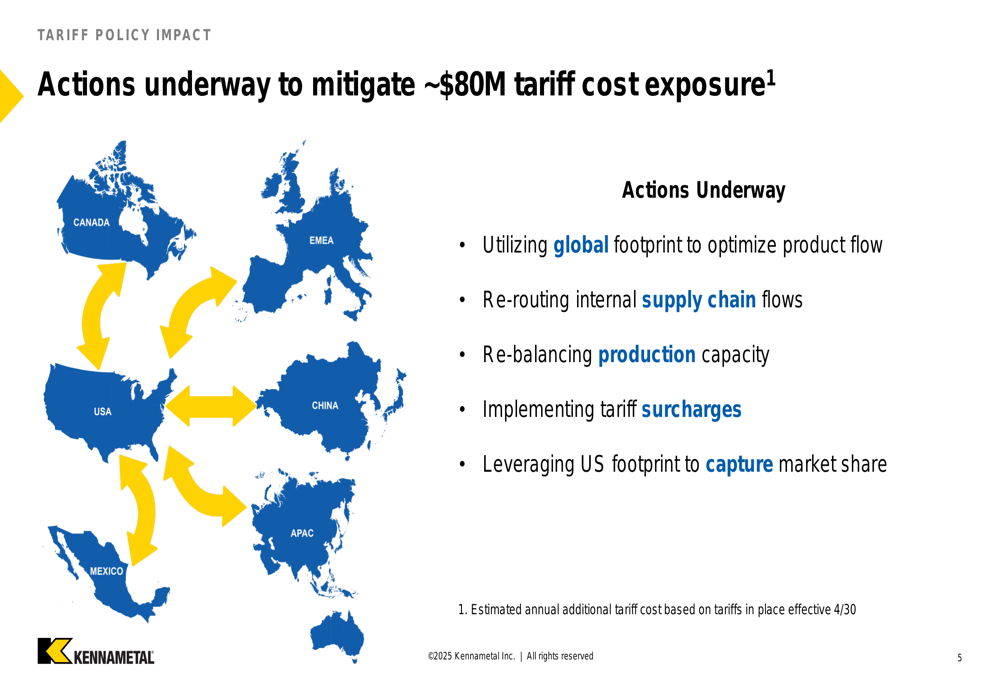
Tariff Mitigation Strategy
A key focus of Kennametal’s presentation was its comprehensive approach to mitigating an estimated $80 million in tariff cost exposure. The company outlined several strategic actions, including optimizing its global footprint, re-routing internal supply chain flows, and implementing tariff surcharges.
As shown in the following global strategy map, Kennametal is leveraging its international presence to adapt to changing trade dynamics:
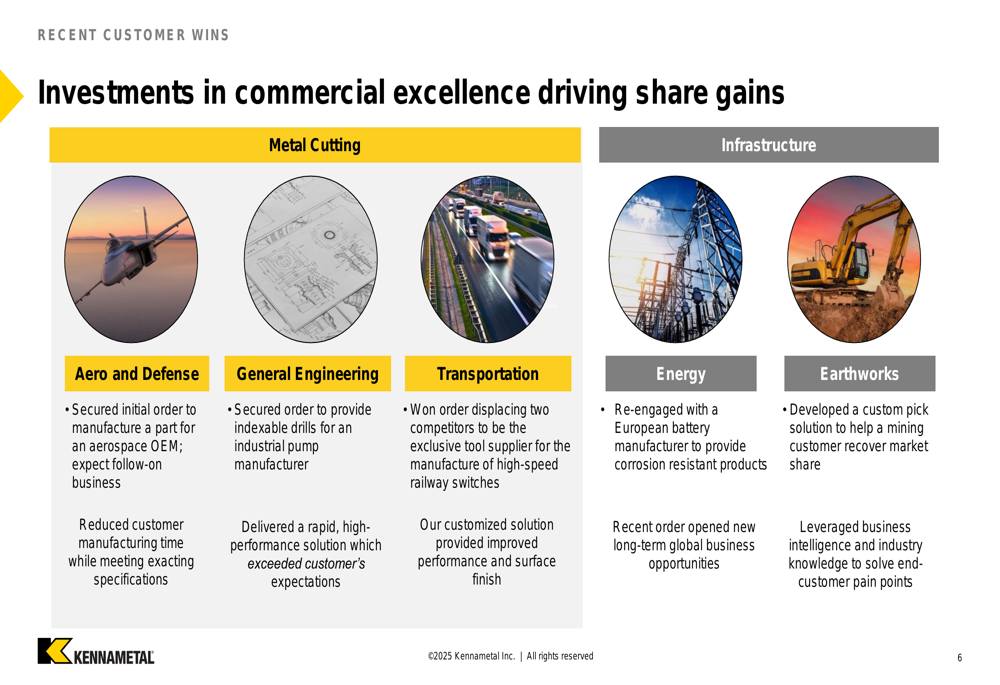
The company also highlighted recent customer wins across various sectors that demonstrate the effectiveness of its commercial excellence initiatives. These successes span aerospace and defense, general engineering, transportation, energy, and earthworks markets.
The following slide showcases specific examples of these customer wins:
Balance Sheet and Cash Flow
Kennametal maintained a solid financial position with total debt of $609 million and net debt of $512 million as of Q3 FY25. The company continued its commitment to shareholder returns, with $25 million in share repurchases and $15 million in dividends during the quarter.
The following chart illustrates the company’s debt profile and cash flow highlights:
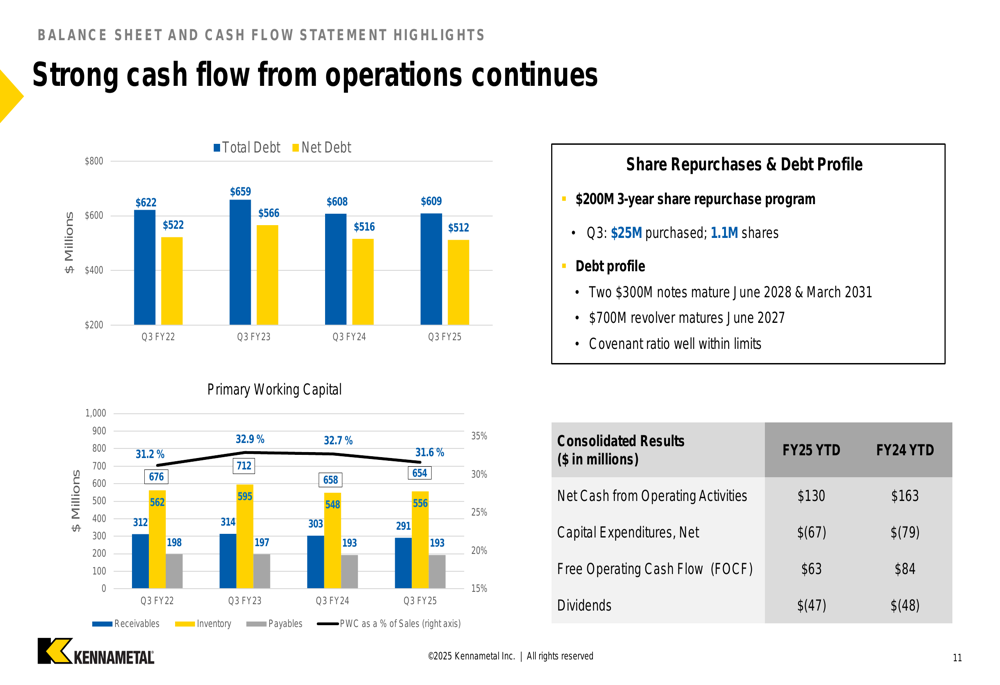
Year-to-date, Kennametal generated $130 million in cash from operating activities and $63 million in free operating cash flow, demonstrating its ability to generate cash despite challenging market conditions.
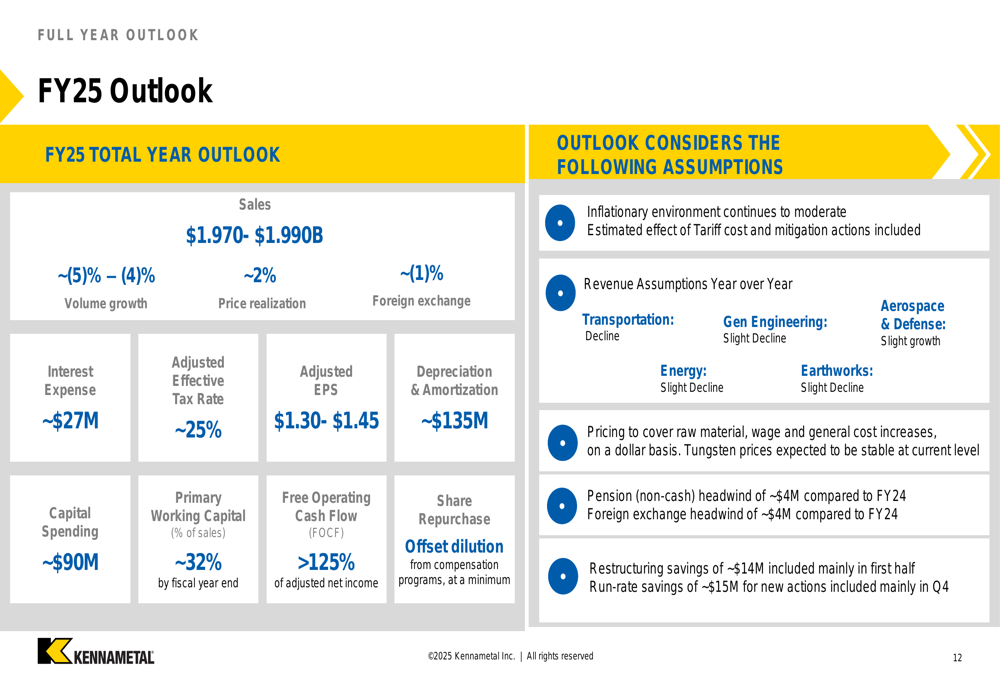
Forward-Looking Statements
Looking ahead, Kennametal provided guidance for fiscal year 2025, projecting sales between $1.970 billion and $1.990 billion, representing a volume decline of 4-5%. The company expects adjusted earnings per share between $1.30 and $1.45, with free operating cash flow exceeding 125% of net income.
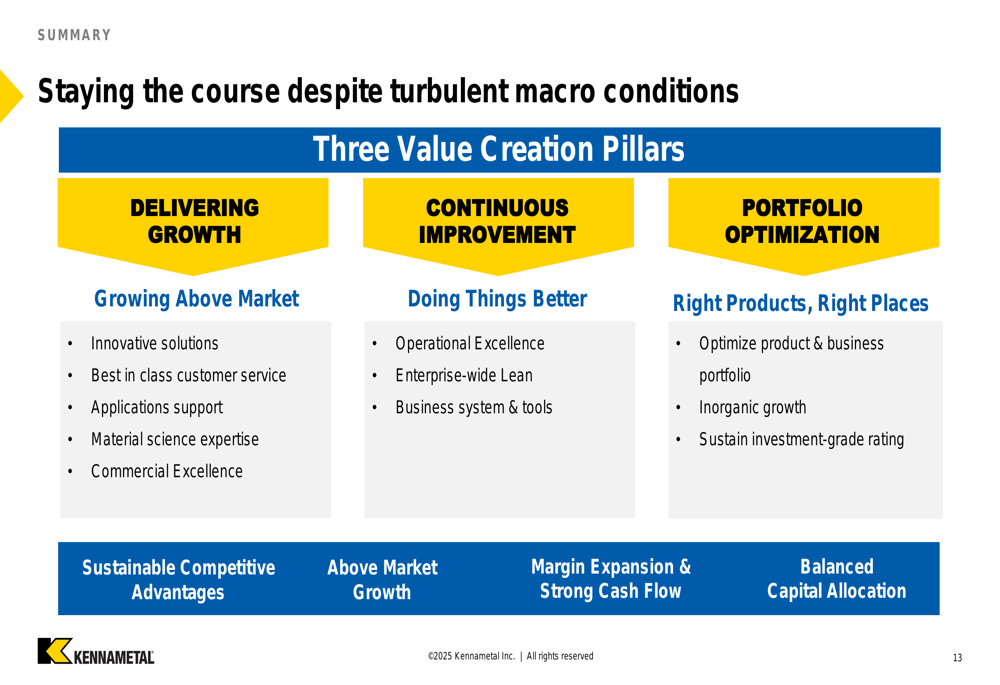
The company’s strategy continues to be anchored in three value creation pillars: delivering growth through innovative solutions and commercial excellence, driving continuous improvement through operational excellence and lean practices, and optimizing its portfolio to ensure the right products are in the right places.
In the premarket trading following the earnings release, Kennametal’s stock was up 5.95% to $21.00, suggesting a positive market reaction to the results despite the sales decline. This response likely reflects investor appreciation for the margin improvement and effective cost management demonstrated in the quarter, as well as the company’s proactive approach to addressing tariff challenges.
Full presentation:
This article was generated with the support of AI and reviewed by an editor. For more information see our T&C.