Aspire Biopharma faces potential Nasdaq delisting after compliance shortfall

Introduction & Market Context
Knight-Swift Transportation Holdings Inc. (NYSE:KNX) reported its second quarter 2025 results on July 23, showing significant improvement in profitability metrics despite only modest revenue growth. The transportation giant, currently valued at $7.1 billion, saw its stock dip 1.24% in premarket trading to $42.20 following the announcement, despite the positive financial results. The company’s shares have traded between $36.69 and $61.51 over the past 52 weeks, with analysts setting price targets ranging from $41 to $67.
Quarterly Performance Highlights
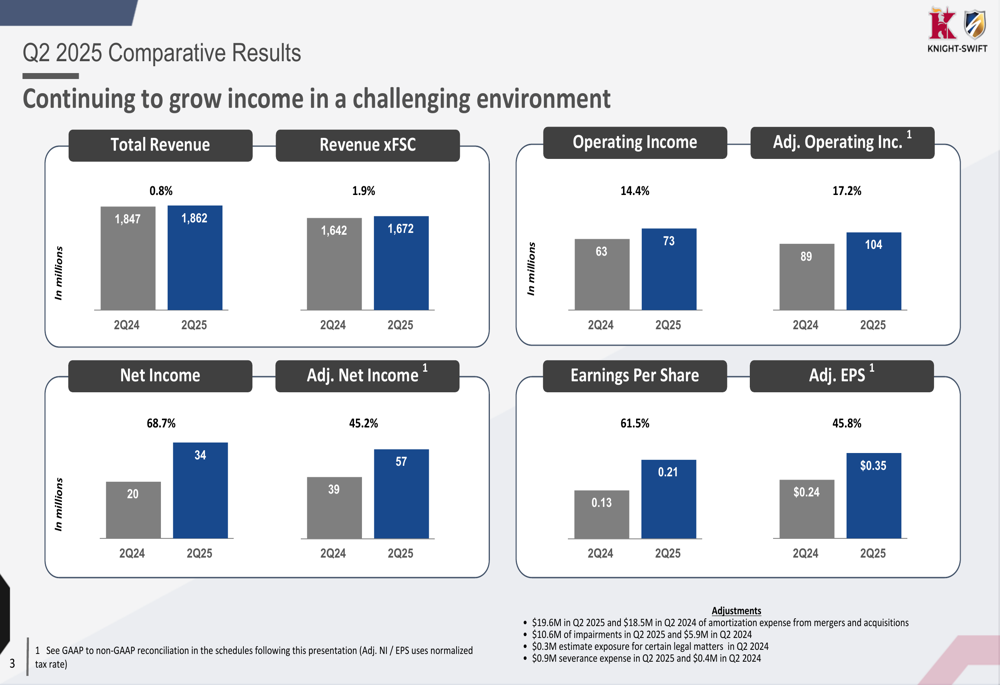
Knight-Swift’s Q2 2025 results demonstrated substantial year-over-year improvement across key profitability metrics, even as total revenue growth remained modest. Total revenue increased by 0.8% to $1.86 billion, while revenue excluding fuel surcharges (xFSC) grew by 1.9% to $1.67 billion compared to Q2 2024.
More impressive were the company’s profitability metrics, with operating income increasing by 14.4% to $73 million and adjusted operating income rising by 17.2% to $104 million. Net income showed a dramatic 68.7% increase to $34 million, while adjusted net income grew by 45.2% to $57 million. This translated to earnings per share of $0.21, up 61.5% year-over-year, and adjusted EPS of $0.35, representing a 45.8% increase.
As shown in the following comparative results chart, Knight-Swift demonstrated significant improvement across all key financial metrics:
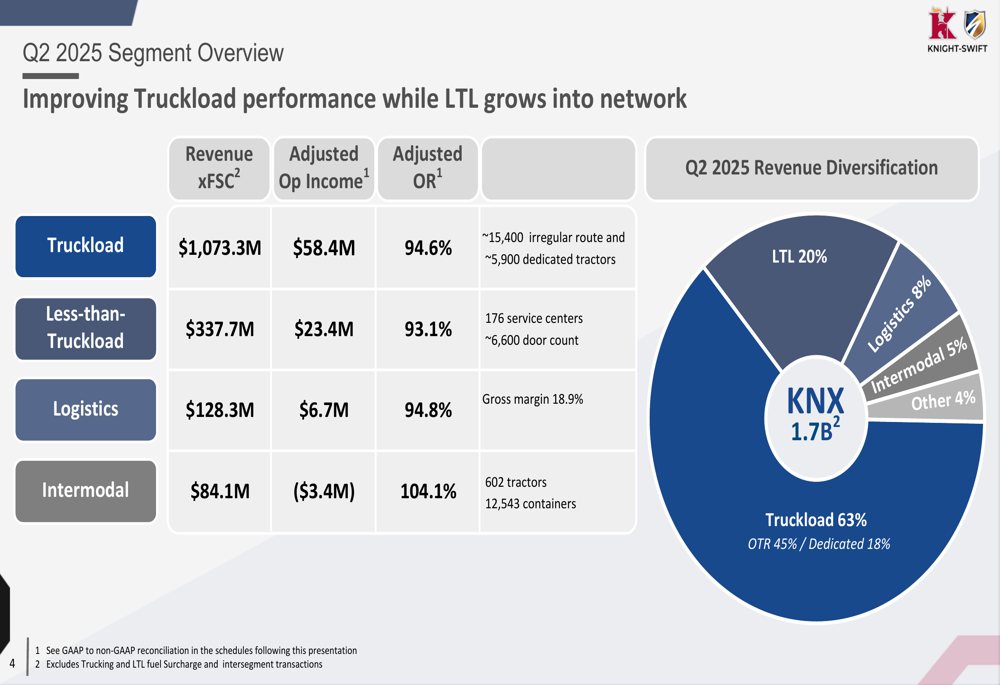
The company’s revenue diversification strategy is evident in its segment breakdown, with Truckload operations accounting for 63% of revenue (45% over-the-road and 18% dedicated), Less-than-Truckload (LTL) at 20%, Logistics at 8%, Intermodal at 5%, and Other segments at 4%.
As illustrated in this revenue diversification chart:
Segment Analysis
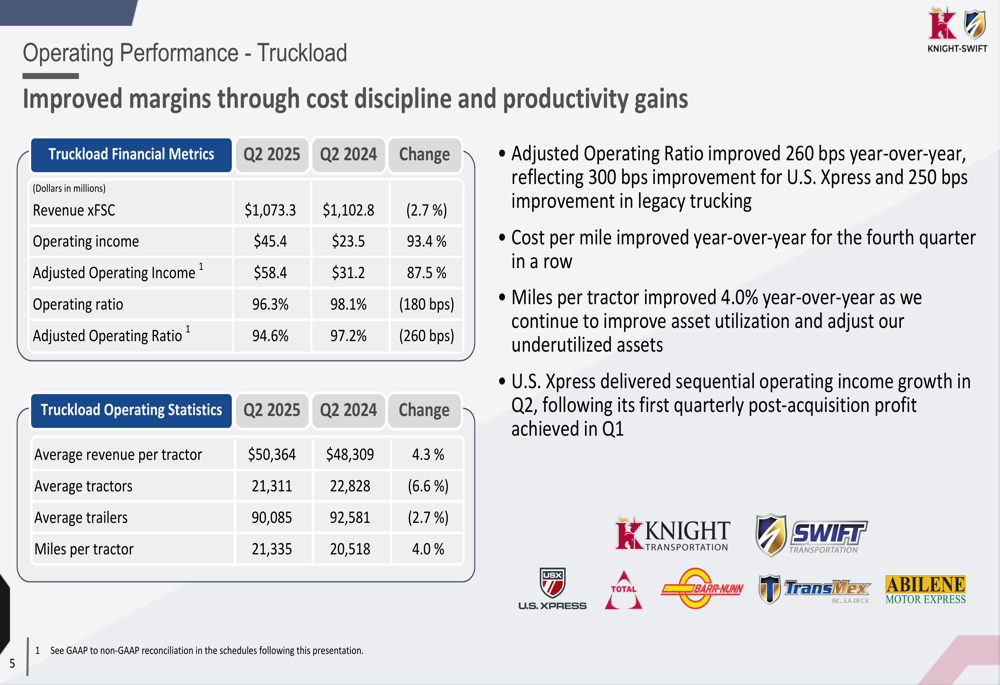
Knight-Swift’s Truckload segment, which remains the company’s largest revenue contributor, showed improved profitability despite a slight revenue decline. Revenue excluding fuel surcharges decreased by 2.7% to $1.07 billion, but adjusted operating income surged by 87.5% to $58.4 million. The segment’s adjusted operating ratio improved significantly by 260 basis points to 94.6%.
The improved Truckload performance was driven by a 4.3% increase in average revenue per tractor to $50,364 and a 4.0% increase in miles per tractor to 21,335, despite a 6.6% reduction in the average number of tractors to 21,311. This indicates substantial efficiency improvements in the company’s core operations.
The following chart details the Truckload segment’s performance metrics:
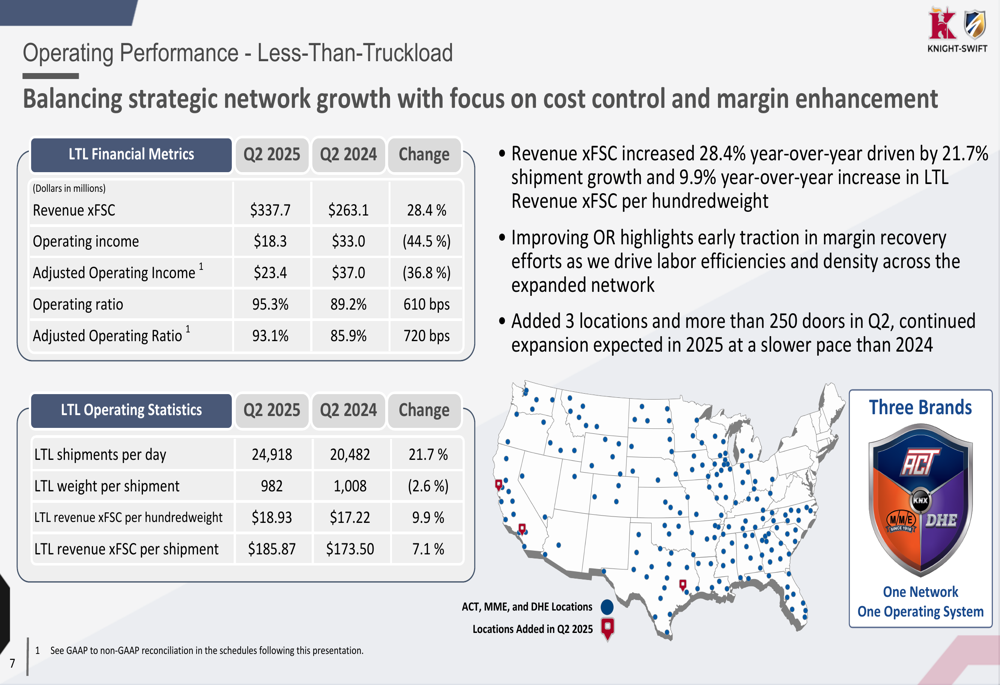
The Less-than-Truckload (LTL) segment showed strong revenue growth but declining profitability. Revenue excluding fuel surcharges increased by 28.4% to $337.7 million, driven by a 21.7% increase in shipments per day to 24,918. However, adjusted operating income decreased by 36.8% to $23.4 million, with the adjusted operating ratio deteriorating by 720 basis points to 93.1%.
The company’s LTL network is illustrated in the following map, showing the geographic coverage of its operations:
The Logistics segment experienced a slight revenue decline of 2.6% to $128.3 million but improved its profitability with a 13.3% increase in adjusted operating income to $6.7 million. The segment’s adjusted operating ratio improved by 70 basis points to 94.8%, with gross margin increasing by 100 basis points to 18.9%.
The Intermodal segment continued to face challenges, with revenue declining by 13.8% to $84.1 million and operating losses nearly doubling to $3.4 million. The segment’s operating ratio deteriorated by 230 basis points to 104.1%, reflecting ongoing difficulties in this area of the business.
Cost Reduction Initiatives
A key focus of Knight-Swift’s presentation was its comprehensive cost reduction strategy, particularly within the Truckload segment. The company reported a 1.5% (3 cents per mile) reduction in cost per mile for the trailing twelve months ended June 2025 compared to the same period in 2024.
The cost reductions were achieved through both fixed and variable cost initiatives. Fixed cost reductions focused primarily on equipment, G&A, and facility costs, while variable cost per mile improvements were driven by initiatives in insurance, maintenance, fuel, and other operating expenses.
As shown in the following slide detailing the company’s cost structure improvements:
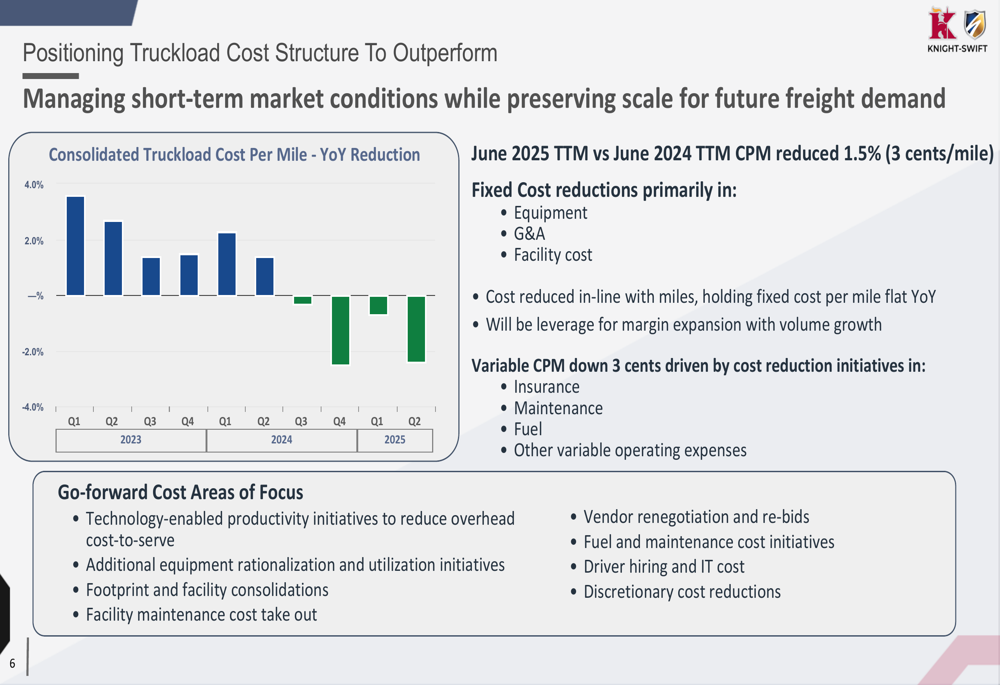
Looking forward, Knight-Swift outlined several focus areas for continued cost reduction, including technology-enabled productivity initiatives, additional equipment rationalization, facility consolidations, vendor renegotiations, fuel and maintenance cost initiatives, and discretionary cost reductions.
Forward Guidance
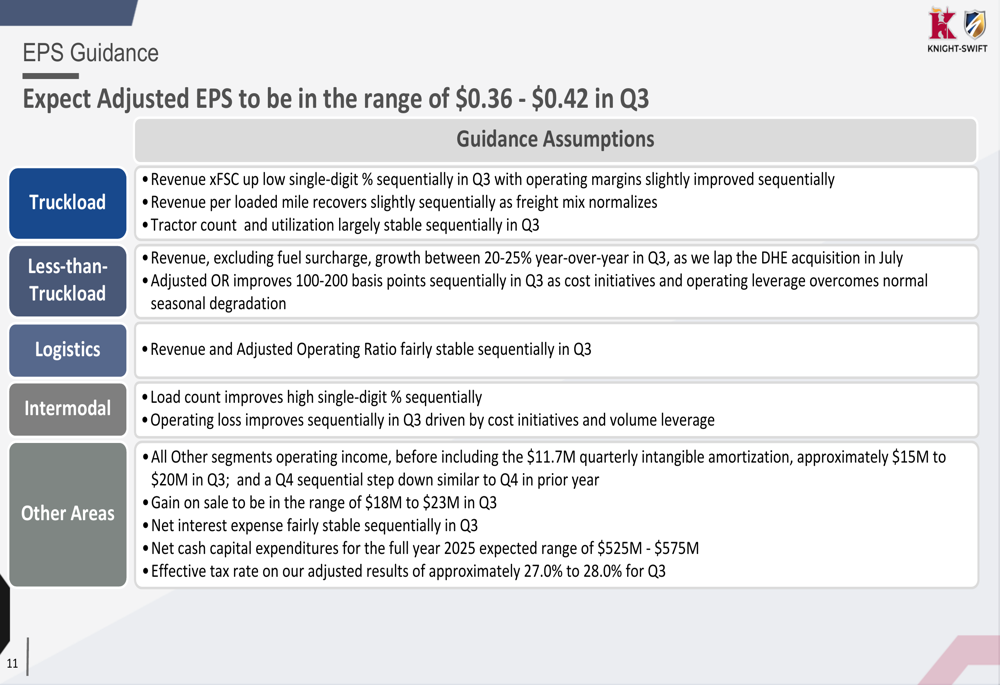
Knight-Swift provided guidance for the third quarter of 2025, projecting adjusted earnings per share between $0.36 and $0.42. The company expects its Truckload segment to see low single-digit sequential revenue growth with slightly improved operating margins, while the LTL segment is anticipated to continue its strong revenue growth between 20-25% year-over-year with a 100-200 basis point improvement in adjusted operating ratio.
The Logistics segment is expected to maintain relatively stable revenue and adjusted operating ratio, while the Intermodal segment is projected to see high single-digit percentage improvement in load count with reduced operating losses. The company also revised its full-year net cash capital expenditures forecast to between $525 million and $575 million.
The following guidance slide provides details on the company’s Q3 2025 outlook:
CEO Adam Miller expressed cautious optimism during the earnings call, stating, "We feel like the worst is behind us," while CFO Andrew Hess emphasized the company’s focus on cost reduction, noting, "Our goal is to dramatically, over time, change the cost to serve on the back end of our business in a material way."
Despite the positive earnings report, Knight-Swift continues to face challenges including a soft freight environment, particularly on the West Coast, potential volatility in trade policies, challenges in LTL network expansion and integration, and increasing competition due to price transparency in the transportation market. However, the company’s diversified business model and focus on operational efficiency position it well to navigate these challenges while pursuing growth opportunities in the improving market environment.
Full presentation:
This article was generated with the support of AI and reviewed by an editor. For more information see our T&C.