Intellia presents positive data for hereditary angioedema treatment

Introduction & Market Context
Linamar Corporation (TSX:LNR) presented its second quarter 2025 earnings on August 13, showing resilience despite challenging market conditions. The stock closed at $70.11, up 4.52% following the presentation, reflecting investor confidence in the company’s performance despite revenue headwinds.
The Canadian auto parts and equipment manufacturer demonstrated its ability to navigate industry-wide volume declines through market share gains and operational efficiencies. This performance builds on momentum from Q1 2025, when the company reported EPS growth despite revenue challenges.
Executive Summary
Linamar’s Q2 2025 presentation highlighted the company’s ability to deliver cash and share gains despite lower industry volumes. Key achievements included minimal impact from US tariffs, strong free cash flow generation, significant growth in the Mobility segment, and market share gains across all business areas.
As shown in the following financial highlights slide, Linamar reported sales of $2.6 billion, down 7.2% year-over-year, while normalized net earnings reached $168.4 million with a 6.4% margin:
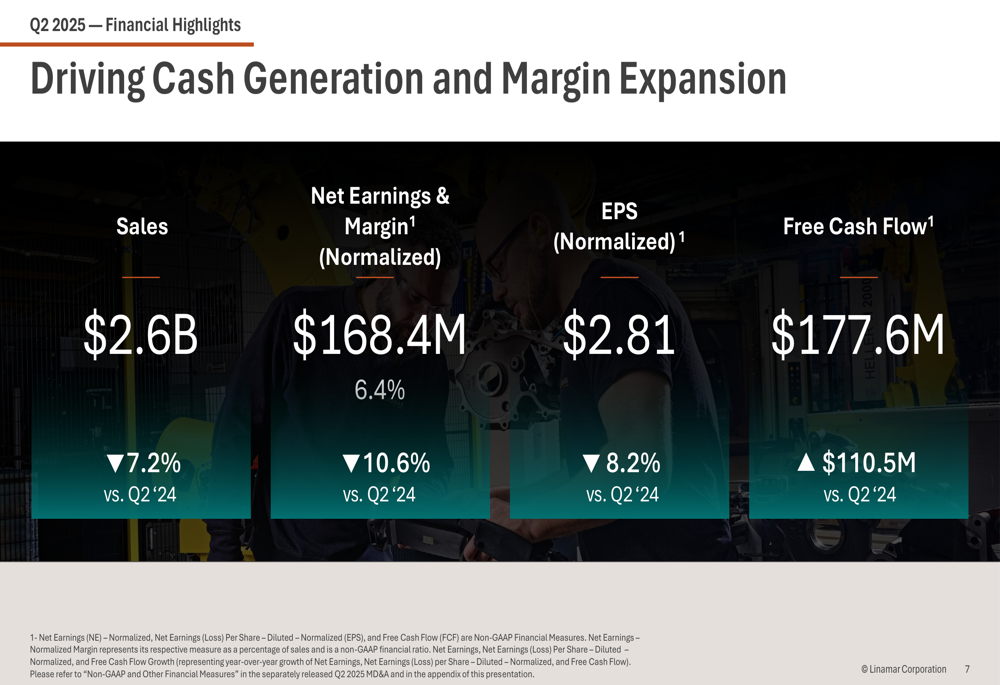
Despite the revenue decline, normalized EPS of $2.81 showed continued strength following Q1’s $2.76 result. Most notably, free cash flow surged to $177.6 million, representing a $110.5 million increase from the same period last year.
Quarterly Performance Highlights
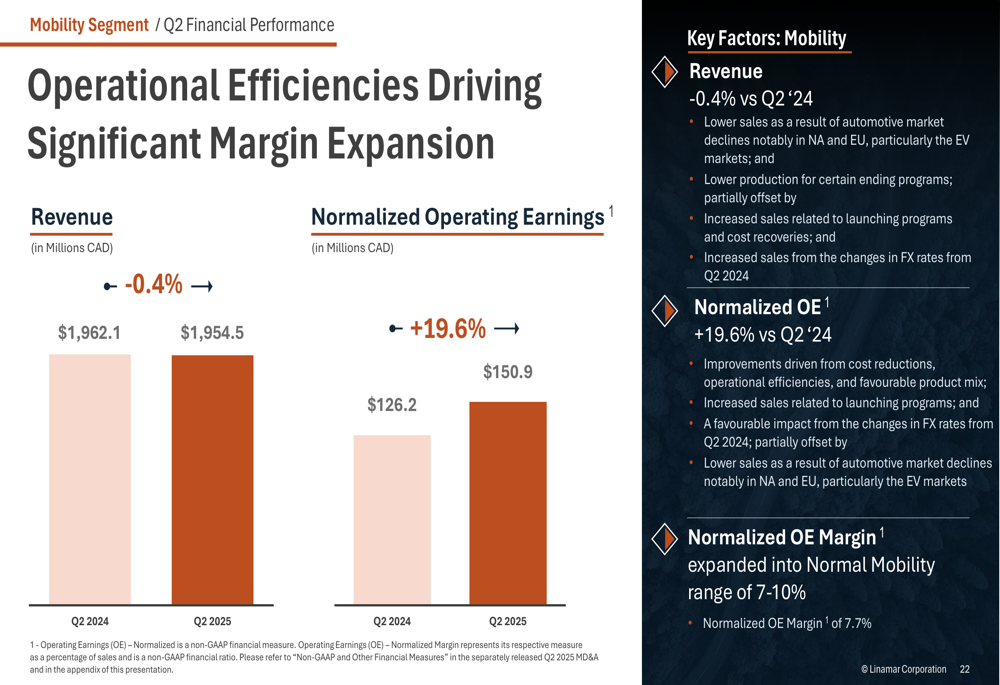
Linamar’s performance varied significantly between its two main segments. The Mobility segment demonstrated remarkable resilience with normalized operating earnings increasing 19.6% to $150.9 million despite a slight 0.4% revenue decline. This improvement drove operating margins back into the normal range of 7-10%.
The following slide illustrates how operational efficiencies drove significant margin expansion in the Mobility segment:
In contrast, the Industrial segment faced substantial challenges with revenue declining 22.4% to $688.2 million and normalized operating earnings falling 37.1% to $103.3 million. This performance reflected broader market weakness in agricultural and access equipment markets.
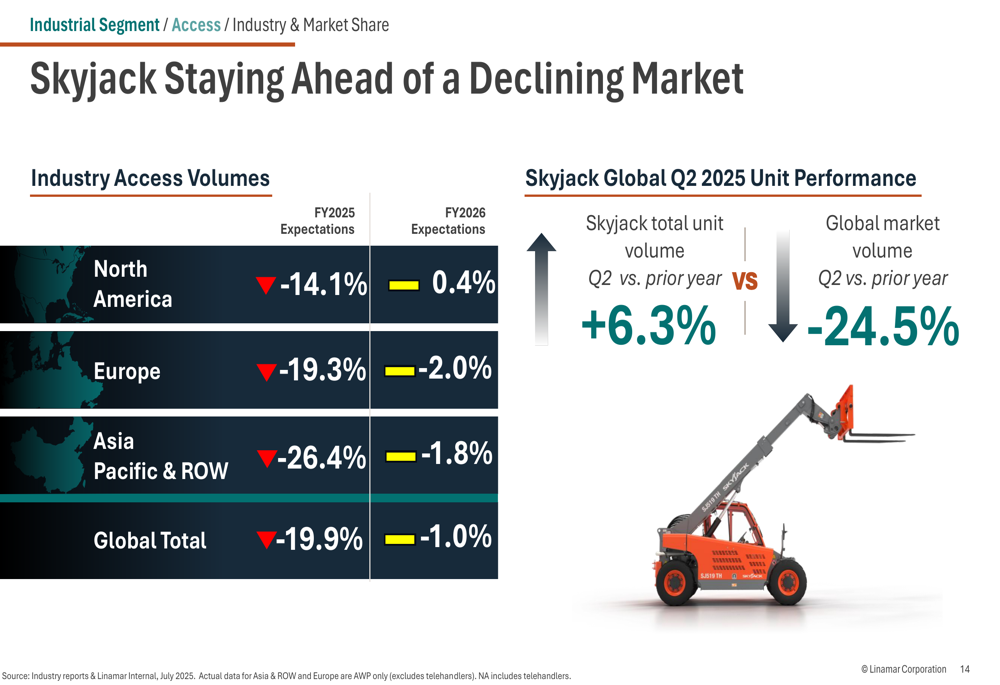
Despite these headwinds, Linamar outperformed the market in key industrial categories. The company’s Skyjack division achieved 6.3% unit volume growth against a global market decline of 24.5%, as shown in this comparative analysis:
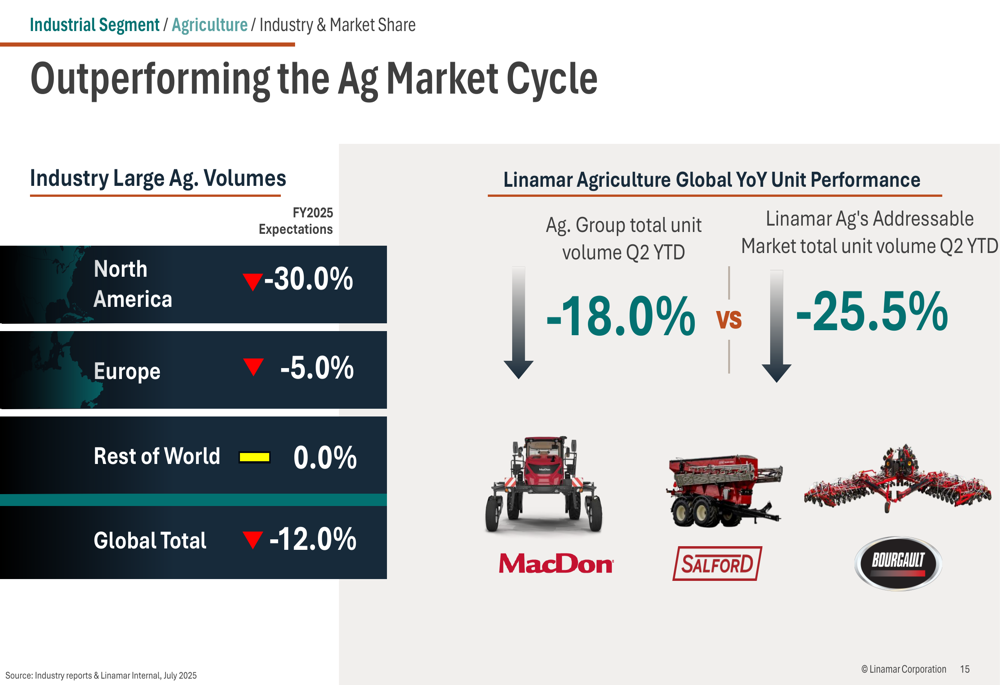
Similarly, Linamar’s agricultural business outperformed its addressable market, with unit volumes declining 18.0% compared to the market’s 25.5% drop:
Strategic Initiatives
A significant focus of Linamar’s presentation was its positioning regarding US tariffs. The company emphasized that it remains largely untouched by recent tariff measures due to its USMCA compliance and North American manufacturing footprint.
The following slide details Linamar’s tariff exposure across various categories:
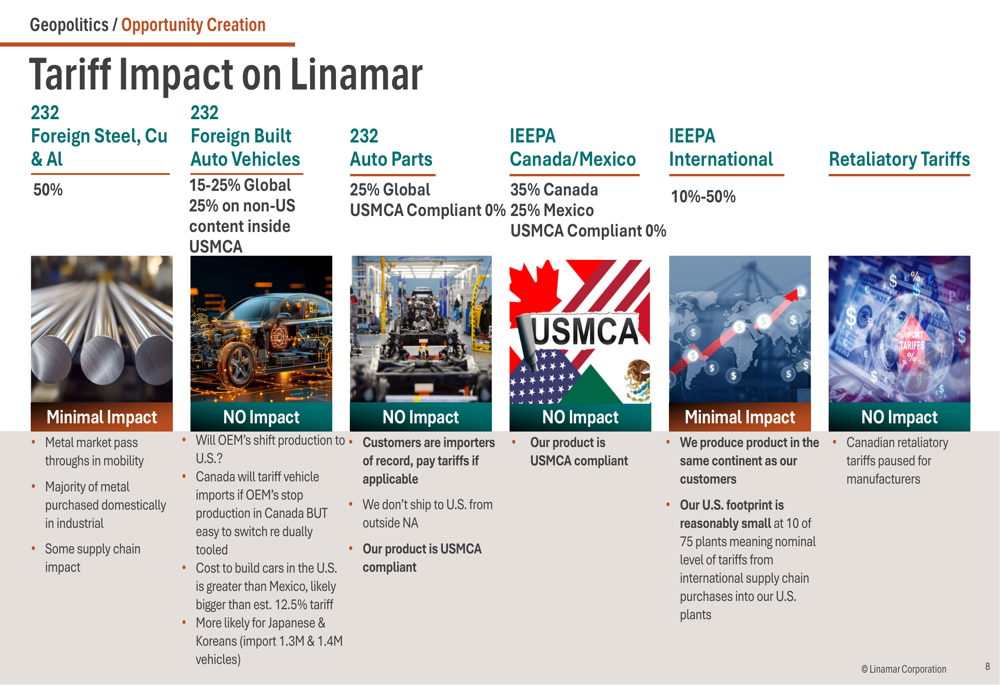
This advantageous position creates potential opportunities for Linamar, particularly in onshoring to USMCA-compliant suppliers and gaining market share as consumers potentially shift away from imported vehicles subject to tariffs.
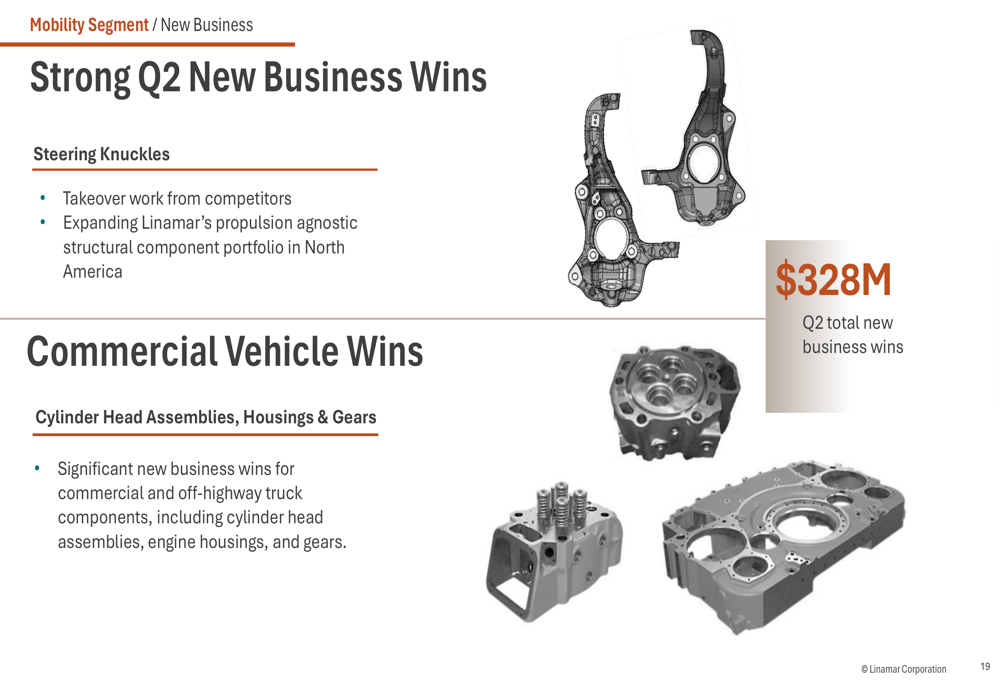
The company also highlighted strong new business wins totaling $328 million in Q2, including steering knuckles and commercial vehicle components:
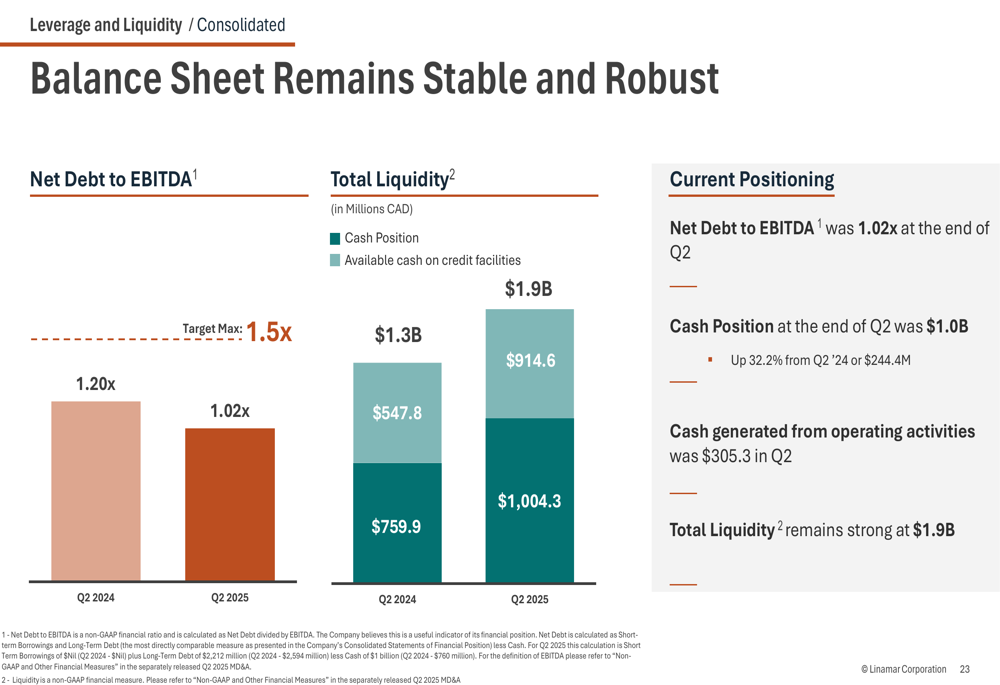
Linamar’s balance sheet remained robust with a net debt to EBITDA ratio of 1.02x, improved from 1.20x in Q2 2024. Total liquidity stood at $1.9 billion, with cash position reaching $1.0 billion, up 32.2% year-over-year:
The company continues to execute its share buyback program, having retired nearly 1.8 million shares and returning nearly $100 million to shareholders. This aligns with Linamar’s capital allocation strategy of ensuring optimal balance sheet levels while investing in innovation and growth.
Forward-Looking Statements
Looking ahead, Linamar provided a segmented outlook for fiscal years 2025 and 2026. For the Mobility segment, the company projects sales growth and strong double-digit normalized operating earnings growth in FY 2025, with modest growth expected in FY 2026.
The Industrial segment faces more significant challenges, with double-digit declines in both sales and normalized operating earnings projected for FY 2025, before returning to growth in FY 2026.
On a consolidated basis, Linamar expects modest sales decline in FY 2025 followed by modest growth in FY 2026, as shown in this outlook slide:
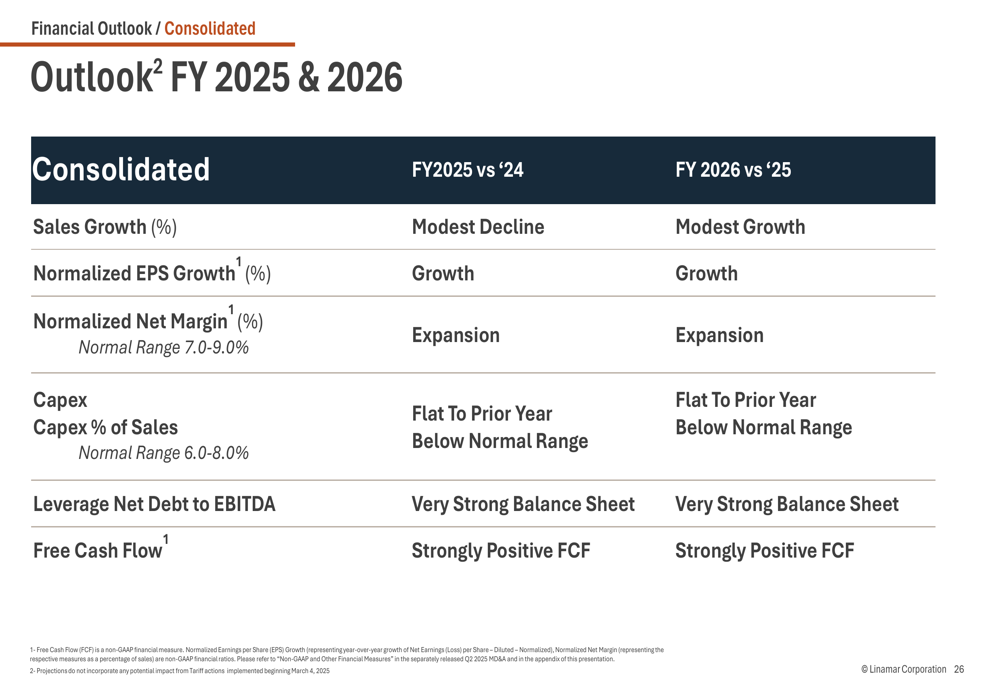
The company anticipates normalized EPS growth and margin expansion in both years, with free cash flow remaining strongly positive. Capital expenditures are expected to remain flat compared to the prior year and below the normal range.
Linamar’s balanced and diversified business model continues to be a key strength, with the Industrial segment focused on North America generating cash, while the Mobility segment drives global reach and capabilities:
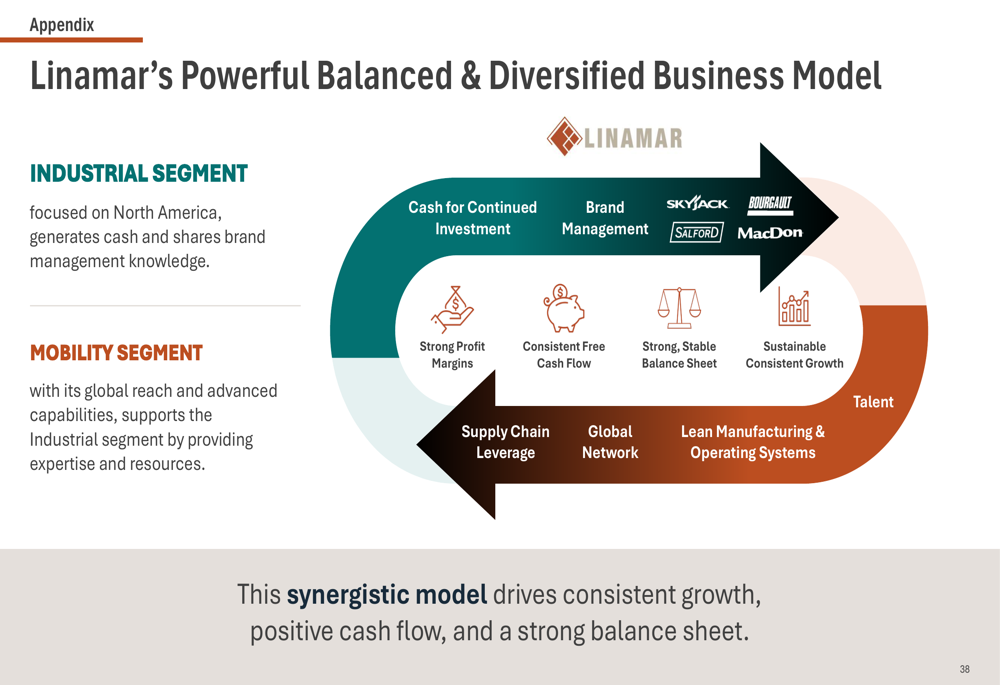
This strategic approach positions Linamar to navigate current market challenges while capitalizing on emerging opportunities, particularly those related to reshoring and USMCA compliance in an evolving tariff environment.
Full presentation:
This article was generated with the support of AI and reviewed by an editor. For more information see our T&C.