Bullish indicating open at $55-$60, IPO prices at $37

Live Oak Bancshares, Inc. (NASDAQ:NYSE:LOB) released its first quarter 2025 earnings presentation on April 24, 2025, revealing strong loan and deposit growth but declining profitability due to higher provision expenses. The stock fell 4.41% in aftermarket trading to $23.69, following a 0.72% decline during regular trading hours.
Quarterly Performance Highlights
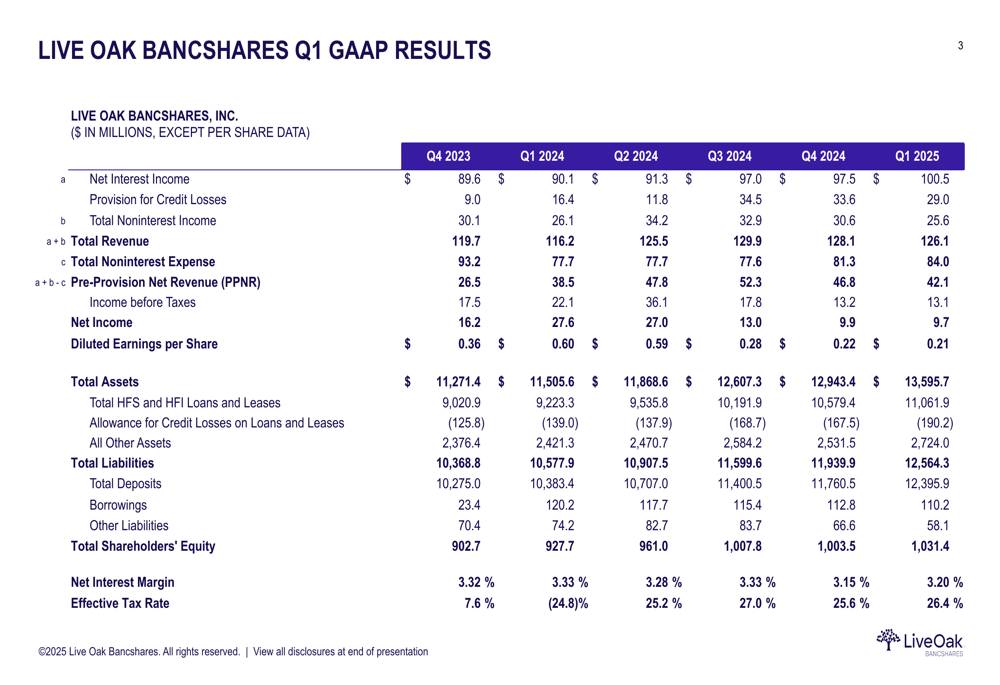
Live Oak reported diluted earnings per share of $0.21 for Q1 2025, down significantly from $0.60 in Q1 2024. Net income fell to $9.7 million from $27.6 million a year earlier, despite total revenue increasing to $126.1 million from $116.2 million.
The primary driver of the profit decline was a substantial increase in provision for credit losses, which rose to $29.2 million in Q1 2025 compared to $16.0 million in Q1 2024. This higher provision offset otherwise strong operational performance, including growth in net interest income and pre-provision net revenue (PPNR).
As shown in the following comprehensive results table, the bank maintained strong revenue growth while managing increased credit costs:
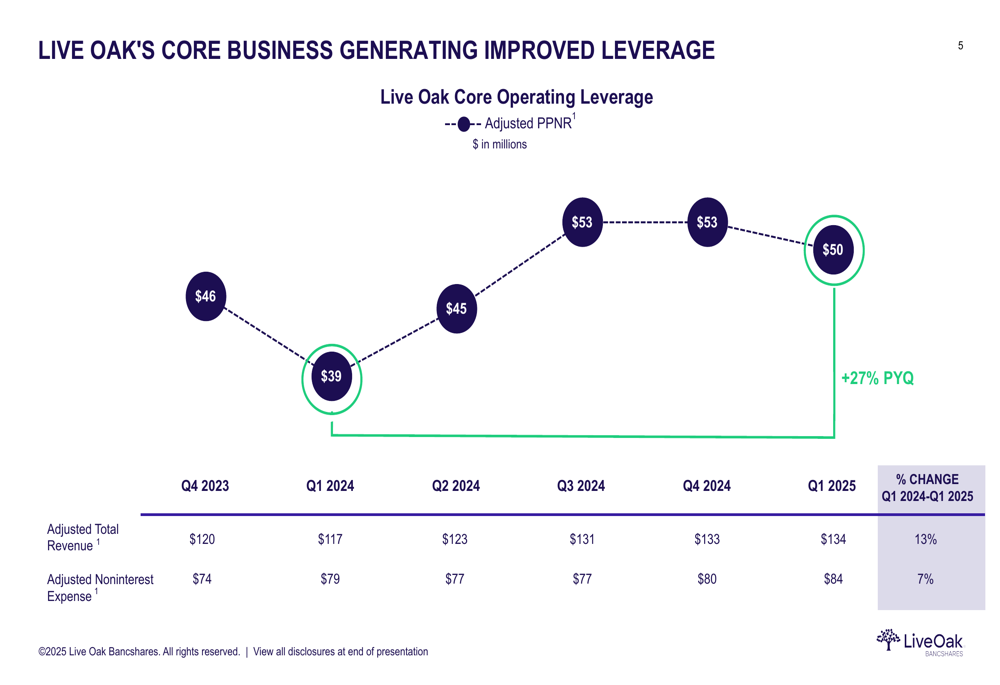
On an adjusted basis, the bank’s core business showed improved leverage with adjusted PPNR increasing 27% year-over-year to $50 million. This growth reflects the company’s ability to generate higher revenue while keeping expense growth more moderate.
The following chart illustrates the consistent improvement in adjusted PPNR over the past five quarters:
Loan Portfolio and Credit Quality
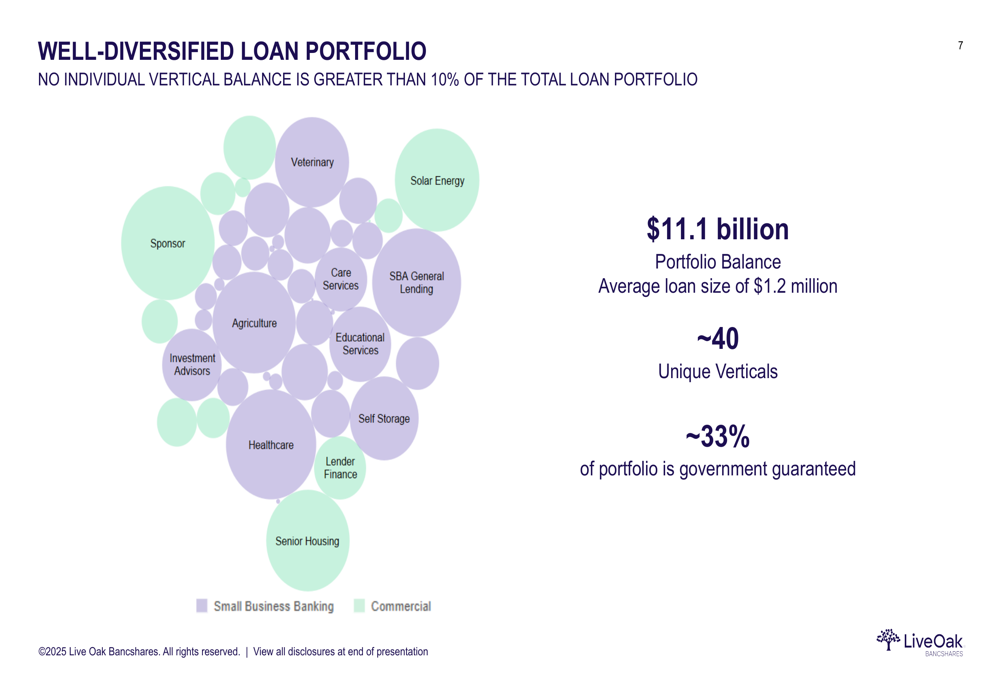
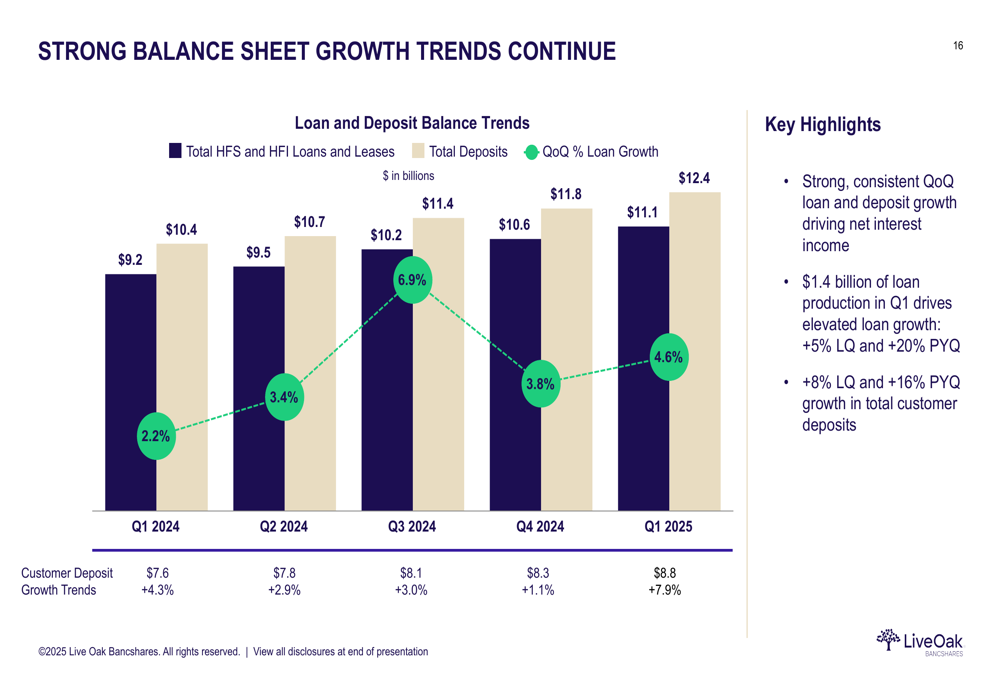
Live Oak continued its strong loan origination momentum, producing $1.4 billion in loans during Q1 2025. Total (EPA:TTEF) loans and leases increased to $11.1 billion, representing 5% quarter-over-quarter and 20% year-over-year growth.
The bank maintains a well-diversified loan portfolio spread across approximately 40 unique verticals, with no individual vertical exceeding 10% of the total portfolio. About 33% of the portfolio is government guaranteed, providing an additional layer of risk mitigation.
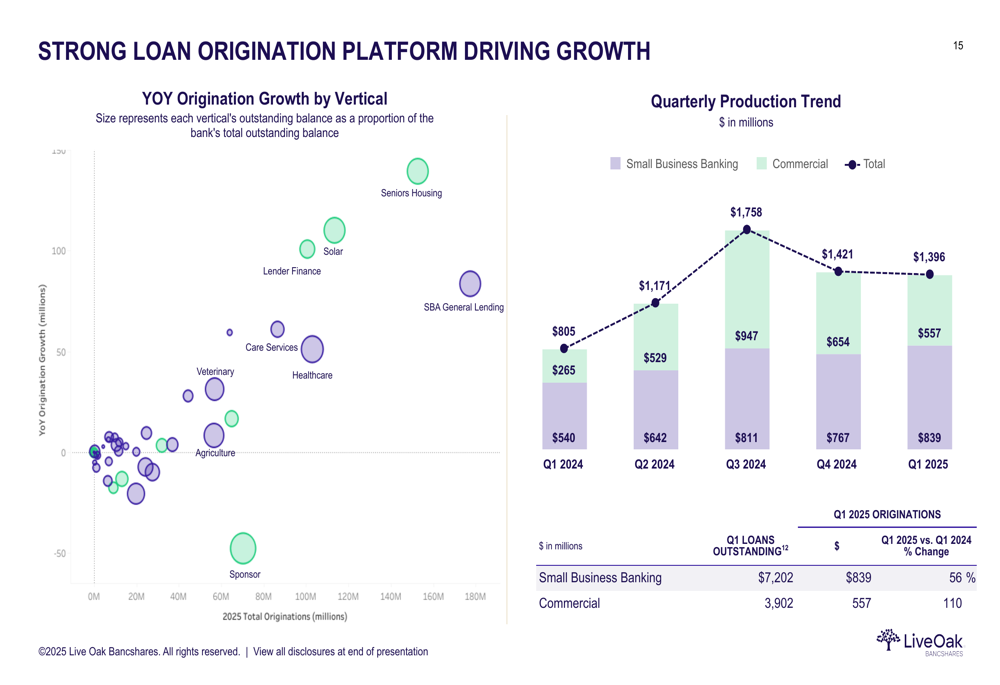
As illustrated in the following bubble chart, the loan portfolio is balanced between small business banking (65%) and commercial loans (35%):
While loan growth remained robust, the bank increased its provision for credit losses to $29 million in Q1 2025, down slightly from $34 million in Q4 2024 but significantly higher than the $16 million in Q1 2024. This elevated provision reflects both loan growth and macroeconomic factors.
The following chart shows the trend in provisions and charge-offs:
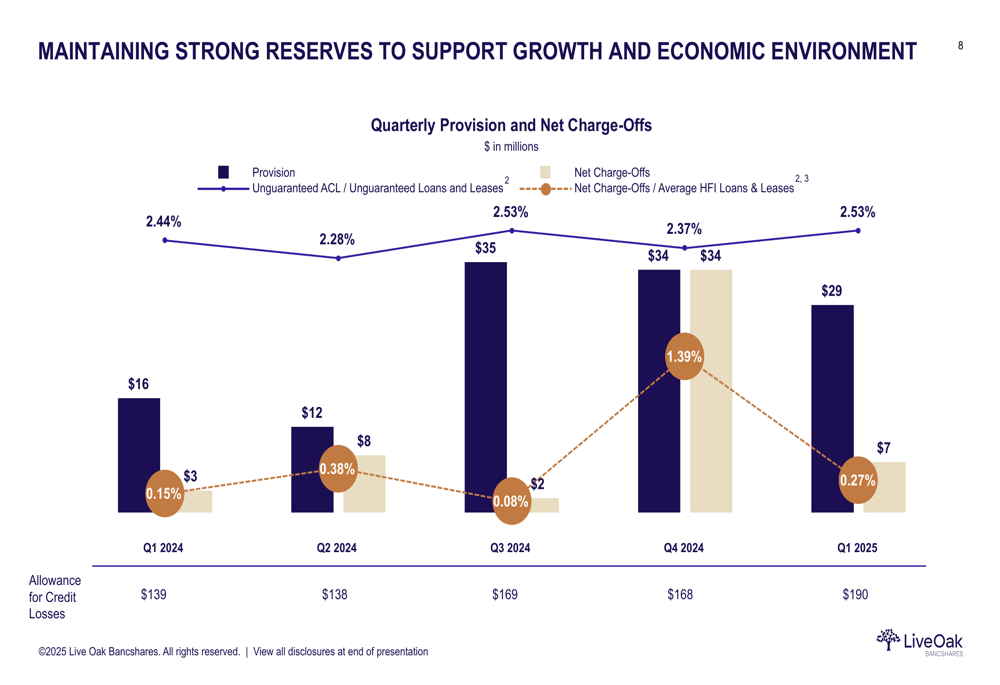
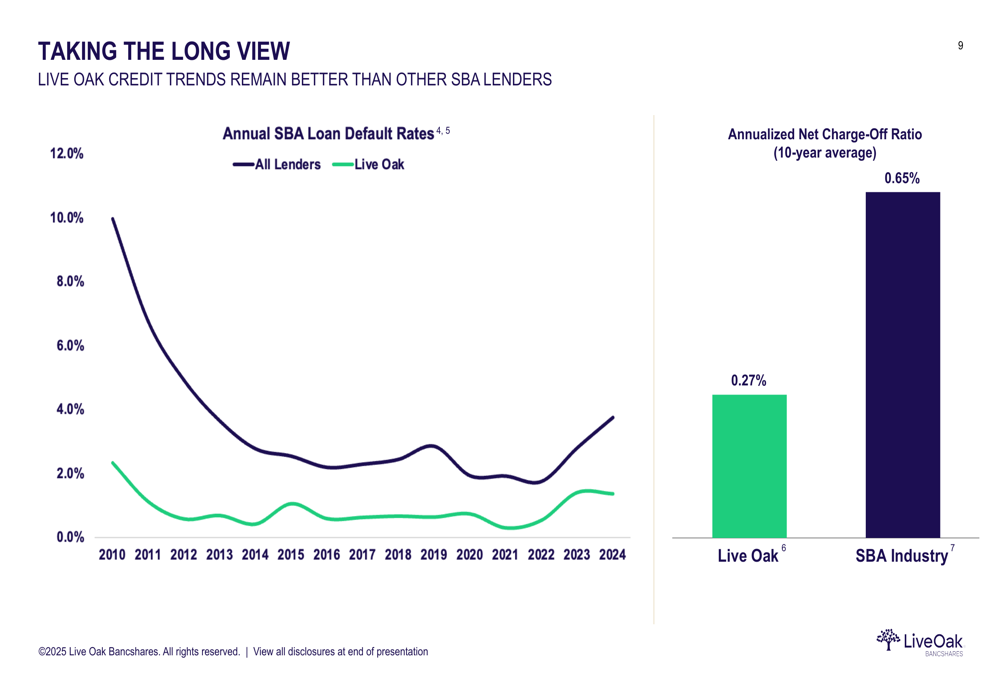
Despite the increased provisions, Live Oak’s credit performance remains better than industry averages. The bank’s annual SBA (LON:SBA) loan default rates have consistently tracked below the industry average, and its 10-year average net charge-off ratio of 0.27% compares favorably to the SBA industry average of 0.65%.
Deposit Growth and Checking Strategy
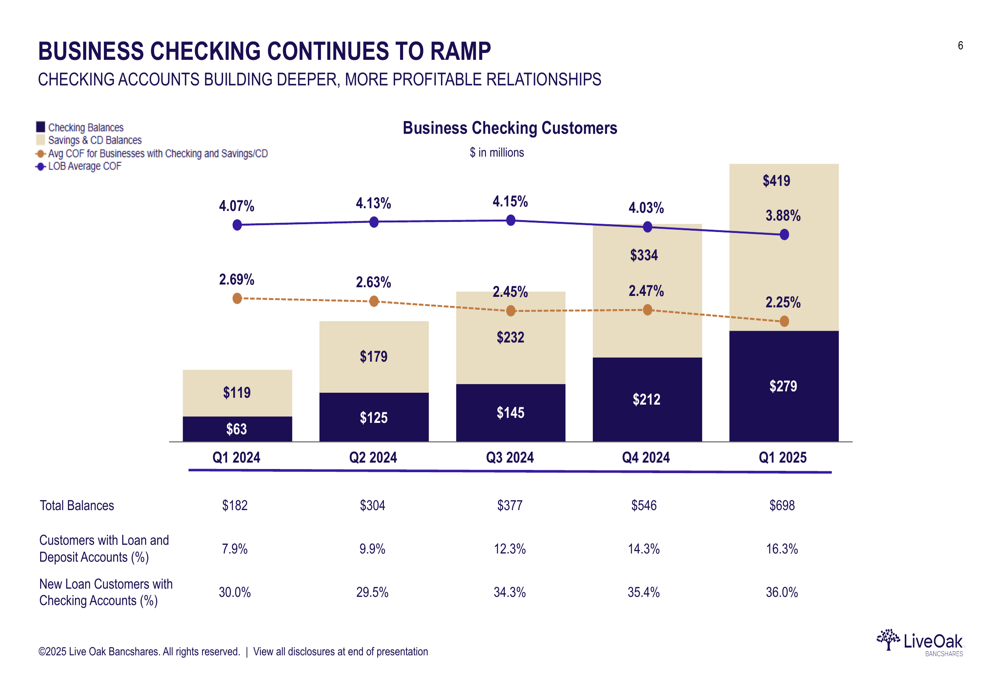
Live Oak reported strong deposit growth, with total customer deposits increasing 8% quarter-over-quarter and 16% year-over-year to $8.8 billion. The bank’s checking account strategy is gaining significant traction, with checking balances growing to $279 million, a 31% increase from the previous quarter and approximately four times higher than a year ago.
The growth in checking accounts is particularly strategic as it helps build deeper, more profitable customer relationships and reduces funding costs. As shown in the following chart, the percentage of customers with both loan and deposit accounts has more than doubled from 7.9% in Q1 2024 to 16.3% in Q1 2025:
The bank’s strong balance sheet growth trends continued across both loans and deposits:
Balance Sheet Strength and Capital Position
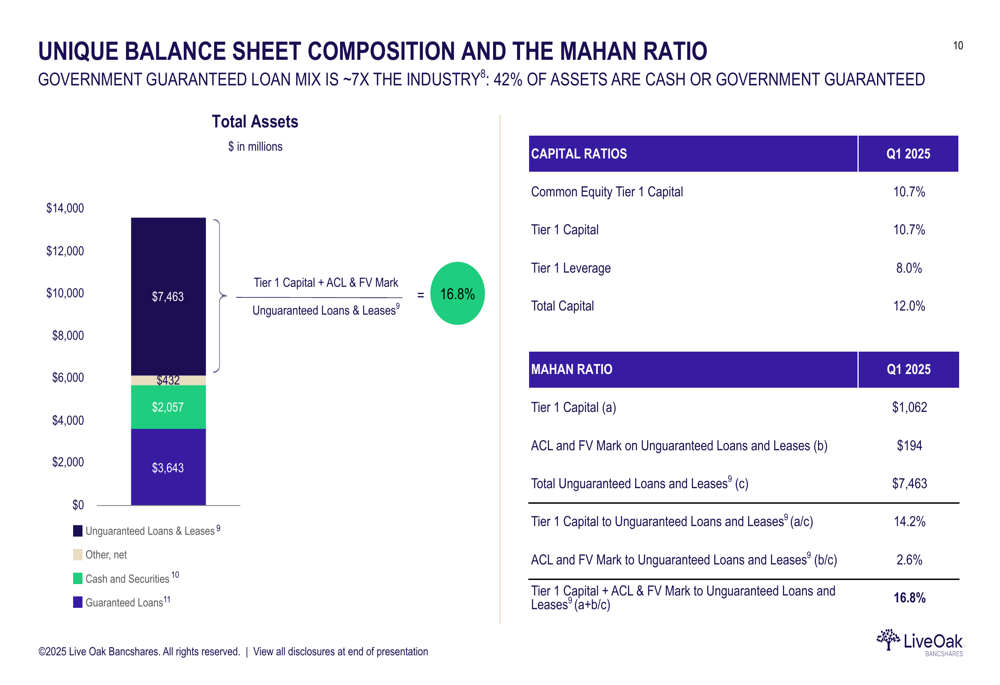
Live Oak maintains a unique balance sheet composition, with approximately 42% of assets in cash or government guaranteed loans. Government guaranteed loans make up about seven times the industry average, providing additional safety and flexibility.
The bank’s capital position remains strong with a Common Equity Tier 1 ratio of 10.7% and a total capital ratio of 12.0%. The "Mahan Ratio," which measures Tier 1 Capital plus allowance for credit losses to unguaranteed loans and leases, stands at a robust 16.8%.
As illustrated in the following chart, this unique balance sheet composition provides significant protection against potential credit losses:
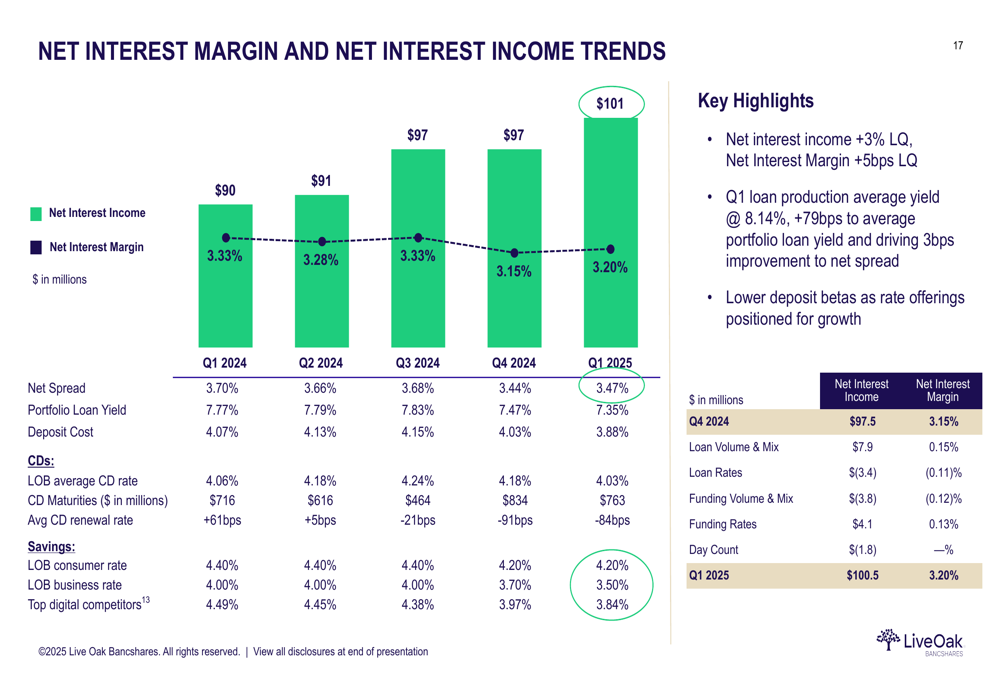
Net interest income continued to grow, reaching $101 million in Q1 2025, up 3% from the previous quarter and 12% from the same period last year. The net interest margin improved slightly to 3.20% from 3.15% in the previous quarter, though it remains below the 3.33% reported in Q1 2024.
Strategic Focus and Outlook
Looking ahead, Live Oak’s management emphasized their focus on controlling what they can control, building on strong growth momentum, continuing active credit portfolio management, supporting checking growth, and investing in infrastructure to support future expansion.
The bank’s loan origination platform continues to drive growth across both small business banking and commercial segments. Small business banking originations increased 56% year-over-year to $839 million in Q1 2025, while commercial originations grew 110% to $557 million.
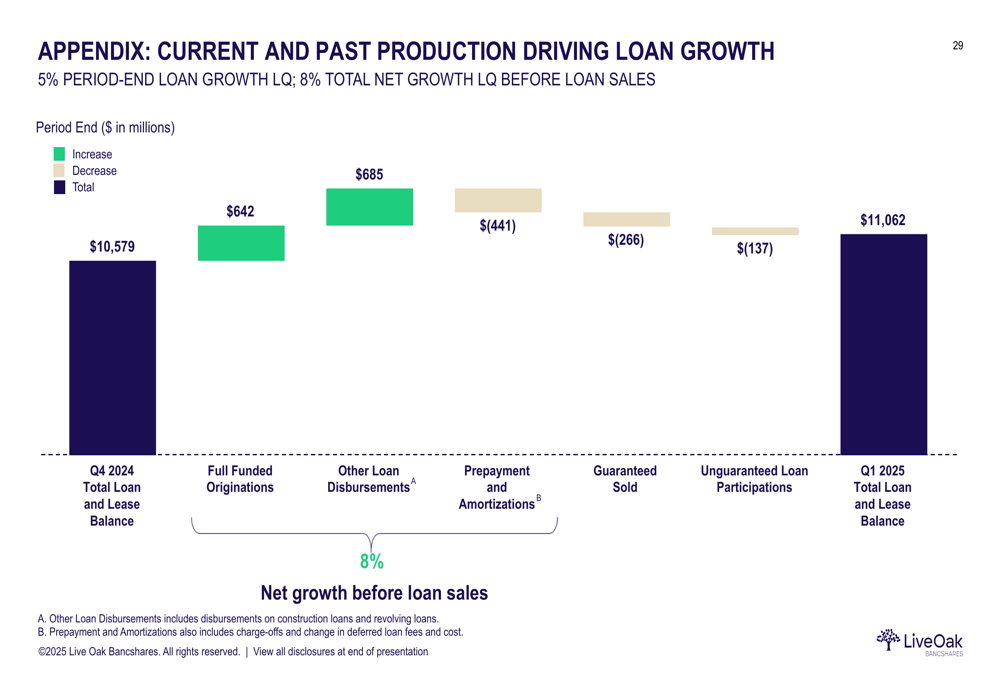
The composition of loan growth shows that new originations are more than offsetting prepayments and amortizations, even after accounting for loan sales:
Despite the strong operational performance, investors appear concerned about the elevated provision expenses and declining profitability, as reflected in the aftermarket stock price decline. The bank’s ability to manage credit quality while maintaining its growth trajectory will likely be a key focus for investors in the coming quarters.
Live Oak’s Q1 2025 results demonstrate the company’s continued success in growing its core banking business and diversifying its revenue streams, though increased credit costs are currently weighing on bottom-line results. The bank’s strategic investments in checking account growth and infrastructure position it for potential future profitability improvements if credit costs stabilize.
Full presentation:
This article was generated with the support of AI and reviewed by an editor. For more information see our T&C.