Fubotv earnings beat by $0.10, revenue topped estimates

Live Oak Bancshares (NASDAQ:NYSE:LOB) presented its second quarter 2025 earnings on July 24, 2025, revealing a substantial improvement in financial performance compared to the previous quarter. The company reported diluted earnings per share (EPS) of $0.51, more than doubling the $0.21 reported in Q1 2025, as credit concerns moderated and core business growth accelerated.
Quarterly Performance Highlights
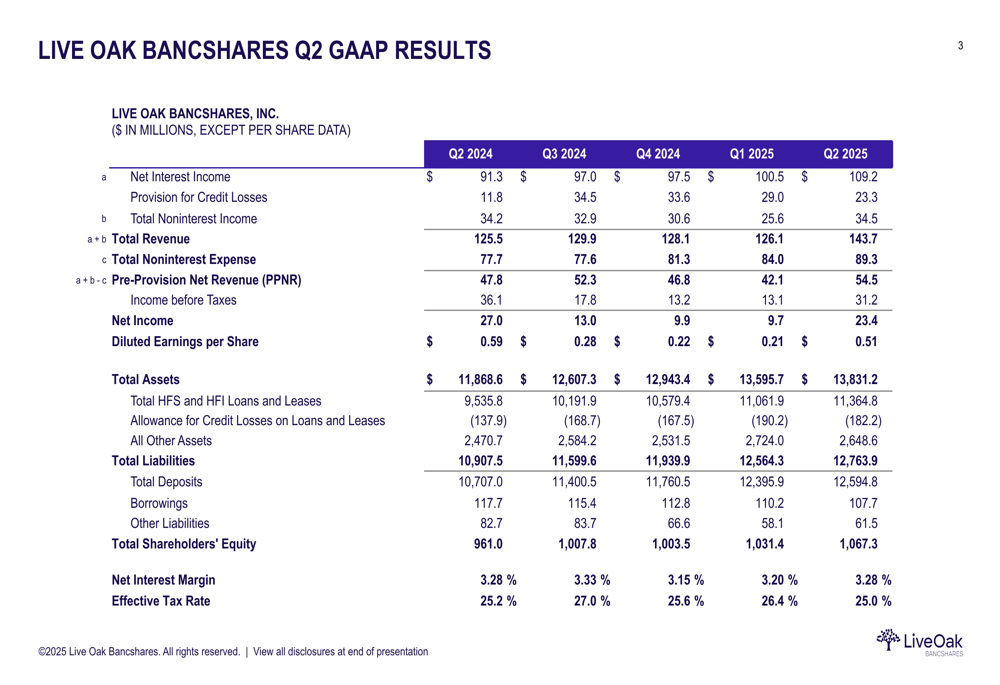
Live Oak demonstrated significant momentum across key financial metrics in Q2 2025. The bank reported total revenue of $143.7 million, up 14% from $126.1 million in Q1 2025. Net interest income reached $109.2 million, a 9% increase quarter-over-quarter and 20% year-over-year, while pre-provision net revenue (PPNR) jumped to $54.5 million, representing a 29% improvement from the previous quarter.
As shown in the following comprehensive financial results table, the company’s performance improved across multiple metrics:
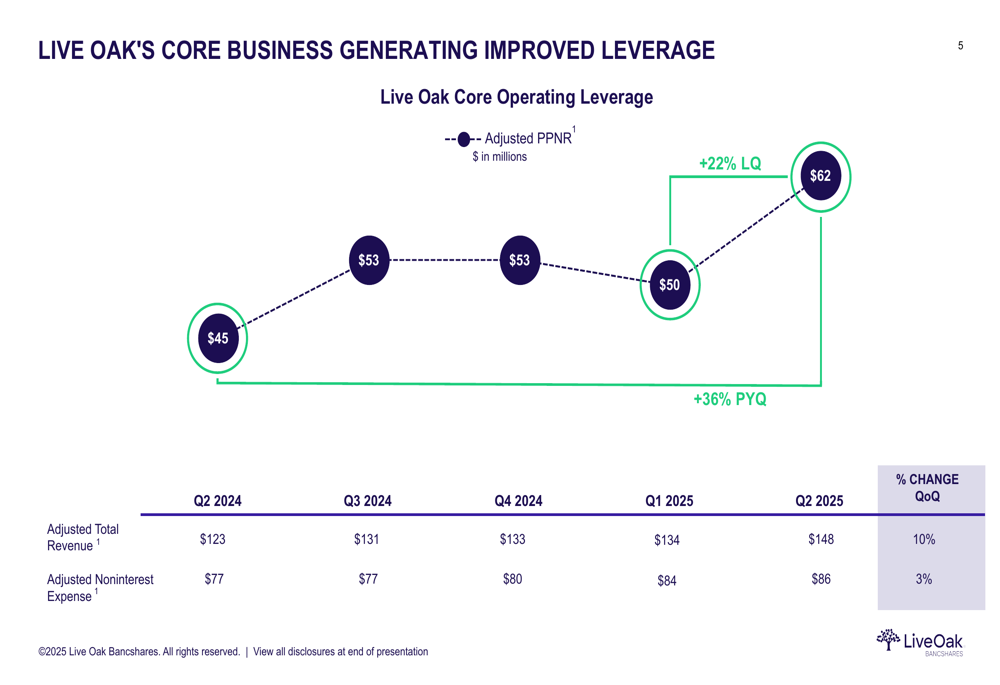
The bank’s adjusted PPNR, a key measure of core business performance, showed even stronger improvement, increasing by 22% quarter-over-quarter and 36% year-over-year to reach $62 million in Q2 2025. This metric highlights the company’s improving operational leverage as revenue growth outpaced expense growth.
The following chart illustrates this trend of improved leverage in the core business:
Detailed Financial Analysis
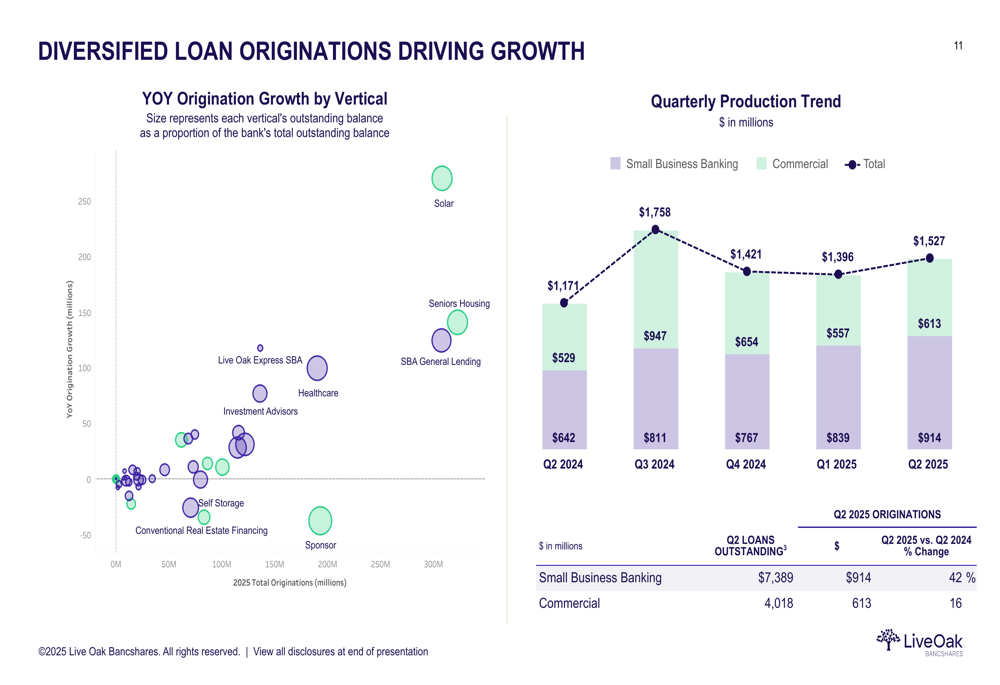
Live Oak’s loan production remained robust at $1.5 billion for the quarter, driving a 3% increase in loan balances quarter-over-quarter and 19% year-over-year. The bank’s diversified approach to lending continues to be a cornerstone of its strategy, with strong origination growth across multiple verticals.
The following visualization shows the diversification of loan originations across different business segments:
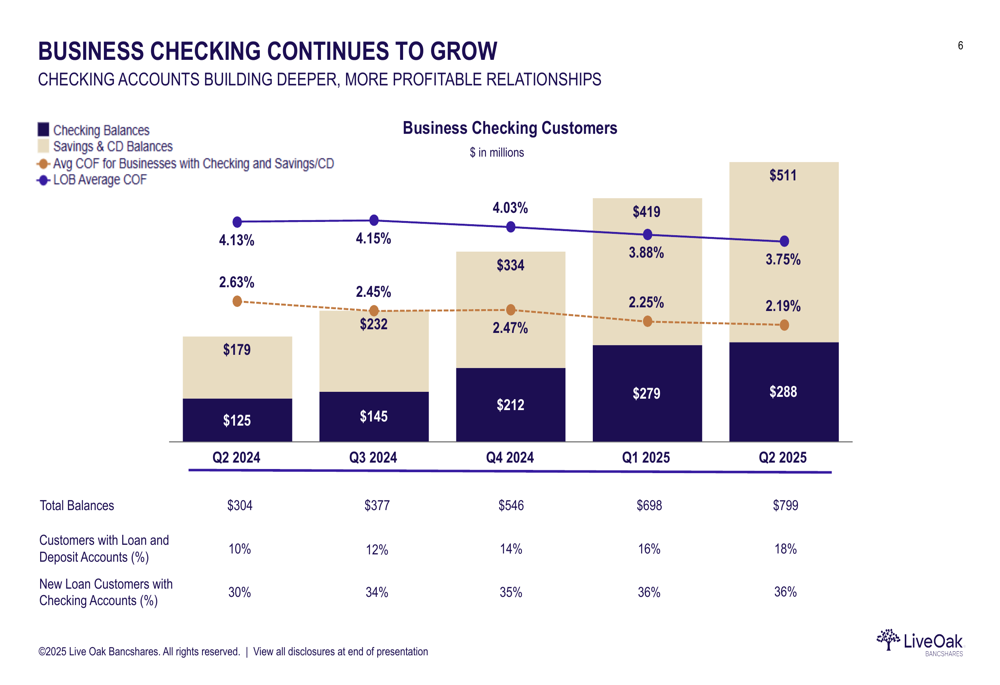
Deposit growth also remained strong, with total deposits reaching $12.6 billion, up from $12.4 billion in Q1 2025. Customer deposits grew by 6% quarter-over-quarter and 20% year-over-year. Particularly noteworthy is the continued expansion of business checking accounts, which reached $288 million in Q2 2025, representing a 3% increase from the previous quarter and approximately 2.3 times the level from the same period last year.
The following chart demonstrates the consistent growth in business checking accounts and related balances:
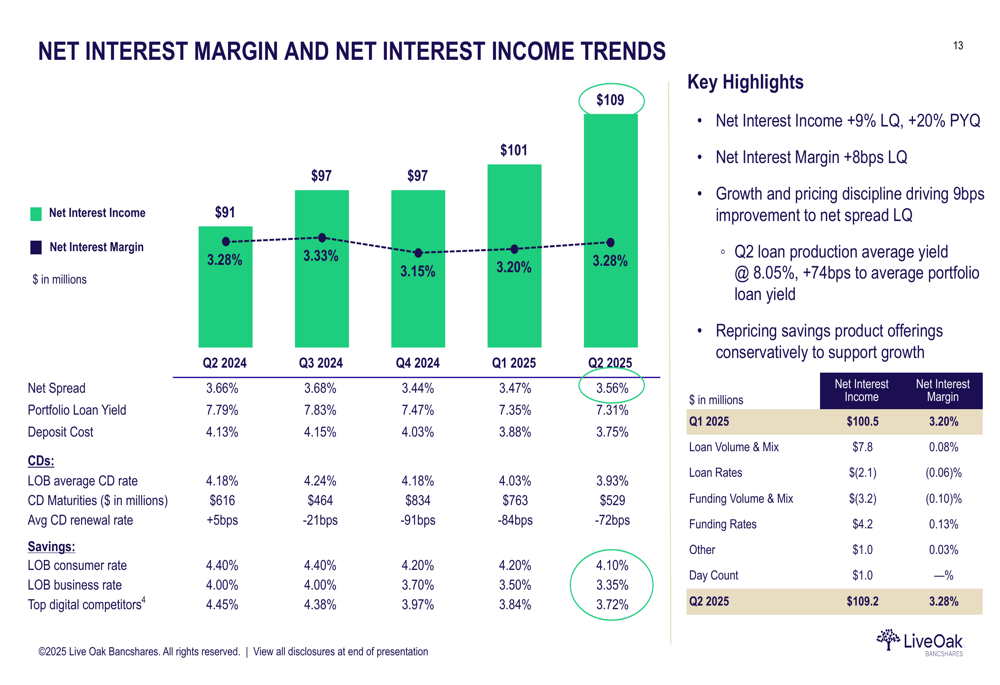
Net interest margin (NIM) improved to 3.28% in Q2 2025, up from 3.20% in the previous quarter. This improvement was driven by disciplined loan pricing and the positive impact of higher-yielding new loan production, which averaged 8.05% in yield, 74 basis points higher than the average portfolio loan yield.
The following chart shows the positive trends in net interest income and margin:
Credit Quality and Risk Management
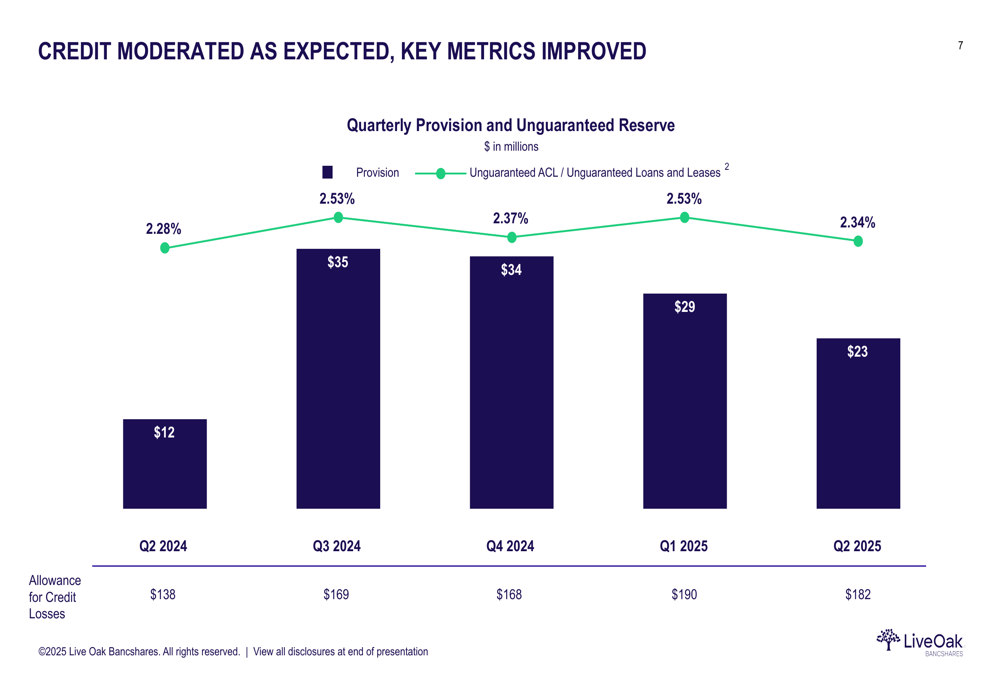
One of the most significant improvements in Q2 2025 was the moderation in credit metrics. The provision for credit losses decreased to $23.3 million, down 20% from $29.0 million in Q1 2025. The unguaranteed allowance for credit losses to unguaranteed loans and leases ratio stood at 2.34%, down from 2.53% in the previous quarter, indicating improved credit quality expectations.
The following chart illustrates the moderating trend in credit provisions:
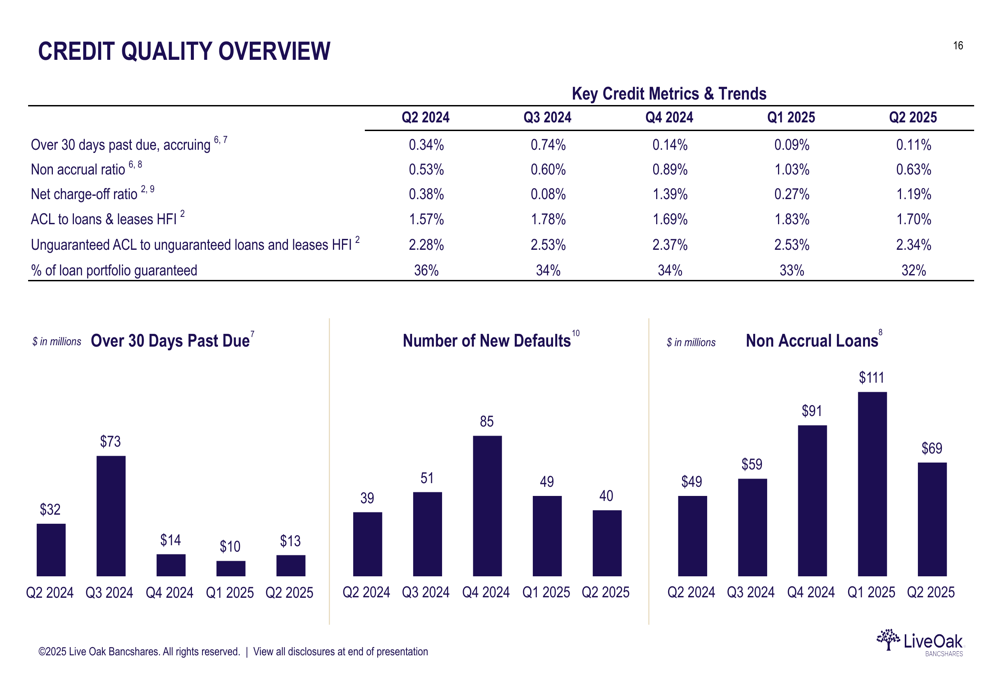
Non-accrual loans decreased significantly to $69 million (0.63% of total loans) in Q2 2025, down from $111 million (1.03%) in Q1 2025. Net charge-offs were 1.19% for the quarter, higher than the 0.27% in Q1 2025 but representing the bank’s proactive approach to managing problem credits.
The following detailed credit quality metrics provide further insight into the improving credit trends:
Strategic Initiatives and Forward Outlook
Live Oak continues to focus on three strategic priorities: building momentum in its core business, seizing new growth opportunities, and modernizing its operations with new innovations. The bank’s unique balance sheet composition, with a significant portion of government-guaranteed loans, provides a distinctive risk profile compared to peers.
The company’s tangible book value per share increased by 3% quarter-over-quarter and 9% year-over-year, reflecting the improved profitability and strategic execution. Capital ratios remain strong, with a Common Equity Tier 1 ratio of 10.7% and a total capital ratio of 11.9%.
The Q2 2025 results represent a significant improvement from Q1 2025, when the company missed analyst expectations with an EPS of $0.21 against a forecast of $0.38. The market appears to have anticipated this recovery, as Live Oak’s stock rose 7.51% following the Q1 earnings release despite the miss, suggesting investor confidence in the company’s trajectory.
Management’s focus on disciplined growth, credit quality improvement, and deposit diversification appears to be yielding positive results, positioning the bank well for continued performance improvement in the coming quarters.
Full presentation:
This article was generated with the support of AI and reviewed by an editor. For more information see our T&C.