AirNet Technology raises $180 million in digital assets offering

Introduction & Market Context
MarineMax Inc . (NYSE:HZO) presented its third-quarter fiscal year 2025 results on July 24, revealing significant challenges despite its ongoing diversification strategy. The recreational marine retailer reported a 9% year-over-year revenue decline and a substantial net loss, primarily due to a goodwill impairment charge, prompting the company to revise its full-year guidance.
The results come amid a challenging period for the recreational boating industry, with MarineMax’s stock trading at $27.32 as of July 23, 2025, representing a 2.25% increase on the day but still well below its 52-week high of $38.20.
Quarterly Performance Highlights
MarineMax reported Q3 FY 2025 revenue of $657.2 million, down 9% from $757.7 million in the same period last year. The company’s gross margin contracted to 30.4% from 32.0% in Q3 FY 2024, primarily due to lower margins on boat sales.
Most notably, the company recorded a net loss attributable to MarineMax of $52.1 million, compared to net income of $31.6 million in the prior-year period. This loss included a significant non-cash goodwill impairment charge of $69.1 million.
As shown in the following financial performance summary:
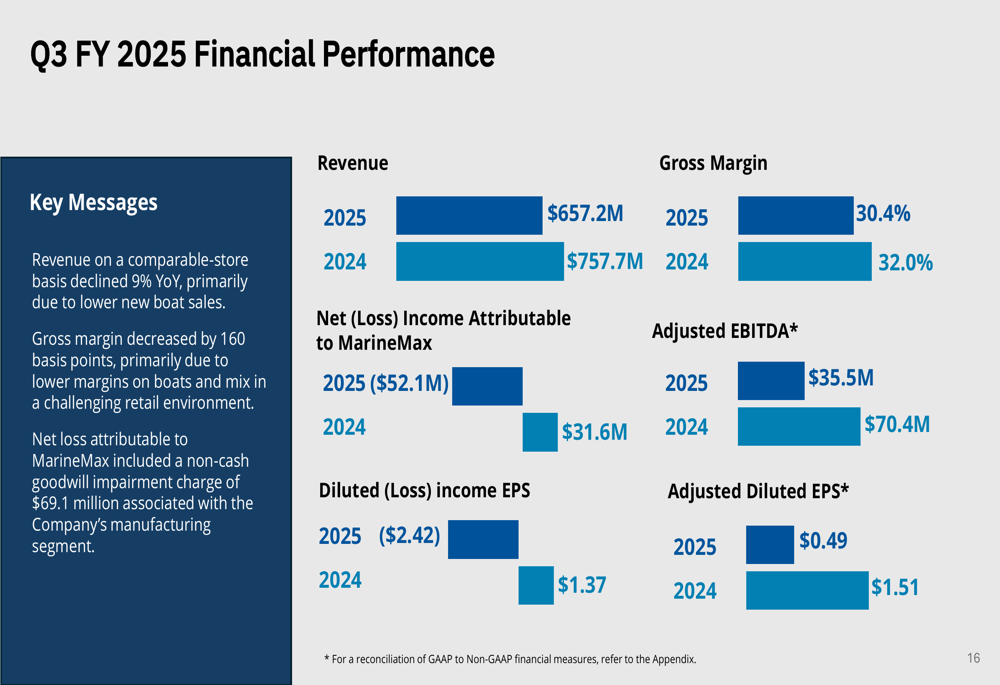
On an adjusted basis, which excludes the impairment charge and other items, MarineMax reported adjusted EBITDA of $35.5 million, down from $70.4 million in Q3 FY 2024. Adjusted diluted earnings per share came in at $0.49, compared to $1.51 in the same quarter last year.
This performance marks a significant shift from the company’s Q2 2025 results, when MarineMax exceeded expectations with adjusted EPS of $0.23 against a forecast of $0.17, and revenue of $631.5 million versus an anticipated $580.11 million.
Strategic Initiatives
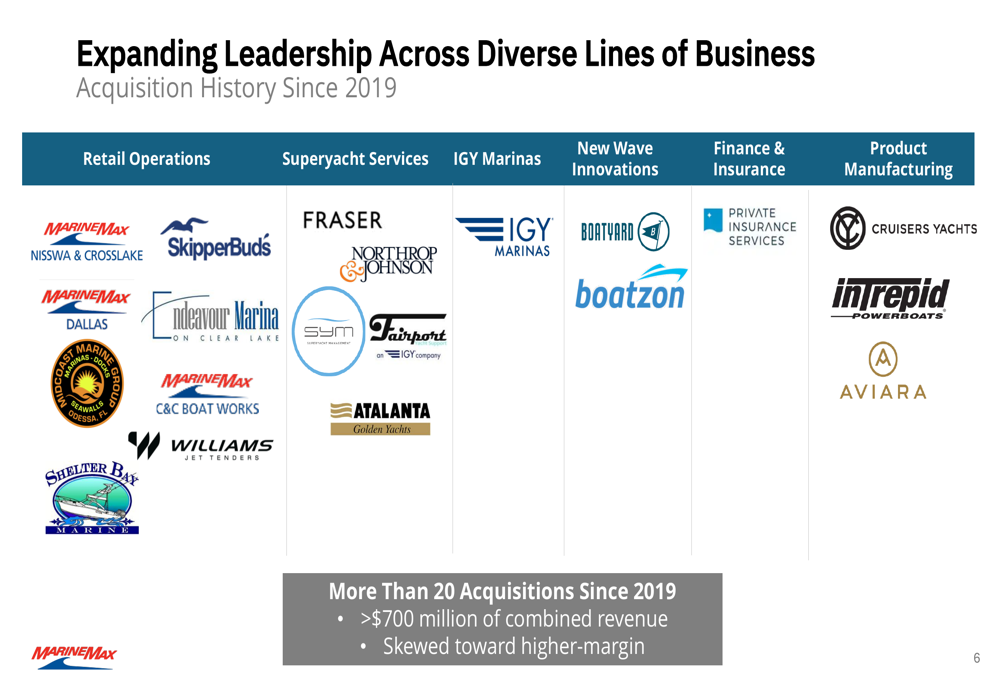
Despite current challenges, MarineMax continues to emphasize its long-term strategic vision of becoming the premier global leader in boating and yachting. The company has been actively expanding its footprint through acquisitions, having completed more than 20 deals since 2019 that added approximately $700 million in combined revenue, with a focus on higher-margin businesses.
The company’s acquisition strategy has diversified its revenue streams across multiple business segments, as illustrated in this comprehensive overview:
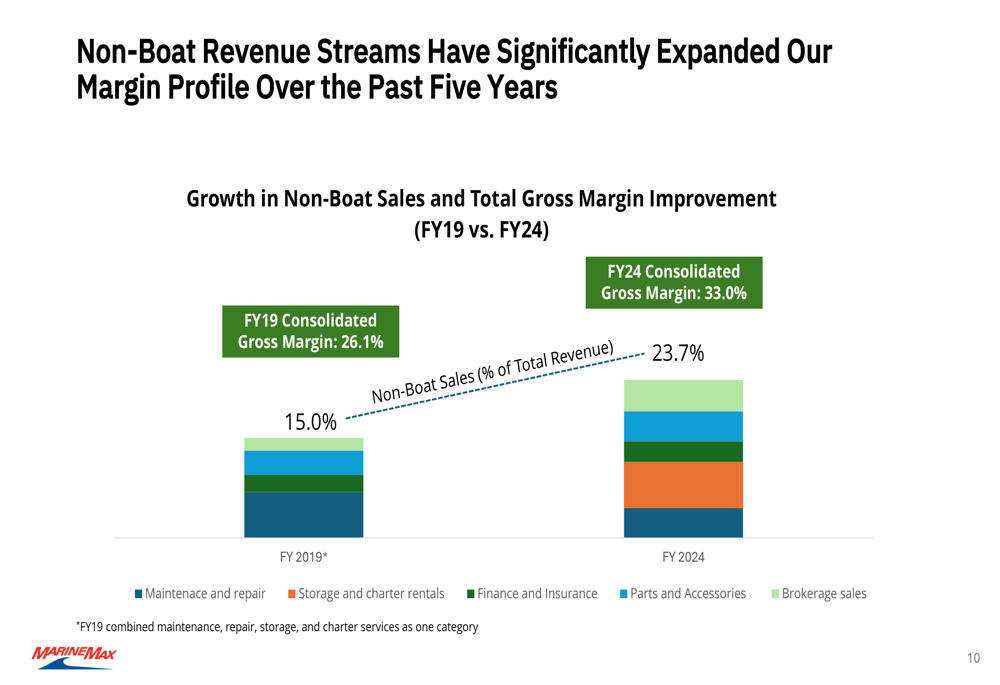
This diversification has helped MarineMax expand its non-boat revenue streams from 15% of total revenue in FY 2019 to 23.7% in FY 2024, contributing to an improvement in consolidated gross margin from 26.1% to 33.0% over the same period, as shown in the following chart:
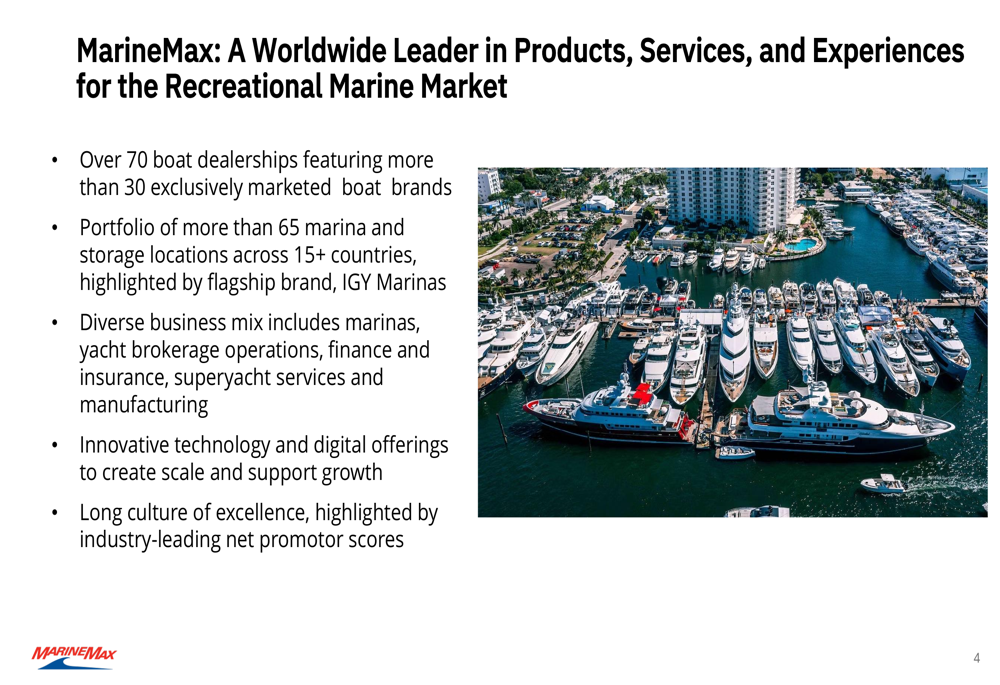
MarineMax continues to position itself as a leader in the recreational marine market with over 70 boat dealerships featuring more than 30 exclusively marketed boat brands, and a portfolio of more than 65 marina and storage locations across 15+ countries. The company’s diverse business mix now includes marinas, yacht brokerage operations, finance and insurance, superyacht services, and manufacturing.
Detailed Financial Analysis
MarineMax’s balance sheet as of June 30, 2025, showed $151.0 million in cash and cash equivalents, down from $242.4 million a year earlier. The company attributed this decline to the timing of payments and reduced profits. Inventories increased to $906.2 million from $880.4 million in the prior year, which the company expects to normalize through the summer season.
The company’s net leverage ratio increased to 2.0x from 1.1x in the prior year, reflecting the challenging operating environment. Despite these pressures, MarineMax maintained a current ratio of 1.21x, slightly up from 1.20x a year ago.
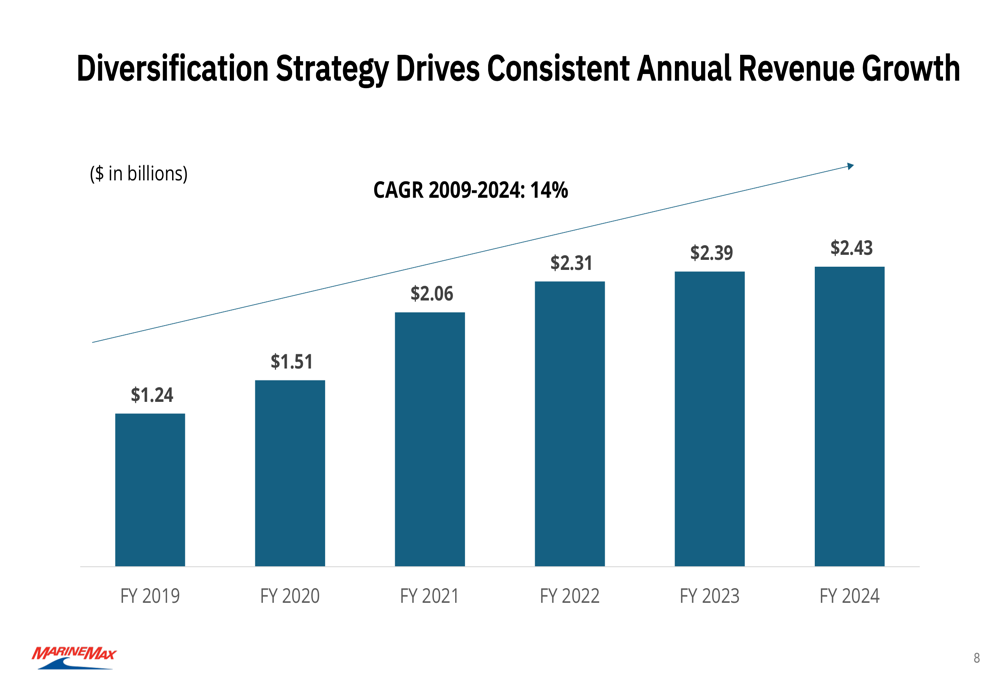
Looking at the company’s longer-term performance, MarineMax has achieved consistent annual revenue growth from FY 2019 through FY 2024, with a compound annual growth rate (CAGR) of 14% during this period:
Forward-Looking Statements
In light of the challenging Q3 results, MarineMax has updated its full-year FY 2025 guidance. The company now expects adjusted EBITDA in the range of $105 million to $120 million and adjusted earnings per share in the range of $0.45 to $0.95 per diluted share.
This represents a reduction from the guidance provided after Q2 2025, when the company projected adjusted net income between $1.40 and $2.40 per diluted share and adjusted EBITDA between $140 million and $170 million.
Despite the near-term challenges, MarineMax outlined its strategy for unlocking additional value-creation potential, which rests on three pillars: leveraging strengths and innovation to accelerate profitable growth, expanding footprint via prudent M&A, and driving more efficient operations.
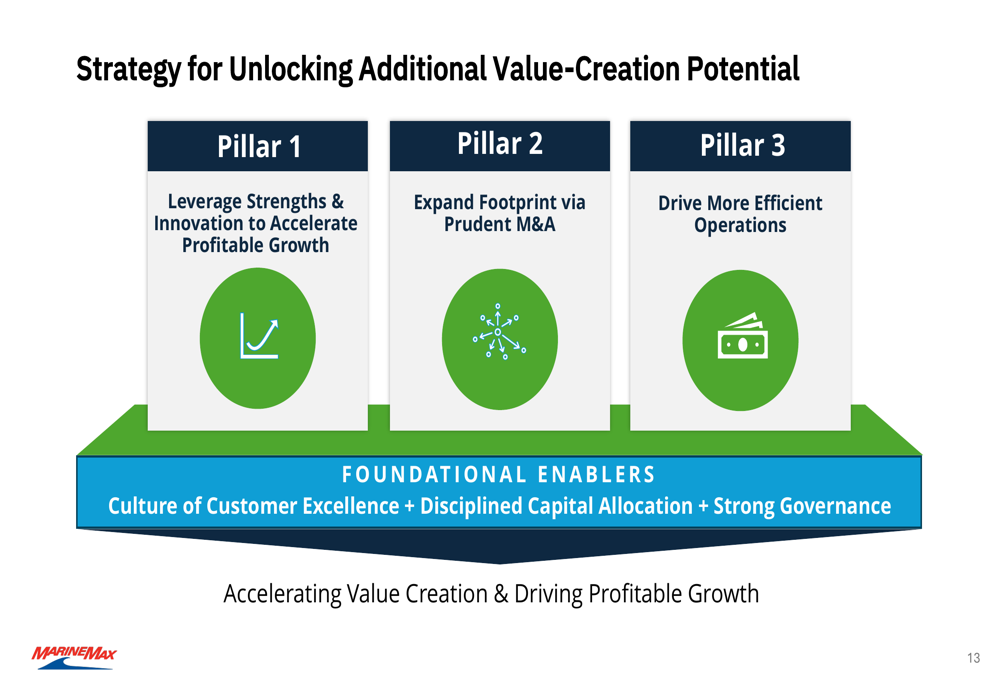
The company emphasized its capital allocation priorities, which include investing in growth opportunities, pursuing strategic acquisitions, capital expenditures for facilities and technology strategies, opportunistic share repurchases, and maintaining a strong balance sheet.
MarineMax’s management remains focused on its long-term strategic plan despite the current headwinds, continuing to emphasize premium brands, digital innovation, and operational efficiency as key drivers for future growth once market conditions improve.
Full presentation:
This article was generated with the support of AI and reviewed by an editor. For more information see our T&C.