Street Calls of the Week

Introduction & Market Context
MasterBrand Inc. (NYSE:MBC) presented its Q2 2025 investor results on August 6, 2025, revealing mixed performance with revenue growth offset by margin pressure. The stock responded positively, trading up 7.33% at market open following the presentation, with premarket activity showing an additional 3.62% gain.
As North America’s leading residential cabinet manufacturer, MasterBrand continues to navigate a challenging housing market while advancing its planned strategic merger with American Woodmark (NASDAQ:AMWD). The presentation highlighted both quarterly results and long-term strategic initiatives aimed at maintaining market leadership.
Quarterly Performance Highlights
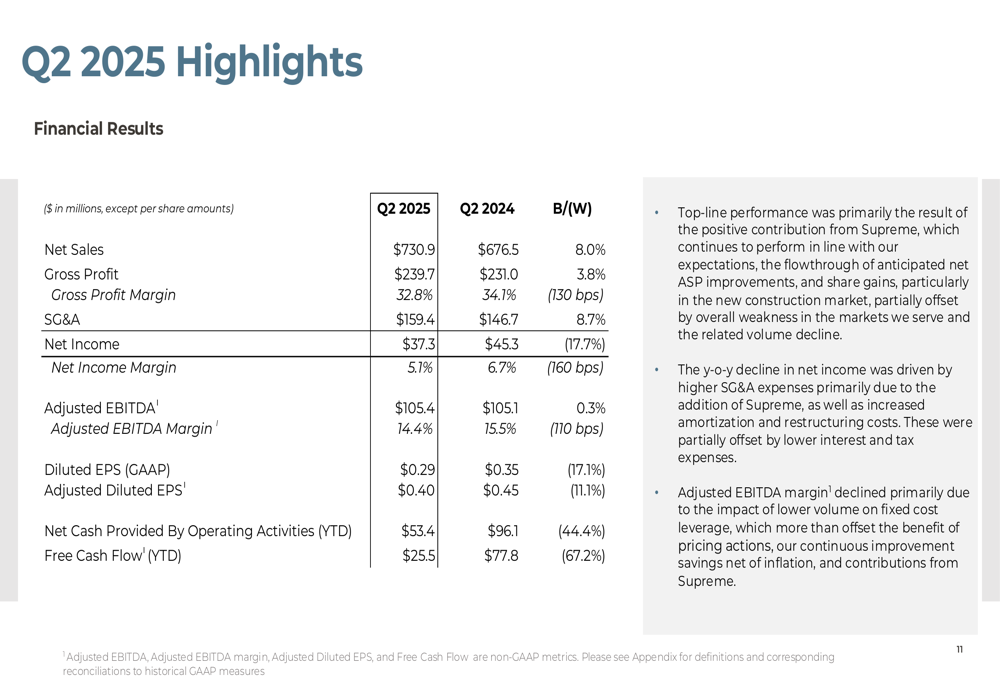
MasterBrand reported Q2 2025 net sales of $730.9 million, an 8% increase from $676.5 million in Q2 2024. However, profitability metrics showed pressure, with net income declining to $37.3 million from $45.3 million year-over-year, and net income margin falling to 5.1% from 6.7%.
The company’s adjusted EBITDA remained relatively flat at $105.4 million compared to $105.1 million in the prior year, though adjusted EBITDA margin contracted to 14.4% from 15.5%. Diluted EPS decreased to $0.29 from $0.35, while adjusted diluted EPS fell to $0.40 from $0.45.
As shown in the following financial results summary:
The Q2 performance represents a significant improvement from Q1 2025, when the company reported an EPS of $0.18, missing analyst expectations of $0.28. The sequential improvement suggests the company’s cost-saving initiatives may be gaining traction despite ongoing market challenges.
Strategic Initiatives
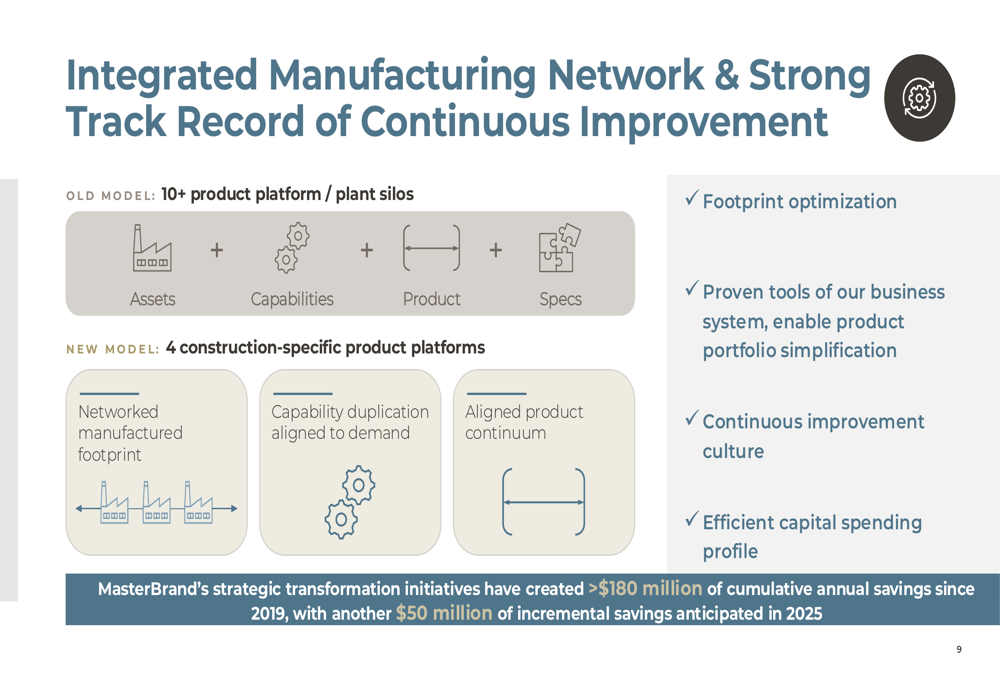
MasterBrand’s presentation emphasized its strategic transformation, which has reportedly generated over $180 million in cumulative annual savings since 2019. The company highlighted its shift from siloed manufacturing to an integrated network with four construction-specific product platforms.
As illustrated in the following operational model comparison:
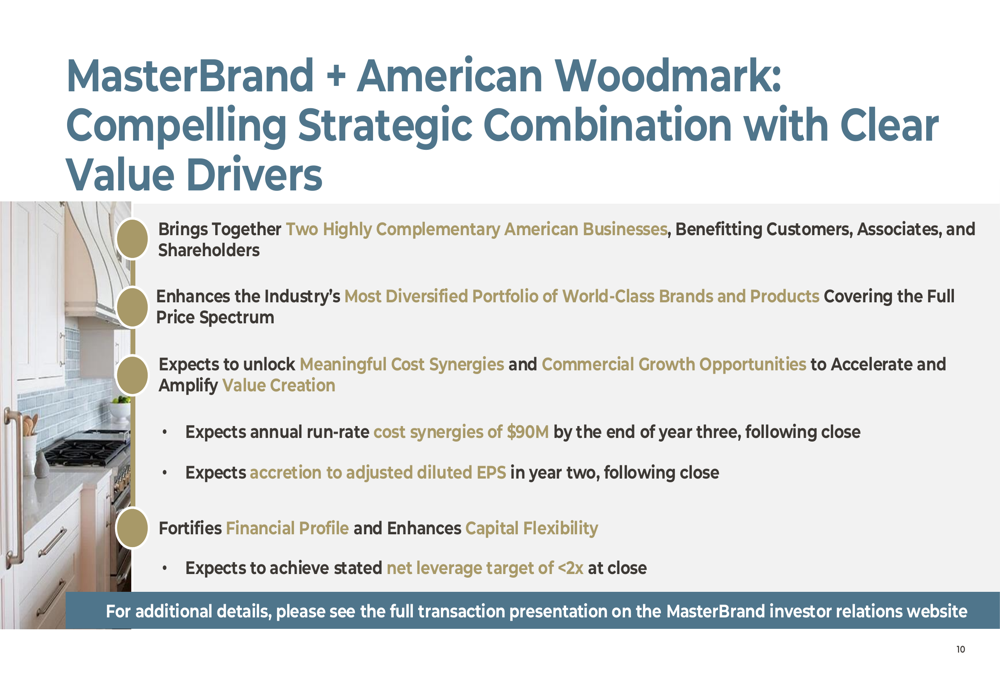
The most significant strategic development is MasterBrand’s planned merger with American Woodmark. The combination aims to create a more diversified portfolio of brands while unlocking substantial synergies.
The company projects annual run-rate cost synergies of $90 million by the end of the third year following the transaction close, with EPS accretion expected in the second year. The merger is positioned as a combination of complementary businesses that will enhance competitive positioning across price points.
The strategic benefits of the merger are outlined in this summary:
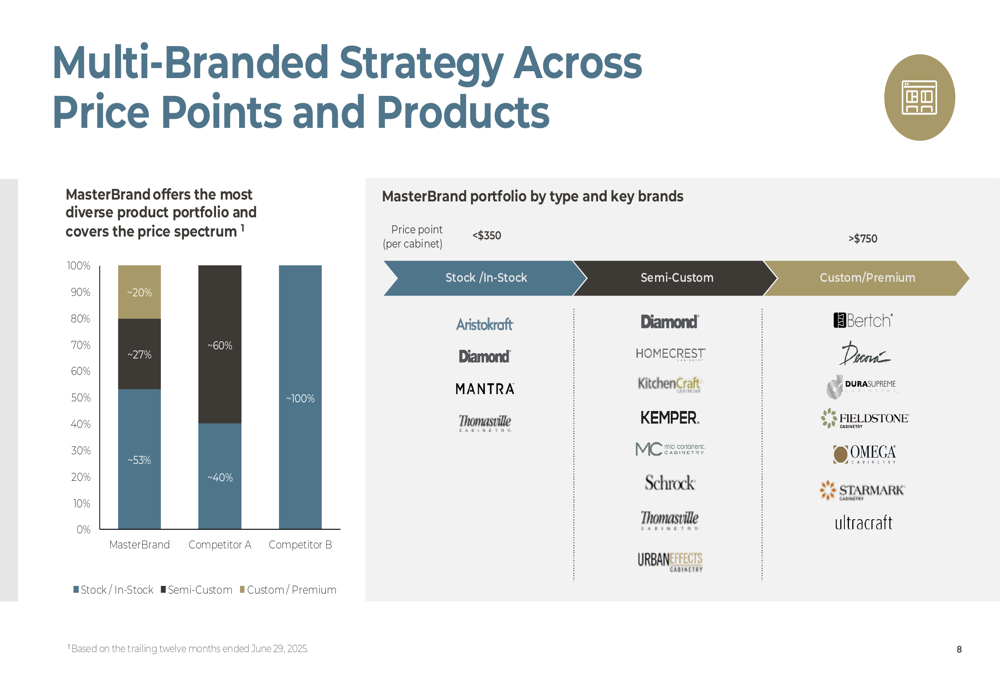
MasterBrand’s multi-branded strategy spans the full price spectrum, with approximately 70% of products in the stock/in-stock category, 27% in semi-custom, and 3% in custom/premium segments. This comprehensive market coverage is expected to be further enhanced through the American Woodmark merger.
The strategic rationale for the merger is presented here:
Forward-Looking Statements
MasterBrand provided a cautious outlook for the remainder of 2025, projecting a low single-digit percentage decline in net sales for the full year. The company expects adjusted EBITDA between $315-$365 million and adjusted EBITDA margin of approximately 12.0%-13.5%.
This guidance reflects a more conservative outlook than the company’s long-term targets, which aim for 4-6% compound annual growth rate and adjusted EBITDA margins of 16%-18%. The near-term caution appears warranted given the company’s recent performance and broader market conditions.
The company’s near-term expectations are summarized in this outlook:
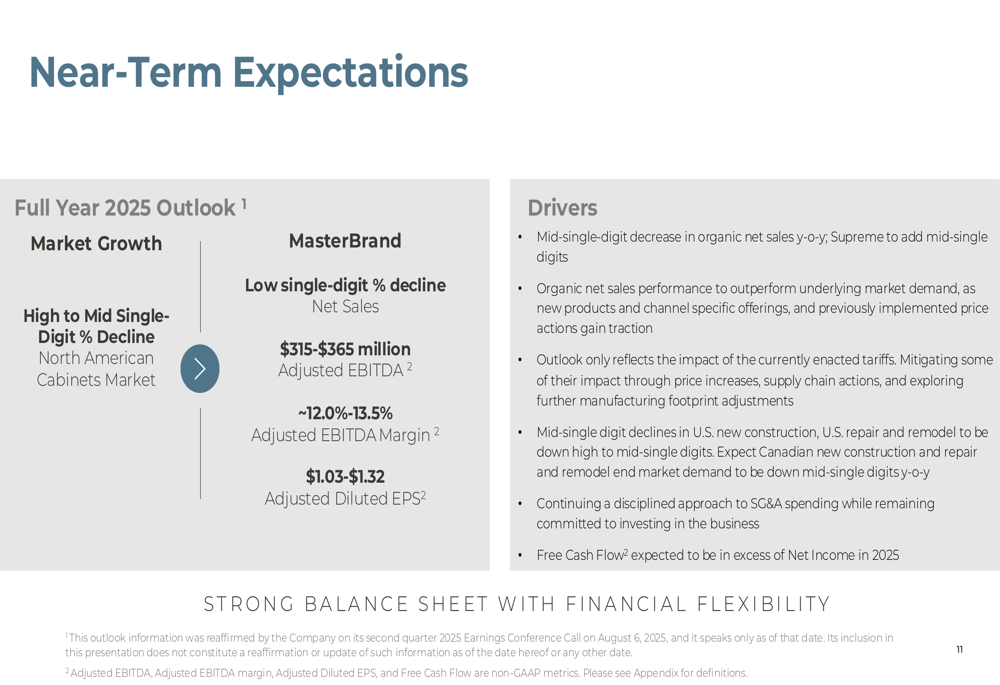
For the long term, MasterBrand remains optimistic about outpacing market growth, which it projects at 3-5% CAGR. The company’s path to achieving these results includes portfolio alignment with customer needs, operational excellence, and a strong focus on margin expansion.
Detailed Financial Analysis
A deeper examination of MasterBrand’s financial performance reveals both strengths and challenges. While the company achieved revenue growth, its balance sheet metrics show increasing leverage, with the net debt to adjusted EBITDA ratio rising to 2.5x from 1.3x year-over-year.
Free cash flow has also declined significantly to $25.5 million from $77.8 million in the comparable period last year. This reduction in cash generation capacity could potentially impact the company’s financial flexibility as it pursues the American Woodmark merger.
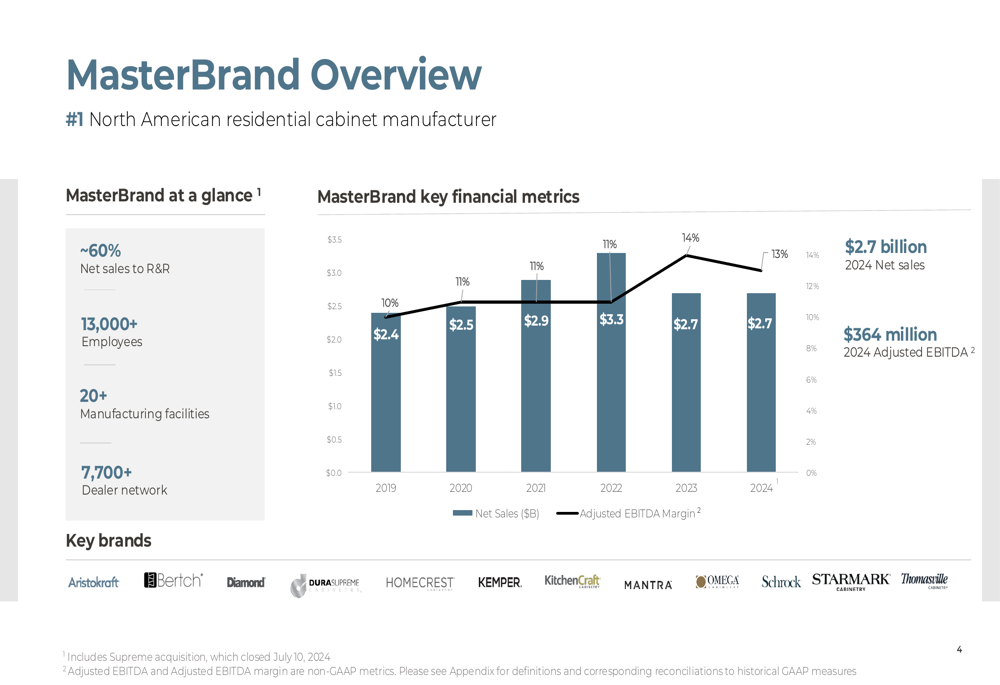
The company’s historical performance shows relatively stable revenue in recent years after a decline from peak levels in 2022:
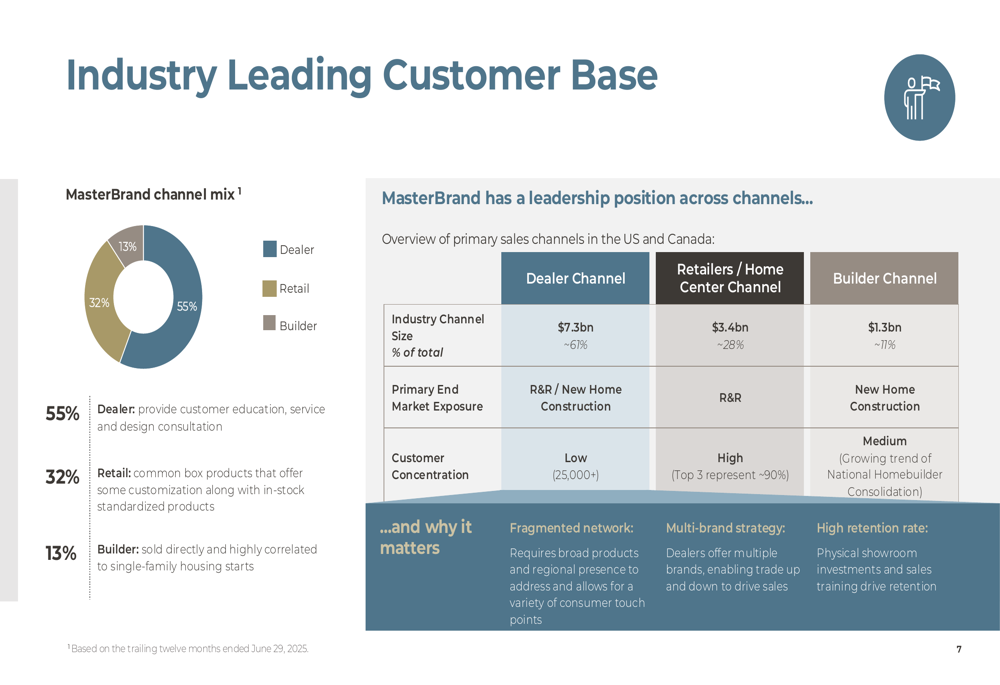
MasterBrand maintains a diversified customer base across channels, with 55% of sales through dealers, 32% through retail, and 13% through builders. This diversification provides some insulation from market fluctuations in any single channel.
The company’s channel mix is illustrated here:
Despite near-term challenges, MasterBrand’s stock price has shown resilience, trading at $11.74 in the premarket session. However, this remains well below the 52-week high of $20.67, suggesting investors remain cautious about the company’s prospects and the execution of its strategic initiatives, including the American Woodmark merger.
Full presentation:
This article was generated with the support of AI and reviewed by an editor. For more information see our T&C.