Is this U.S.-China selloff a buy? A top Wall Street voice weighs in

Introduction & Market Context
Mastercard Inc. (NYSE:MA) reported strong first-quarter 2025 financial results on May 1, with revenue and earnings growth continuing to demonstrate the payment giant’s resilience and market strength. The company’s shares were trading at $548.06 as of April 30, up 1.55% from the previous close and within its 52-week range of $428.86 to $582.23.
The Q1 results follow Mastercard’s impressive Q4 2024 performance, when the company exceeded analyst expectations with an earnings per share of $3.82 versus the forecasted $3.70. While the pace of revenue growth moderated slightly from 16% in Q4 2024 to 14% in Q1 2025, the company’s fundamentals remain robust, with signs of acceleration appearing in April.
Quarterly Performance Highlights
Mastercard delivered solid financial results across all key metrics in the first quarter of 2025. Net revenue reached $7.25 billion, representing a 14% increase year-over-year on a GAAP basis and 17% on a currency-neutral basis. Adjusted operating income grew 15% to $4.3 billion, while adjusted diluted earnings per share rose 13% to $3.73.
As shown in the following comprehensive financial performance table:
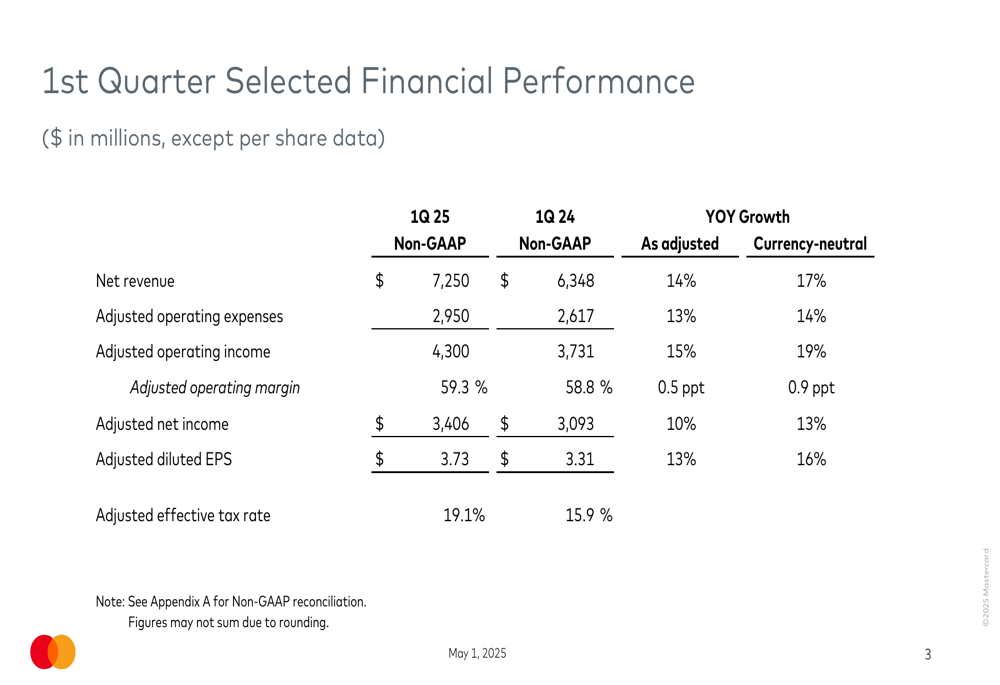
The company’s adjusted operating margin expanded to 59.3%, up 0.5 percentage points from 58.8% in Q1 2024, demonstrating Mastercard’s ability to grow revenue while maintaining cost discipline. However, the adjusted effective tax rate increased to 19.1% from 15.9% in the prior year, which partially offset the strong operational performance.
Detailed Financial Analysis
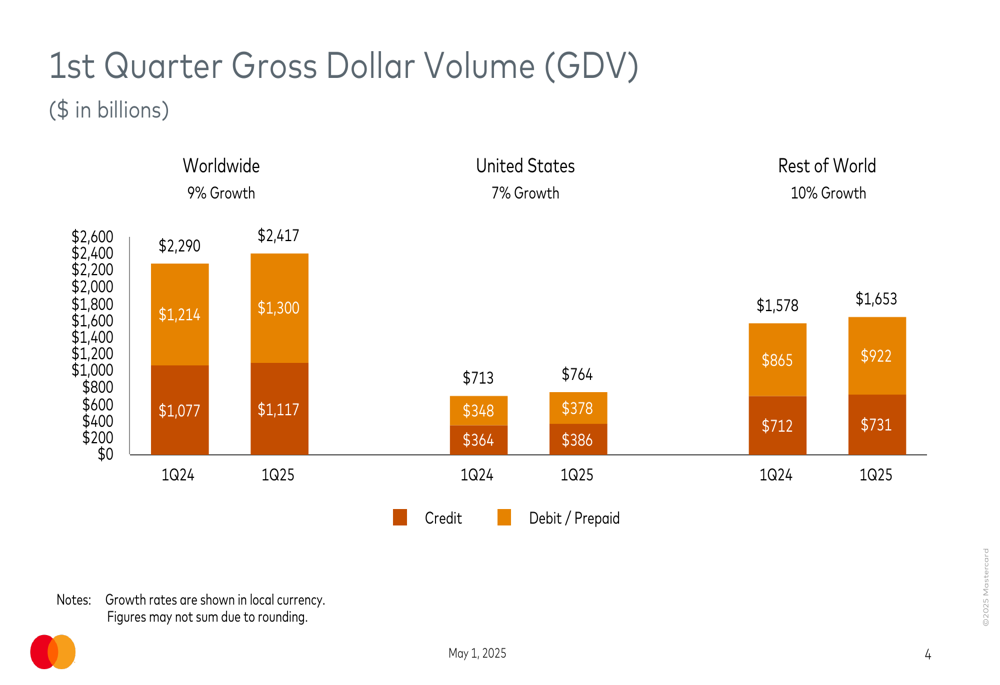
Mastercard’s gross dollar volume (GDV) grew 9% year-over-year on a local currency basis to $2.42 trillion. The company’s performance varied by region, with Rest of World markets growing at 10% compared to 7% in the United States. Debit and prepaid card volume continued to outpace credit card volume growth in both regions.
The following chart breaks down Mastercard’s gross dollar volume by region and payment type:
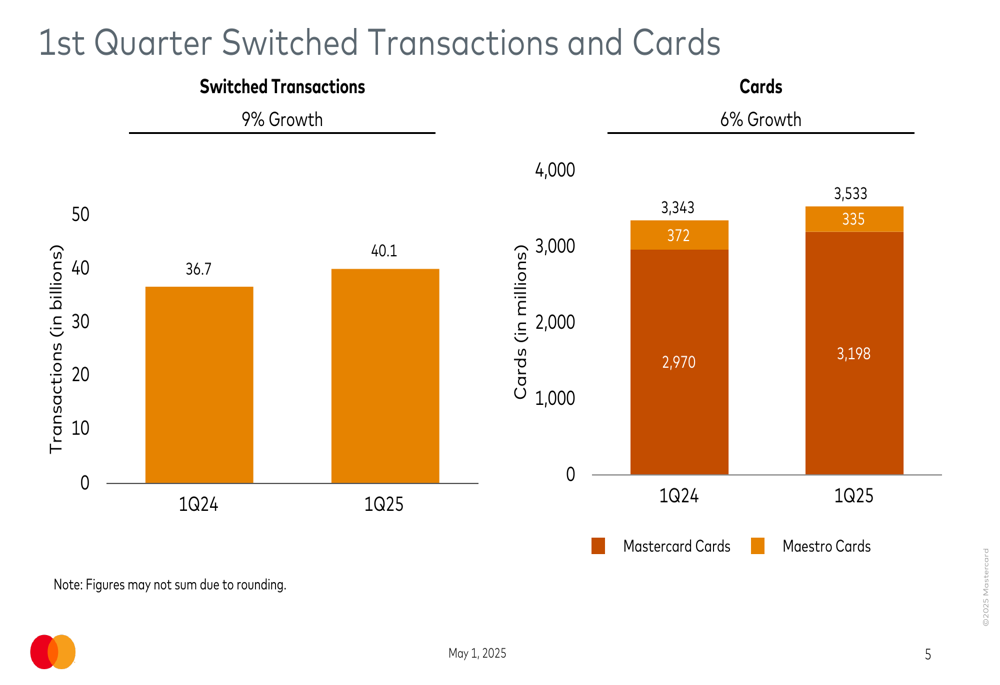
Switched transactions, a key indicator of payment activity, increased 9% to 40.1 billion in Q1 2025. Meanwhile, Mastercard’s total card base expanded 6% year-over-year to 3.53 billion cards worldwide, with Mastercard-branded cards growing 8% while Maestro cards declined 10%.
The transaction and card metrics are illustrated in this chart:
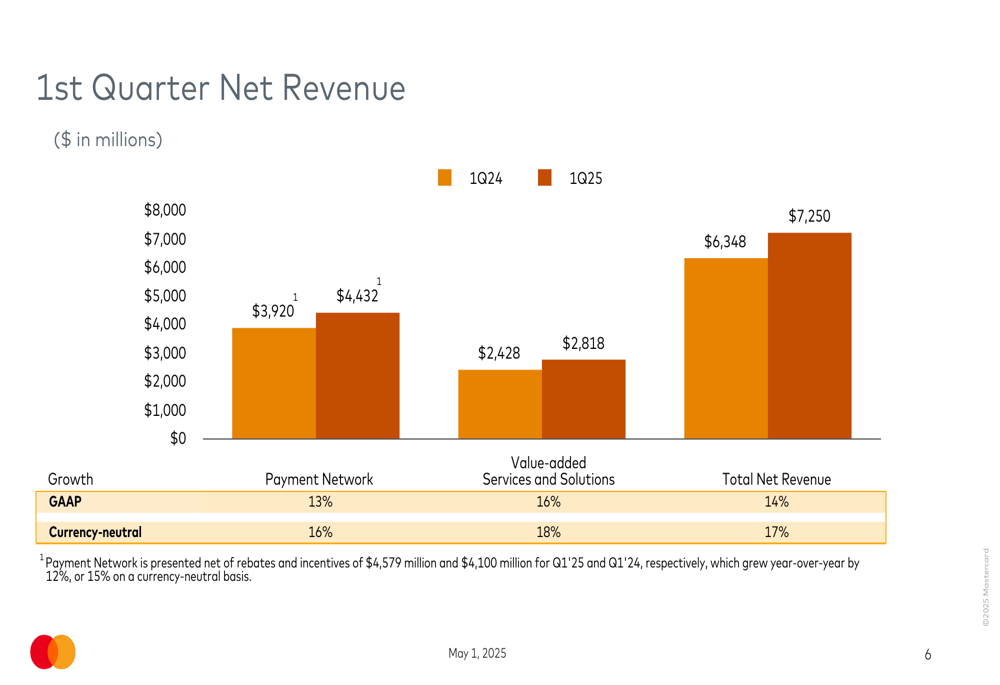
Revenue growth was balanced across Mastercard’s business segments, with Payment Network revenue increasing 13% (16% currency-neutral) to $4.43 billion and Value-added Services and Solutions growing 16% (18% currency-neutral) to $2.82 billion. The faster growth in Value-added Services reflects Mastercard’s successful diversification strategy beyond its core payment processing business.
The following chart shows the revenue breakdown by segment:
Within the Payment Network segment, Cross-Border Assessments showed the strongest growth at 16% (18% currency-neutral) to $2.6 billion, followed by Transaction (JO:NTUJ) Processing Assessments at 14% (17% currency-neutral) to $3.53 billion. Domestic Assessments grew more modestly at 8% (12% currency-neutral) to $2.66 billion.
Forward-Looking Statements & April Trends
Particularly encouraging for investors is the acceleration in key metrics observed through April 28, 2025. Switched volume growth improved to 12% in April from 11% in Q1, while cross-border volume growth jumped to 17% from 15% in Q1. This suggests positive momentum heading into the second quarter of 2025.
The detailed business update through April 28th is presented in this comprehensive table:
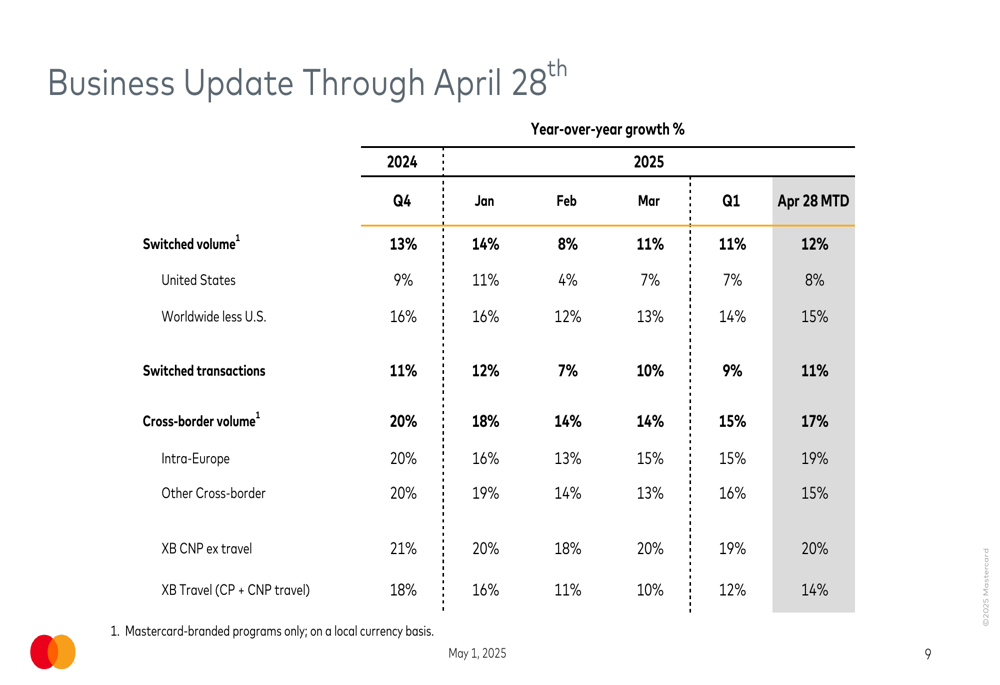
Cross-border e-commerce excluding travel continues to be a standout performer, growing at 20% in April compared to 19% in Q1. Travel-related cross-border spending is showing signs of recovery, improving to 14% growth in April from 12% in Q1, though still below the 18% growth seen in Q4 2024.
Operating Expenses and Margin Analysis
Mastercard’s adjusted operating expenses increased 13% (14% currency-neutral) to $2.95 billion in Q1 2025. General and administrative expenses, which make up the bulk of operating costs, grew 10% to $2.52 billion. Marketing expenses saw the largest percentage increase at 32% to $152 million, reflecting the company’s investments in growth initiatives.
The following chart details Mastercard’s operating expenses:
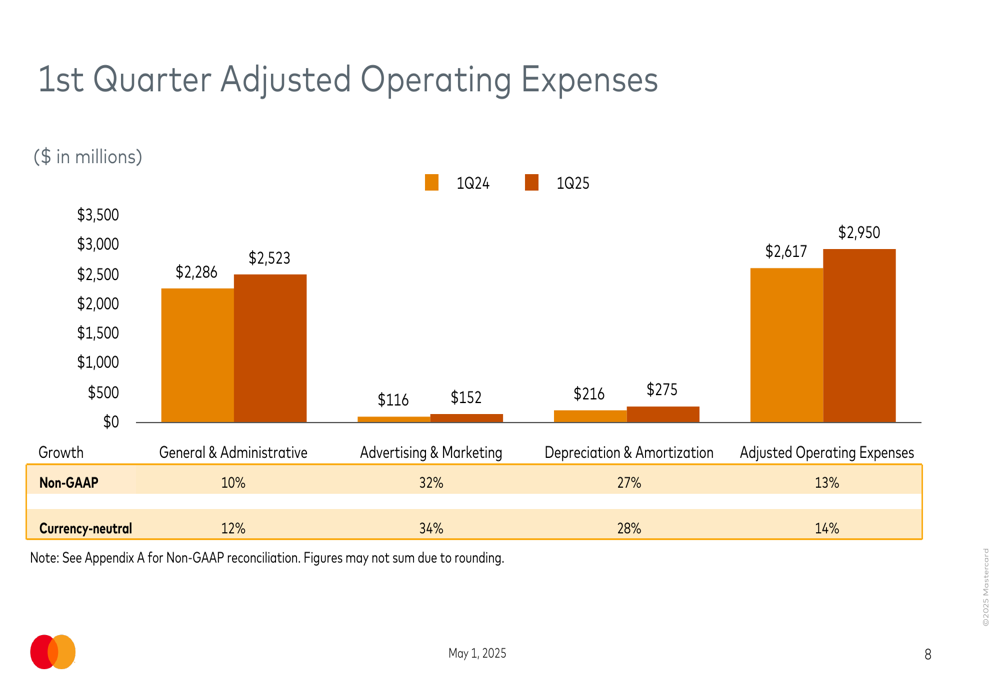
Despite the increase in operating expenses, Mastercard managed to expand its adjusted operating margin by 0.5 percentage points to 59.3%, demonstrating the company’s operational leverage and efficiency. This margin expansion is particularly impressive given the significant investments in marketing and technology.
Strategic Initiatives and Outlook
While the presentation did not explicitly detail strategic initiatives, Mastercard’s financial results reflect its continued focus on diversifying beyond traditional card payments. The 16% growth in Value-added Services and Solutions (18% currency-neutral) outpaced the 13% growth in Payment Network revenue, indicating success in expanding the company’s service offerings.
Based on the non-GAAP reconciliation for the 2025 financial outlook, Mastercard appears to have updated its guidance, though specific details were not provided in the main presentation slides. The company’s strong April performance suggests potential for continued momentum in the coming quarters.
The cross-border volume growth of 17% in April is particularly significant as it represents a recovery from the 15% growth in Q1 2025 and moves closer to the 20% growth seen in Q4 2024. This metric is especially important for Mastercard as cross-border transactions typically generate higher fees and have a substantial impact on overall profitability.
As digital payments continue to expand globally and cash usage declines, Mastercard remains well-positioned to capitalize on these long-term trends while navigating near-term economic uncertainties.
Full presentation:
This article was generated with the support of AI and reviewed by an editor. For more information see our T&C.