Stock market today: S&P 500 hits fresh record close on stronger economic growth

Introduction & Market Context
Medpace Holdings Inc (NASDAQ:MEDP) presented its second quarter 2025 financial results on July 21, 2025, revealing strong performance across key metrics and a significant upgrade to its full-year guidance. The clinical research organization closed the trading day at $311.87, down 0.96%, despite delivering results that exceeded expectations.
The company’s presentation comes amid a challenging environment for biotech funding that was highlighted in its previous quarter’s earnings call. Despite these industry headwinds, Medpace demonstrated resilience with accelerating revenue growth and improved operational efficiency in Q2.
Quarterly Performance Highlights
Medpace reported Q2 2025 revenue of $603.3 million, representing a 14.2% increase compared to $528.1 million in the same period last year. This acceleration in growth is notable compared to the 9.3% year-over-year growth reported in Q1 2025.
Net new business awards reached $620.5 million in Q2, up 12.6% from Q2 2024, resulting in a net book-to-bill ratio of 1.03. While this ratio remains relatively stable compared to 1.04 in Q2 2024, it represents an improvement from the 0.90 reported in Q1 2025.
As shown in the following table of key operating metrics:
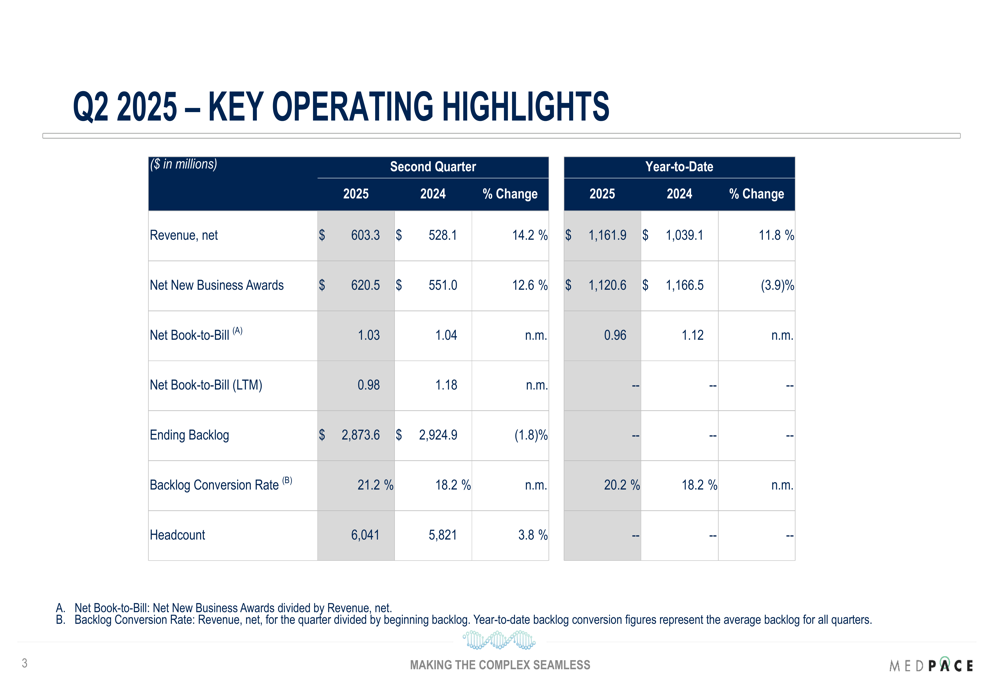
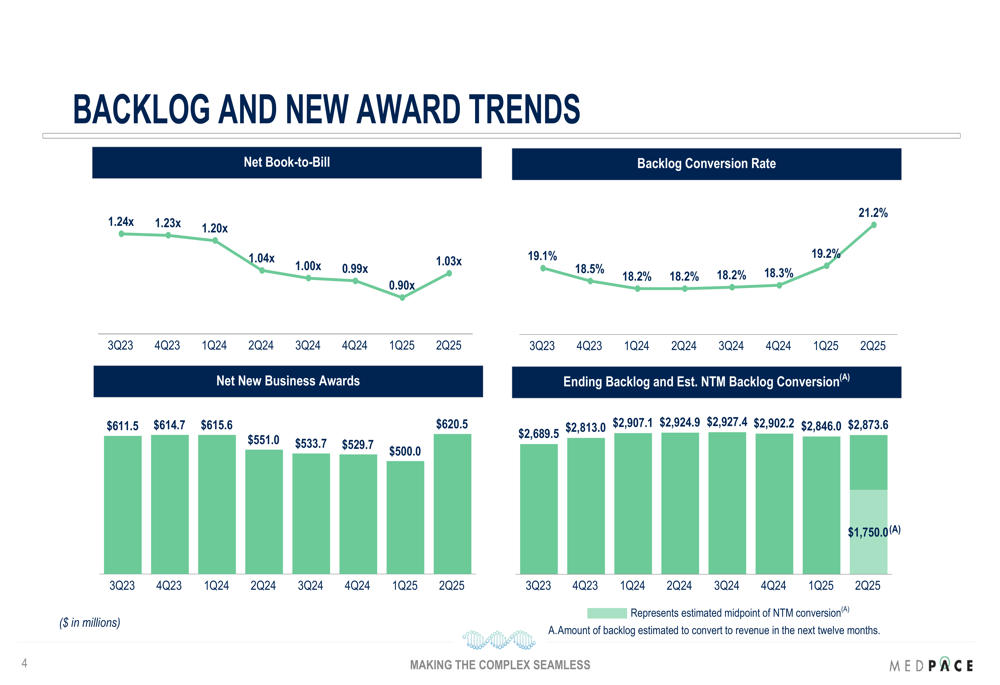
The company’s ending backlog stood at $2,873.6 million, slightly down by 1.8% compared to Q2 2024, but showing improvement from the previous quarter. Notably, the backlog conversion rate increased to 21.2% from 18.2% in the prior year period, indicating more efficient project execution and revenue recognition.
The following chart illustrates the trends in backlog and new business awards:
Detailed Financial Analysis
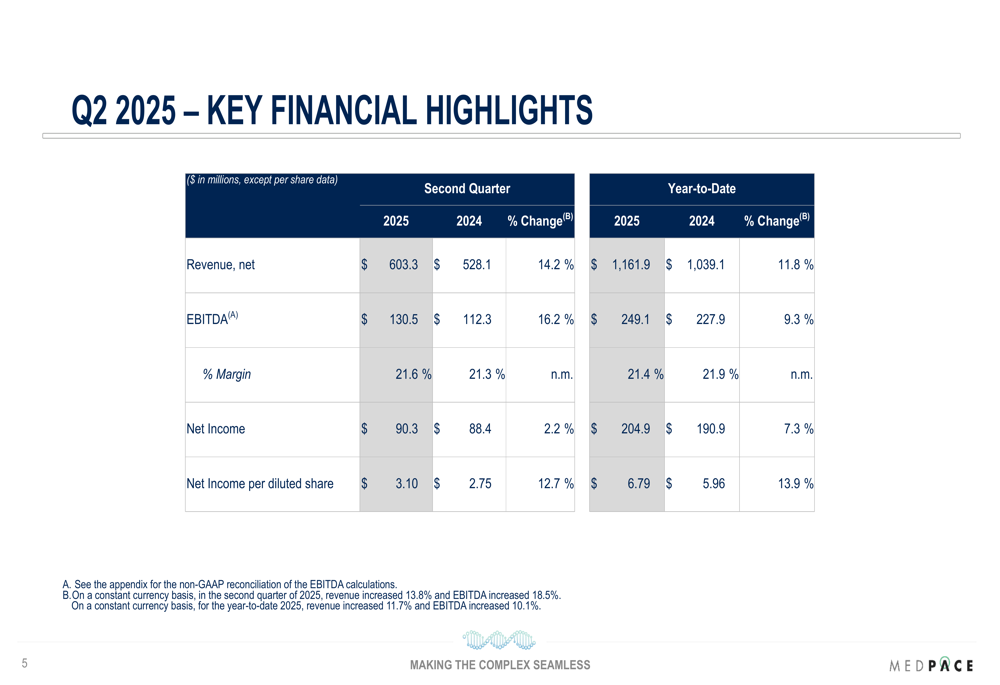
Medpace’s profitability metrics showed solid improvement in Q2 2025. EBITDA increased by 16.2% year-over-year to $130.5 million, with EBITDA margin expanding to 21.6% from 21.3% in Q2 2024. Net income rose to $90.3 million, up 2.2% from the prior year, while diluted earnings per share grew 12.7% to $3.10.
The key financial highlights are summarized in the following table:
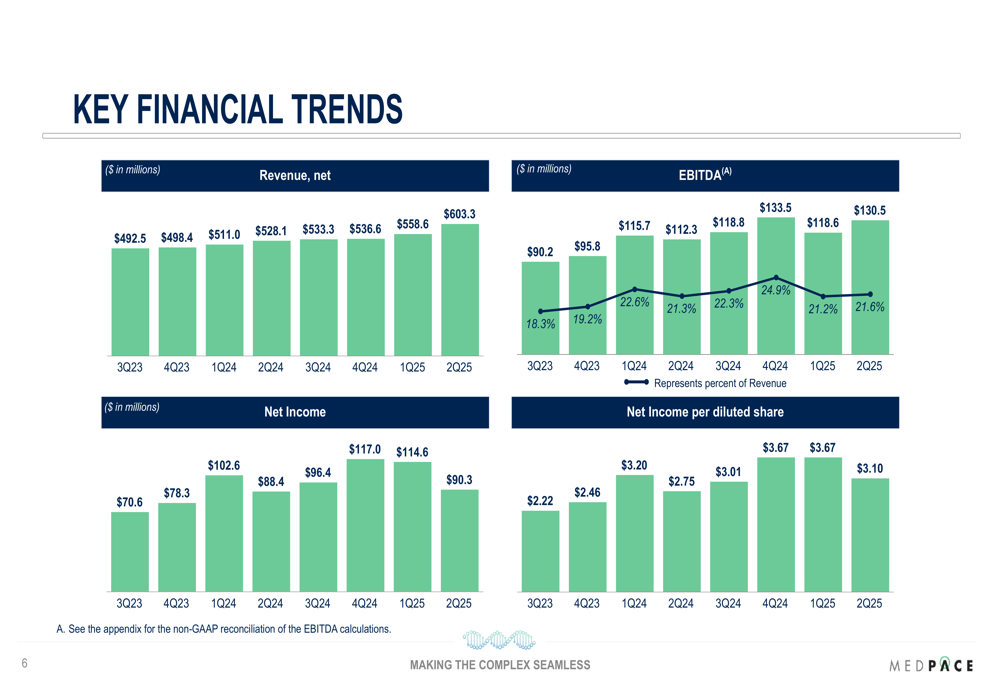
The company’s quarterly financial trends show consistent growth across revenue, EBITDA, and earnings per share, as illustrated in the following chart:
Medpace’s cash position remains strong, with operating cash flow of $148.5 million in Q2 2025, compared to $116.4 million in Q2 2024. Free cash flow reached $142.4 million, representing a 109.2% conversion rate from EBITDA. The company reported $610.9 million in cash and executed $518.5 million in share repurchases during the quarter.
Forward-Looking Statements & Guidance
In a significant development, Medpace substantially raised its full-year 2025 guidance across all key metrics. The company now projects annual revenue between $2,420 million and $2,520 million, representing growth of 14.7% to 19.5%. This marks a dramatic increase from the previous guidance of $2,140 million to $2,240 million (1.5% to 6.2% growth) provided in April 2025.
The following table details the revised guidance compared to previous projections:
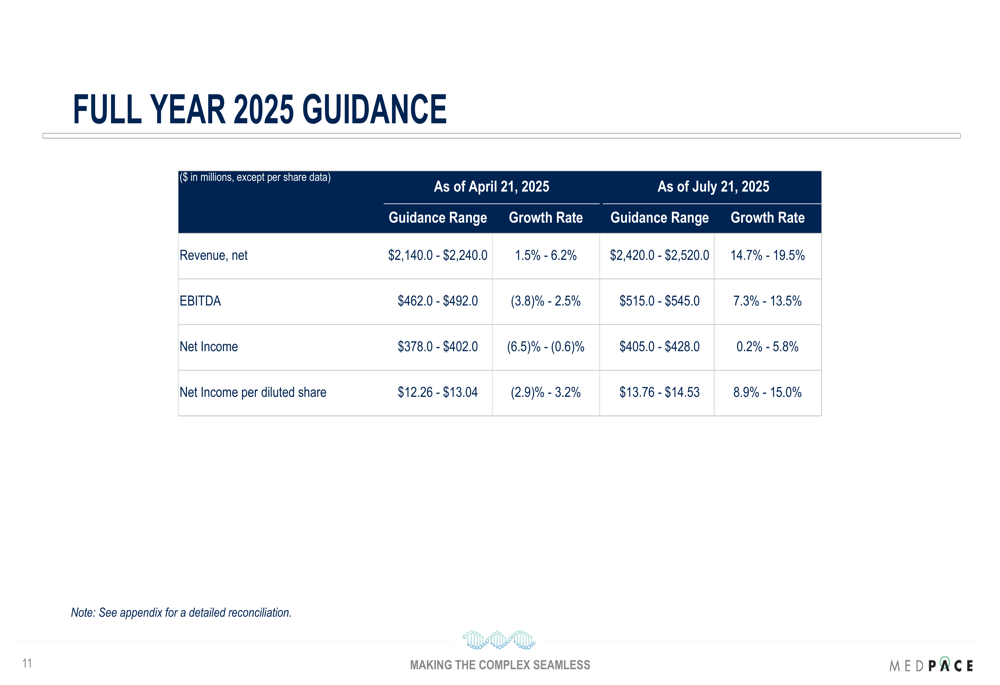
EBITDA guidance was raised to a range of $515 million to $545 million (7.3% to 13.5% growth), up from the previous $462 million to $492 million. Net income is now expected between $405 million and $428 million, with diluted EPS projected at $13.76 to $14.53, representing growth of 8.9% to 15.0% year-over-year.
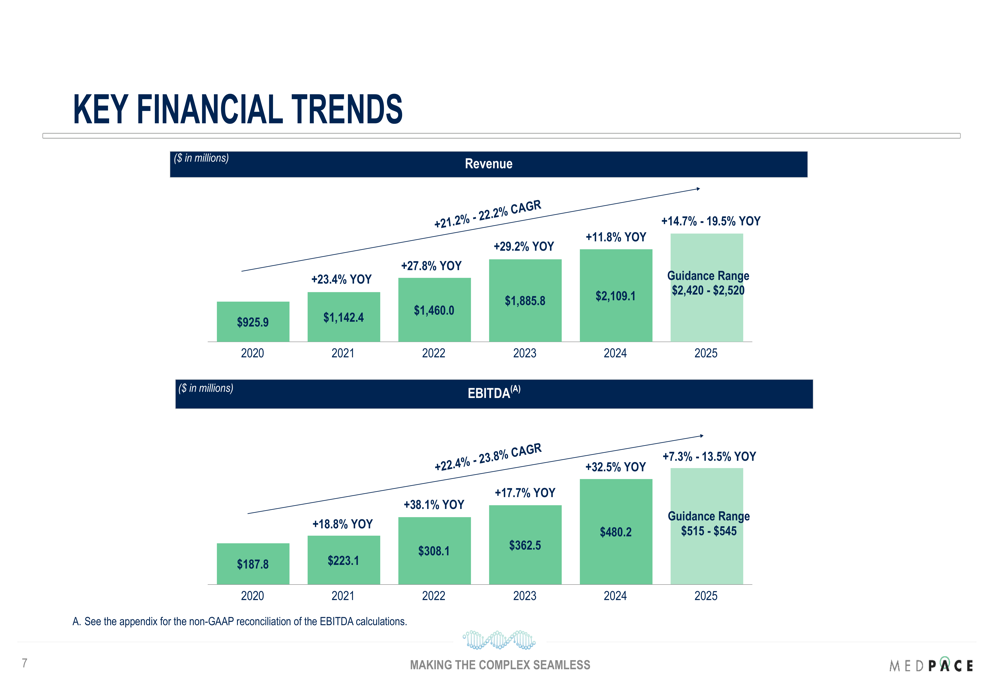
The long-term revenue and EBITDA trends, including the new guidance, are illustrated in the following chart:
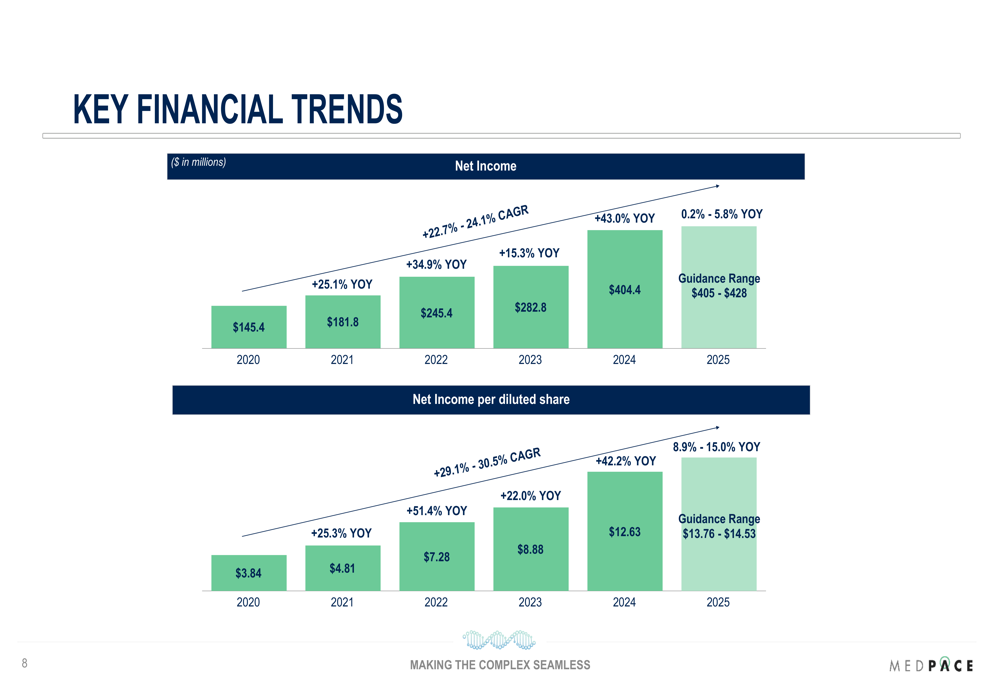
Similarly, the net income and EPS trends with updated guidance are shown here:
Competitive Industry Position
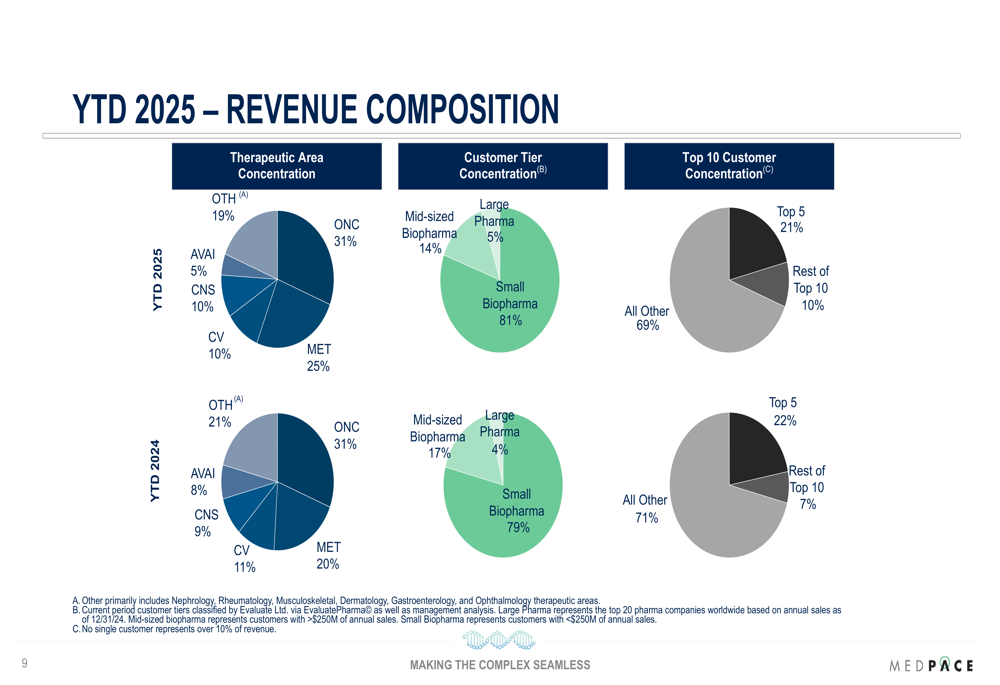
Medpace continues to maintain its strategic focus on small biopharma clients, which represented 81% of its year-to-date revenue in 2025, up slightly from 79% in the comparable period of 2024. The company’s therapeutic area concentration remains heavily weighted toward oncology (31%) and metabolic disorders (25%), with the latter showing increased contribution compared to the prior year.
The revenue composition by therapeutic area and customer concentration is illustrated in the following charts:
This client mix differentiates Medpace from larger CROs that typically focus more on large pharmaceutical companies. The company’s ability to grow despite the challenging funding environment for small biotechs suggests it is successfully navigating market headwinds and potentially gaining market share in its target segments.
The significant guidance increase also indicates management’s confidence in the business outlook for the remainder of 2025, contrasting with the more cautious tone observed during the Q1 earnings call when CEO August Trundle acknowledged funding difficulties as "a bigger issue than drug failures."
Medpace’s continued execution and improved outlook suggest the company has found effective strategies to thrive despite the broader industry challenges, positioning it well for sustained growth through the remainder of 2025 and beyond.
Full presentation:
This article was generated with the support of AI and reviewed by an editor. For more information see our T&C.