These are top 10 stocks traded on the Robinhood UK platform in July

Introduction & Market Context
Meta Platforms Inc (NASDAQ:META) has released its Q2 2025 earnings presentation, revealing strong financial performance across all key metrics. The social media giant reported total revenue of $47.5 billion, representing a 22% year-over-year increase compared to Q2 2024. Following the announcement, Meta’s stock rose 1.28% in aftermarket trading to $708.98, building on its recent momentum that has seen the stock trade near its 52-week high of $747.90.
The company’s performance this quarter continues the positive trajectory seen in Q1 2025, when Meta exceeded analyst expectations with an EPS of $6.43 and revenue of $42.31 billion. The Q2 results have surpassed the guidance provided during the previous earnings call, which projected Q2 revenue between $42.5 billion and $45.5 billion.
Quarterly Performance Highlights
Meta’s Q2 2025 financial results demonstrate robust growth across its business segments. The company reported total revenue of $47.5 billion, with advertising revenue accounting for $46.6 billion. The Family of Apps segment generated $47.1 billion in revenue, while Reality Labs contributed $370 million.
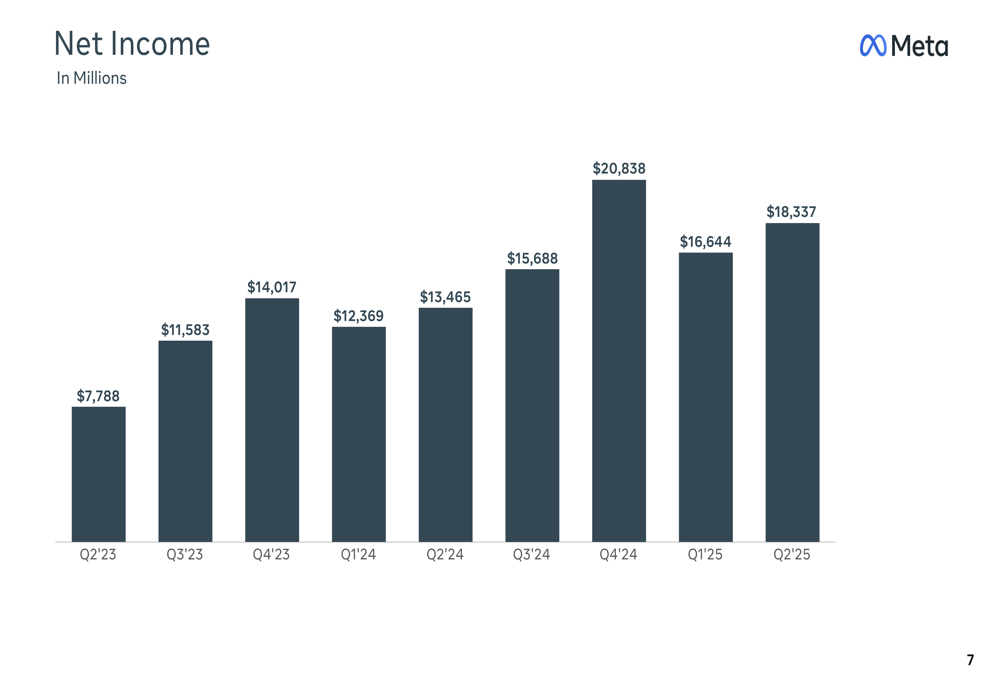
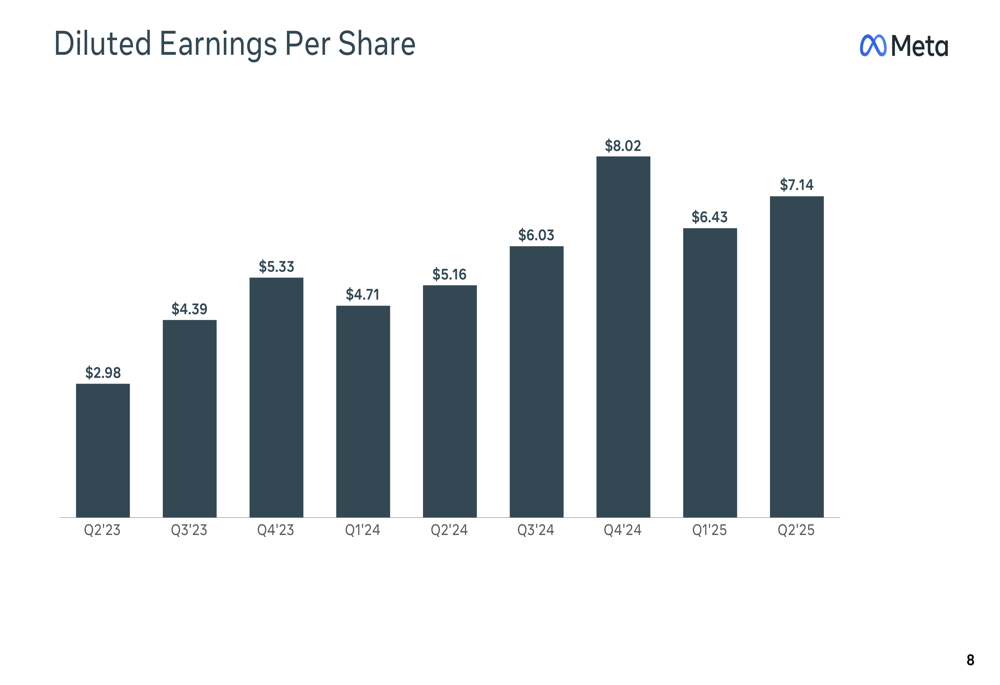
Income from operations reached $20.4 billion, resulting in an impressive operating margin of 43%. Net income for the quarter was $18.3 billion, translating to diluted earnings per share of $7.14, a significant improvement from $5.16 in Q2 2024.
As shown in the following chart of segment results:
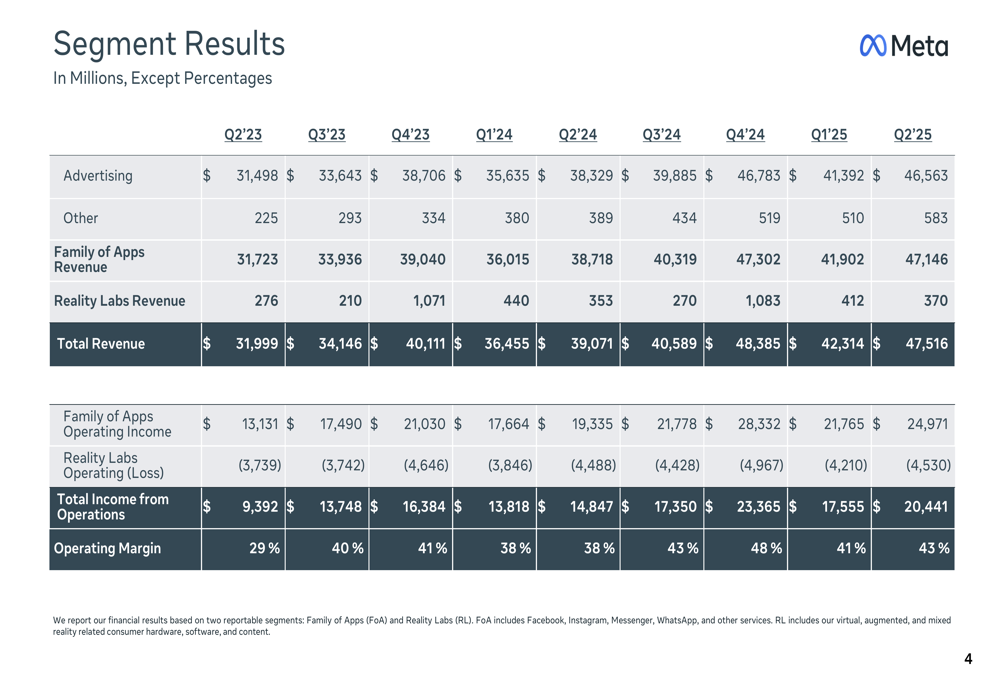
The Family of Apps segment continues to be the primary profit driver with $25 billion in operating income, while Reality Labs posted an operating loss of $4.5 billion, reflecting Meta’s ongoing investment in its metaverse initiatives.
Detailed Financial Analysis
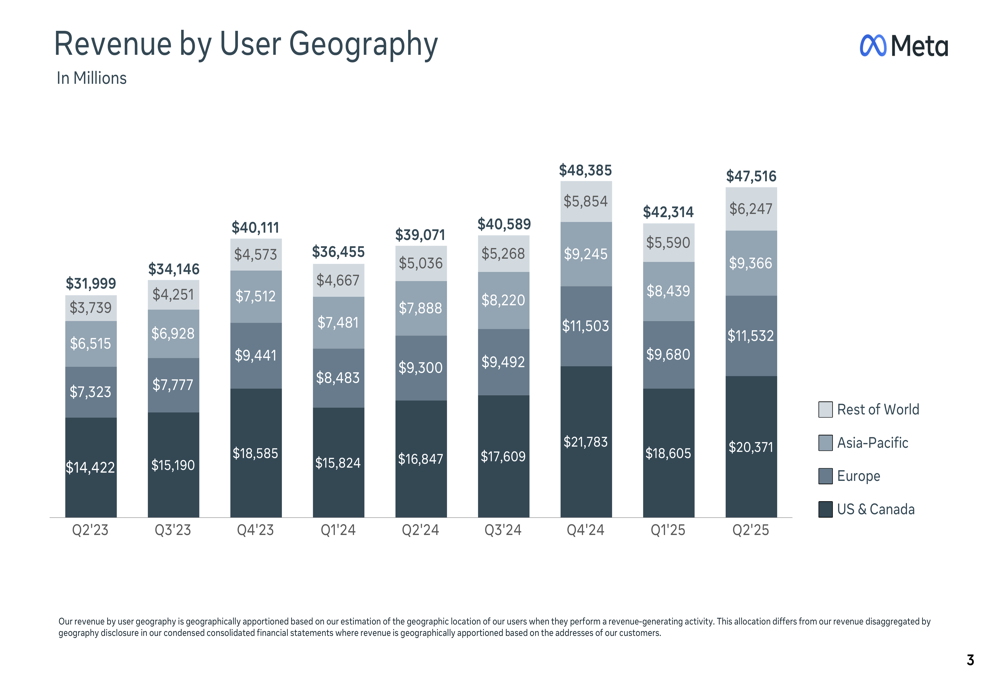
Meta’s revenue growth was consistent across all geographical regions, with the US & Canada remaining the largest contributor at $20.4 billion. Europe showed particularly strong performance with revenue of $11.5 billion, while Asia-Pacific and Rest of World generated $9.4 billion and $6.2 billion respectively.
The following chart illustrates Meta’s revenue breakdown by user geography:
The company has maintained strong expense discipline, with General & Administrative costs decreasing from 13% of revenue in Q2 2023 to just 6% in Q2 2025. Research & Development expenses, which likely include significant AI investments, accounted for 27% of revenue.
Meta’s effective tax rate for Q2 2025 was 11%, down from 16% in Q2 2023, contributing to the improved bottom line. Free cash flow for the quarter was $8.5 billion, despite the significant increase in capital expenditures.
The company’s net income has shown consistent growth over the past two years, as illustrated in this chart:
This growth in net income has translated to steady increases in earnings per share, reaching $7.14 in Q2 2025:
User Metrics and Engagement
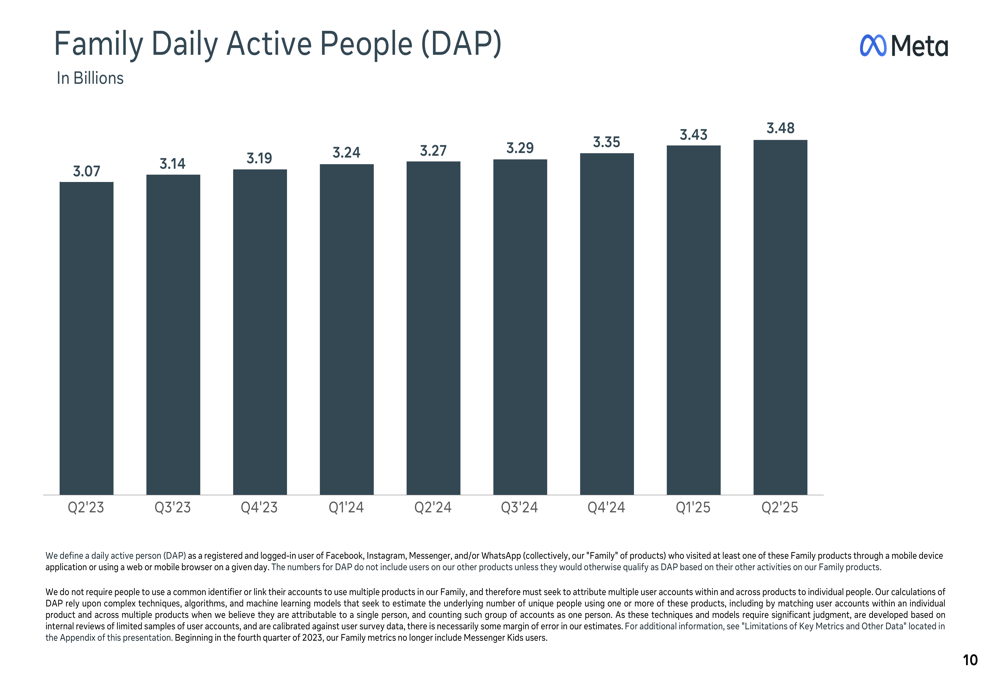
Meta’s Family Daily Active People (DAP), which measures unique users across Facebook, Instagram, WhatsApp, and Messenger, reached 3.48 billion in Q2 2025, representing a 6.4% increase year-over-year. This metric has shown consistent growth over the past two years, as illustrated in the following chart:
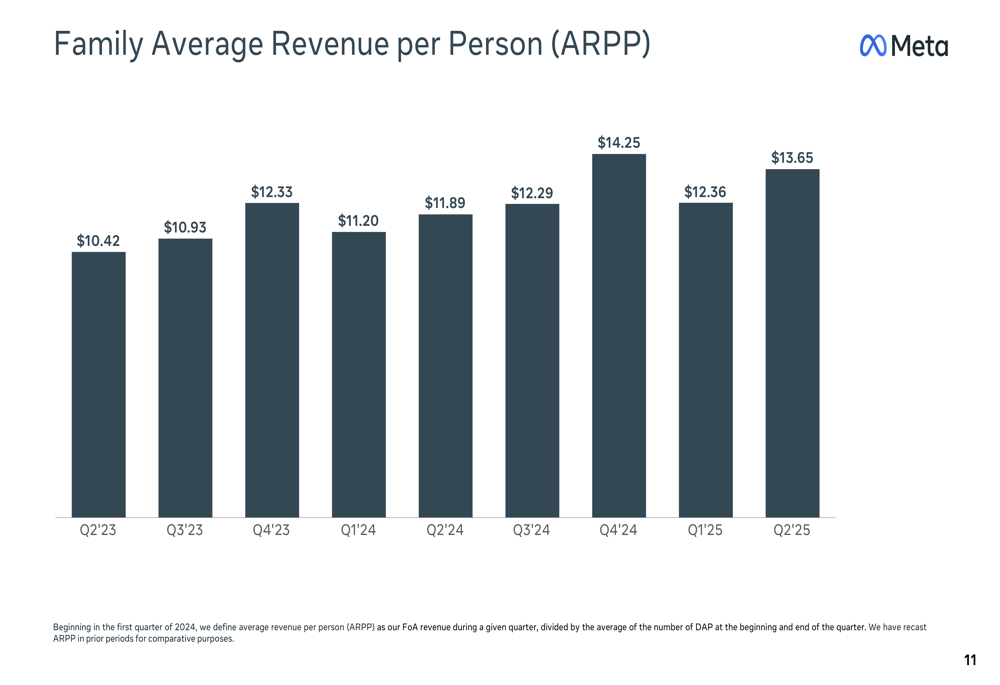
The company has also improved its monetization capabilities, with Family Average Revenue Per Person (ARPP) increasing to $13.65 in Q2 2025, up 14.8% from $11.89 in Q2 2024:
These metrics demonstrate Meta’s continued ability to expand its user base while simultaneously increasing revenue per user, a powerful combination for sustained growth.
Regional Performance
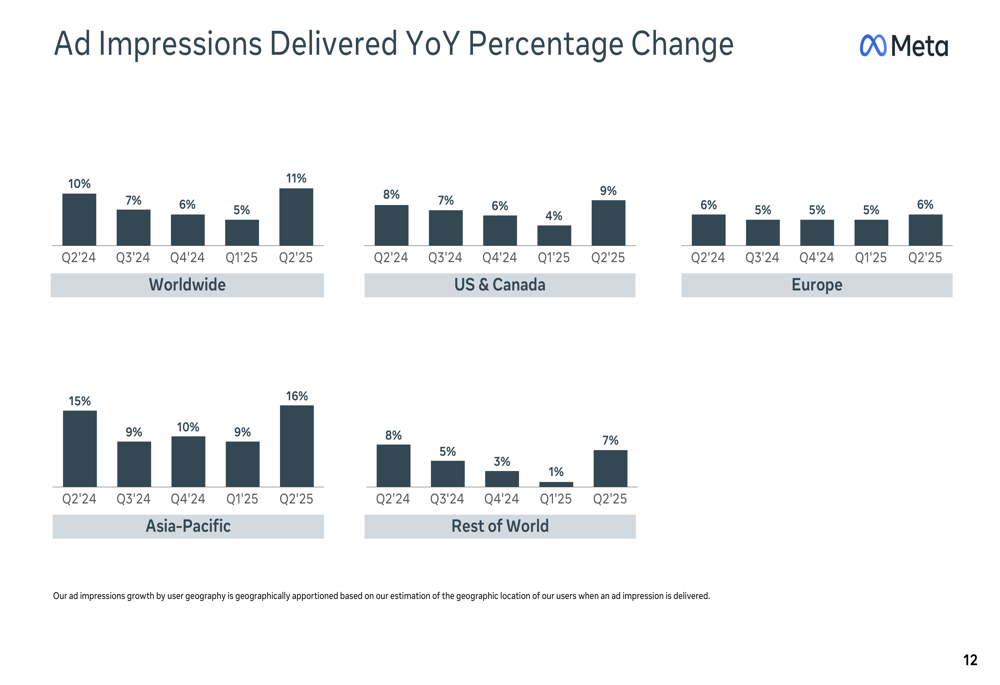
Meta’s advertising business showed strong performance across all regions, with worldwide ad impressions increasing 11% year-over-year in Q2 2025. The Asia-Pacific region led this growth with a 16% increase in impressions, highlighting the company’s expanding reach in emerging markets.
The following chart shows the year-over-year percentage change in ad impressions delivered by region:
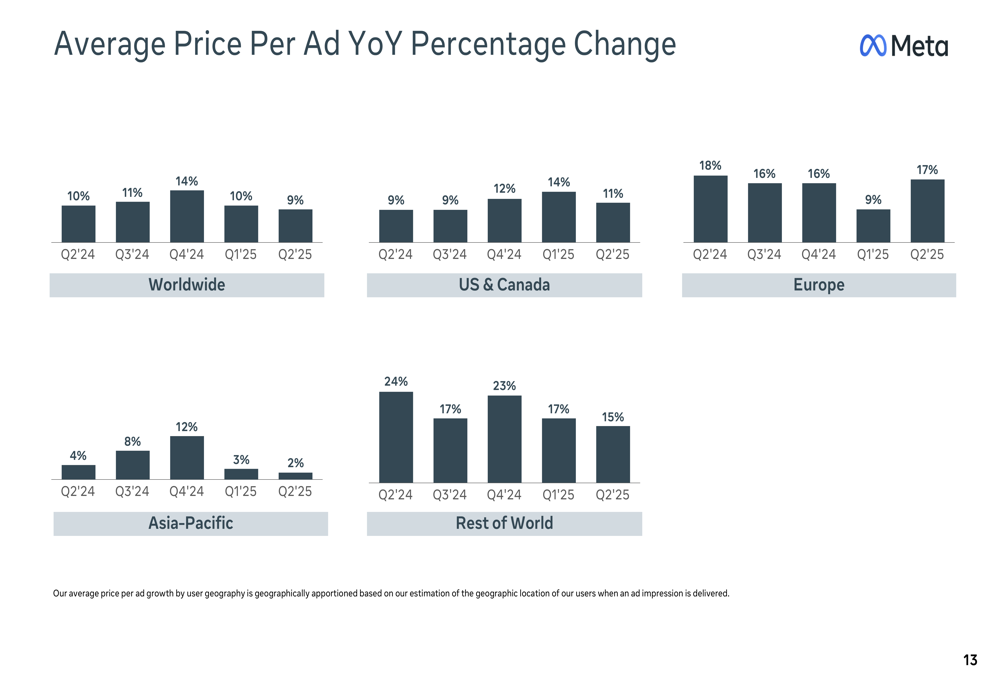
Complementing the growth in impressions, the average price per ad increased 9% globally. Europe showed the strongest pricing growth at 17%, followed by Rest of World at 15% and US & Canada at 11%. This pricing strength suggests advertisers continue to find value in Meta’s platforms despite increased competition in the digital advertising space.
The regional breakdown of average price per ad growth is illustrated in this chart:
Capital Expenditures and Future Outlook
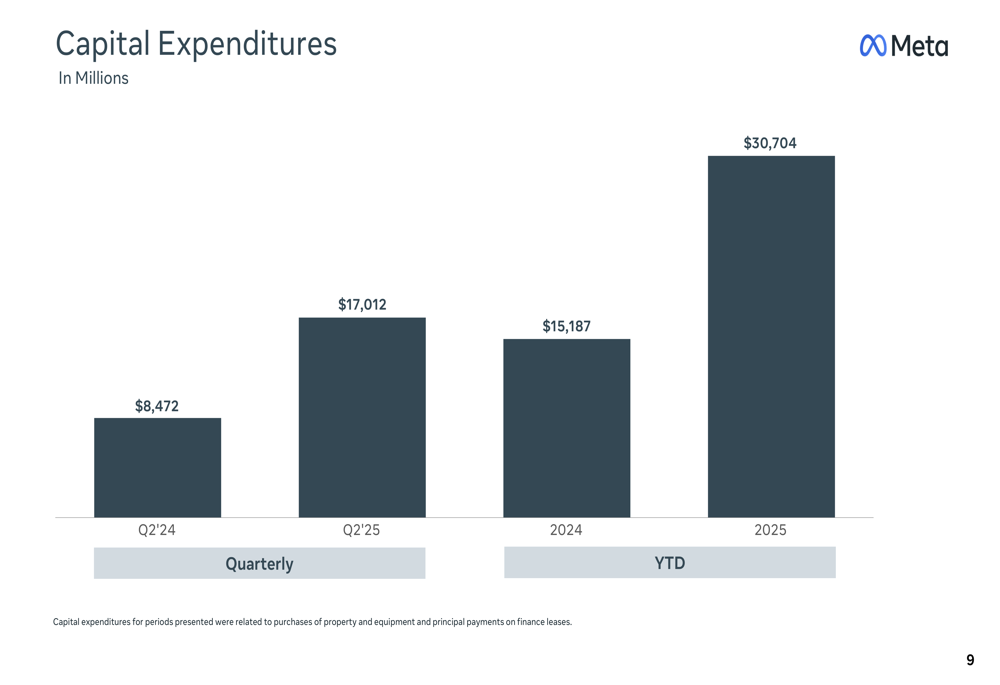
One of the most notable aspects of Meta’s Q2 2025 results is the significant increase in capital expenditures, which reached $17 billion for the quarter, more than double the $8.5 billion spent in Q2 2024. Year-to-date capital expenditures for 2025 stand at $30.7 billion, compared to $15.2 billion for the same period in 2024.
This substantial increase in capital spending likely reflects Meta’s continued investment in AI infrastructure and data centers, aligning with CEO Mark Zuckerberg’s stated focus on "building full general intelligence" mentioned during the Q1 2025 earnings call.
The combination of strong revenue growth, improved profitability, and increased capital investments positions Meta well for continued expansion in its core advertising business while developing new AI-driven capabilities and metaverse technologies. While Reality Labs continues to operate at a loss, the strong performance of the Family of Apps segment provides the financial foundation to support these long-term investments.
As Meta continues to execute on its strategic priorities, investors will be watching closely to see how these investments translate into future growth and whether the company can maintain its current momentum in an increasingly competitive digital landscape.
Full presentation:
This article was generated with the support of AI and reviewed by an editor. For more information see our T&C.