Bullish indicating open at $55-$60, IPO prices at $37

Metropolitan Commercial Bank (NYSE:MCB) presented its Q2 2025 investor presentation on July 18, 2025, showcasing strong financial performance that exceeded analyst expectations. The bank reported earnings per share of $1.76, beating forecasts of $1.73, while revenue reached $76.27 million compared to the expected $72.55 million. Following the announcement, MCB’s stock rose 3.5% in after-hours trading and continued climbing 2.23% in premarket activity.
Quarterly Performance Highlights
Metropolitan Bank reported impressive Q2 2025 results, with significant improvements across key metrics compared to the previous quarter. Net income rose 15% quarter-over-quarter to $18.8 million, driven by strong loan growth and improved net interest margin.
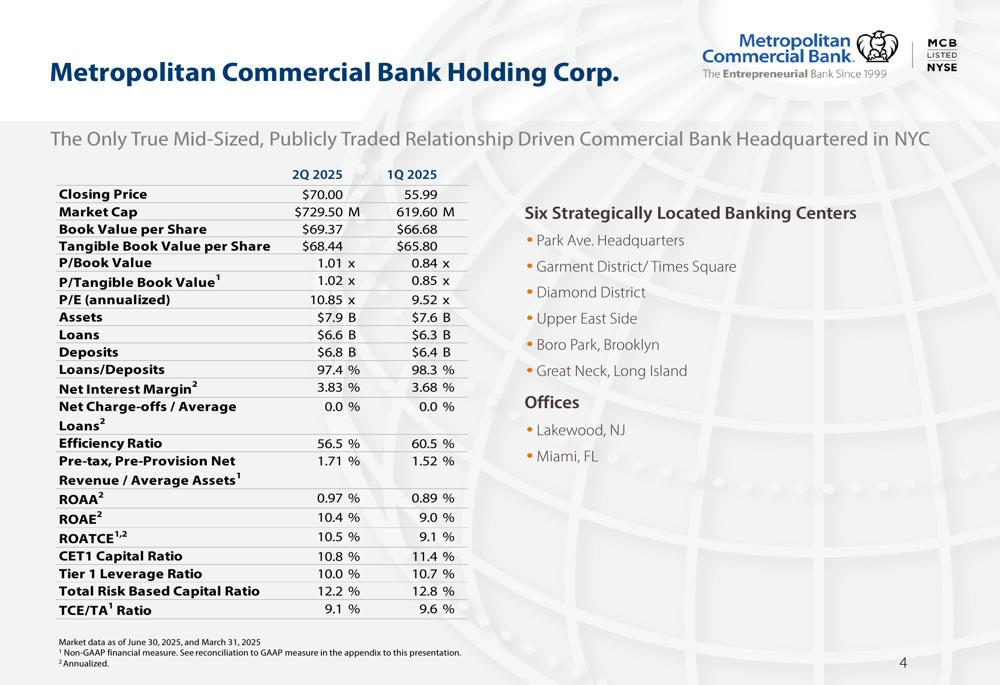
As shown in the following financial highlights chart, the bank’s closing stock price increased to $70.00 from $55.99 in Q1, while market capitalization grew to $729.50 million from $619.60 million. The bank’s efficiency ratio improved to 56.5% from 60.5%, and return on average equity increased to 10.4% from 9.0%.
The bank’s loan portfolio expanded by $271 million (4.3%) to $6.6 billion, while deposits grew by $342 million (5.3%) to $6.8 billion. Net interest margin improved to 3.83% from 3.68% in the previous quarter, contributing to the bank’s strong performance.
CEO Mark DiFazio emphasized the bank’s solid foundation during the earnings call, stating, "Our results continue to show the foundational strength and stability of our diversified commercial bank model."
Competitive Industry Position
Metropolitan Bank has consistently outperformed its peers in key financial metrics. The following chart illustrates the bank’s total return performance compared to NYC Middle-Market Banks and the KBW Regional Banking Index (KRX), showing MCB’s substantial outperformance since March 2023.
This outperformance extends to several growth metrics since the bank’s 2017 IPO. As shown in the following chart, MCB has achieved significantly higher compound annual growth rates (CAGR) in loans, deposits, pre-tax pre-provision net revenue, earnings per share, and tangible book value per share compared to both the KRX Index and NYC Middle-Market Banks.
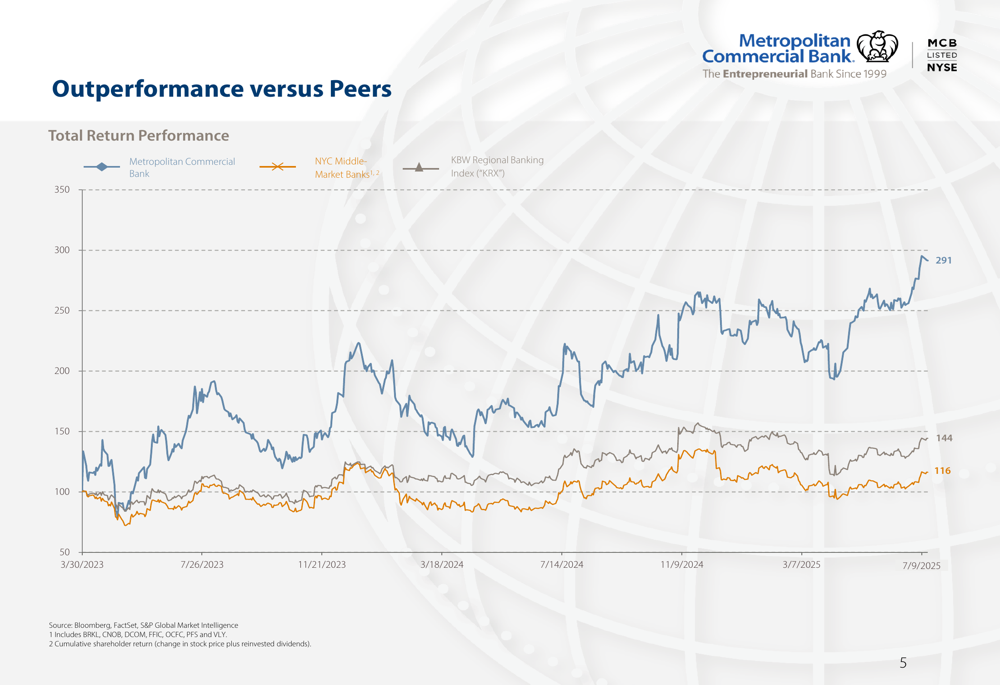
The bank’s share price has increased by 111.1% since its IPO, substantially outperforming the KRX Index (+16.4%) and NYC Middle-Market Banks (-25.5%). This strong performance reflects the bank’s effective execution of its business strategy and ability to capitalize on market opportunities.
Loan and Deposit Portfolio Diversification
A key strength of Metropolitan Bank is its highly diversified loan and deposit portfolios. The bank maintains a balanced approach to lending and funding, which helps mitigate concentration risks and provides stability.
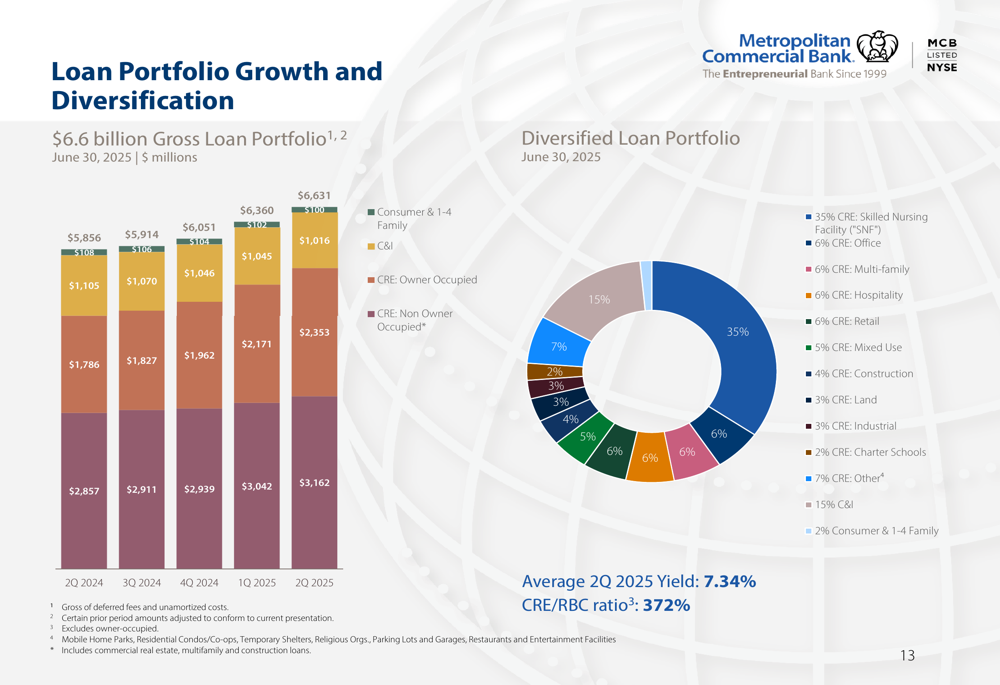
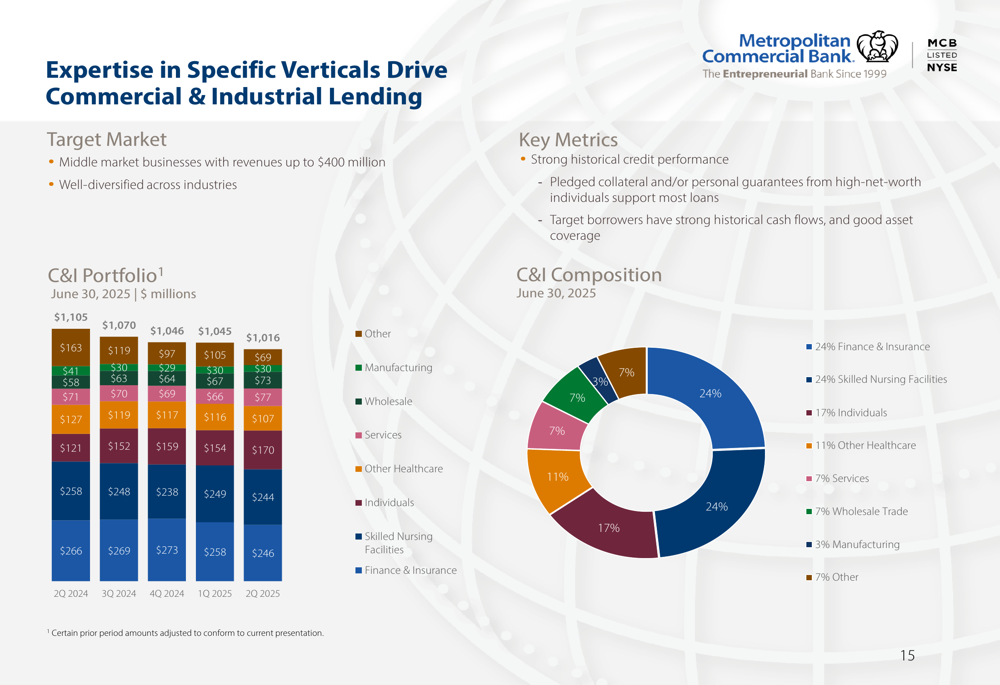
As illustrated in the following chart, the bank’s $6.6 billion loan portfolio is well-diversified across various sectors, with non-owner occupied commercial real estate (CRE) representing 48% and skilled nursing CRE and C&I accounting for 38%. Geographically, the portfolio is distributed across Manhattan (18%), other NYC boroughs (26%), Florida (18%), New Jersey (10%), and other locations.

The bank’s commercial real estate lending strategy focuses on relationship-based lending to New York metropolitan area real estate entrepreneurs with substantial net worth. The CRE portfolio maintains a conservative weighted average loan-to-value ratio of 61%, with 43% being owner-occupied properties.
The following chart breaks down the CRE portfolio by property type and region, showing significant exposure to skilled nursing facilities (42%) and a balanced geographic distribution.
Metropolitan Bank has developed particular expertise in healthcare lending, with a substantial portion of its portfolio dedicated to this sector. The following chart illustrates the bank’s healthcare portfolio composition, which includes $2.3 billion in CRE skilled nursing facility loans and $352 million in C&I healthcare loans.
On the funding side, the bank’s $6.8 billion deposit base is similarly diversified, with retail deposits accounting for 31%, deposits from loan customers 19%, property managers 19%, and municipal deposits 18%. This diversification provides funding stability and reduces reliance on any single deposit source.
Strategic Initiatives
Metropolitan Bank is undertaking a significant digital transformation initiative called "Modern Banking in Motion" to support future growth and enhance customer experience. This comprehensive project involves modernizing core systems, payments infrastructure, and online banking platforms.
As shown in the following timeline, the digital transformation project is expected to be completed by Q1 2026, with various milestones throughout the implementation process. The bank has incurred $8.4 million in project costs to date, with total estimated costs of $18 million including contingency.
CFO Dan Doherty highlighted during the earnings call that the digital transformation will "provide extensive digital proficiencies, NextGen analytics capabilities, API-based extensibility, optimized back-office processes and efficient origination and loan servicing."
The bank is partnering with several technology providers to implement this transformation, including Finzly for payments processing, AFS for commercial loans origination and servicing, Snowflake (NYSE:SNOW) for data warehousing, and Finxact for core processing.
Financial Performance Trends
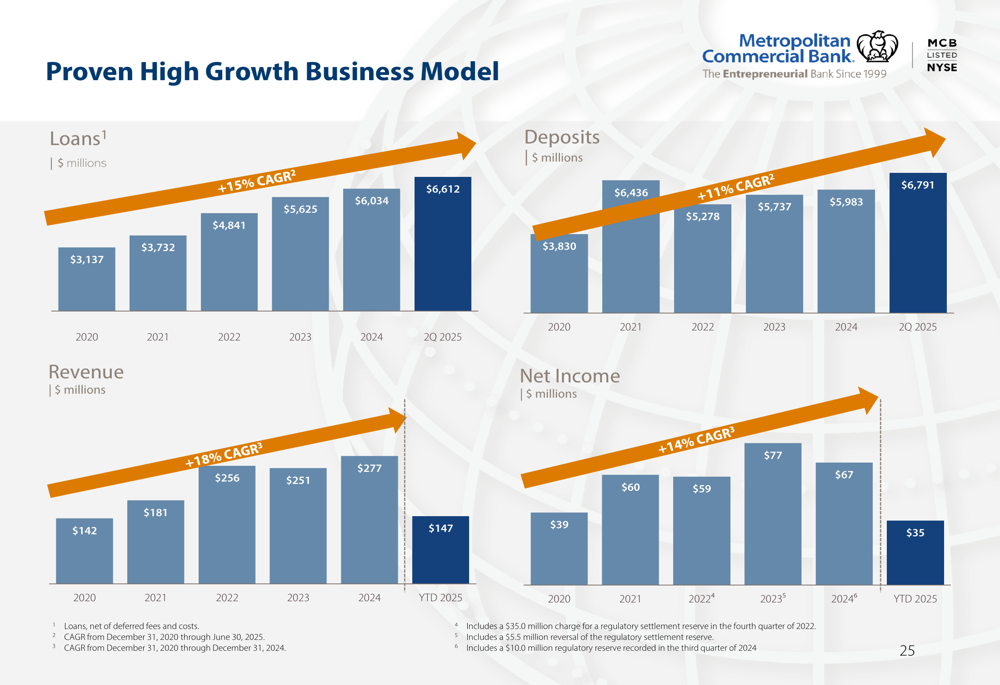
Metropolitan Bank has demonstrated consistent growth across key financial metrics over the past several years. The following chart illustrates the bank’s growth in loans, deposits, revenue, and net income since 2020.
The bank has achieved a 15% compound annual growth rate in loans and an 11% CAGR in deposits since 2020. Revenue has grown at an 18% CAGR, while net income has increased at a 14% CAGR during the same period.
Key financial ratios have also shown positive trends, with net interest margin improving to 3.76% year-to-date in 2025 from 3.53% in 2024. The efficiency ratio has improved to 58.4% year-to-date from 62.7% in 2024, indicating better operational efficiency.
The bank maintains strong capital ratios, although they have declined slightly from previous quarters due to growth. As of Q2 2025, the Common Equity Tier 1 capital ratio stood at 10.8%, the Tier 1 leverage ratio at 10.0%, and the total risk-based capital ratio at 12.2%.
Forward-Looking Statements
Looking ahead, Metropolitan Bank projects an annual net interest margin of 3.8% and expects operating expenses to remain between $45-46 million per quarter. The bank aims to capture additional market share and explore fee-based income opportunities in 2026.
The bank’s management expressed confidence in continued deposit growth across multiple verticals and maintaining a balanced loan mix between commercial and real estate loans. With a P/E ratio of 10.84 and strong financial health indicators, Metropolitan Bank appears well-positioned for continued growth.
Potential challenges include economic fluctuations affecting loan growth, competitive pressures in the commercial banking sector, regulatory changes, and potential delays in technology integration. However, the bank’s diversified business model and strong capital position provide resilience against these challenges.
Full presentation:
This article was generated with the support of AI and reviewed by an editor. For more information see our T&C.