Two 59%+ winners, four above 25% in Aug – How this AI model keeps picking winners

Introduction & Market Context
M&T Bank Corporation (NYSE:MTB) released its second quarter 2025 earnings presentation on July 16, 2025, revealing a significant rebound after a disappointing first quarter. The bank’s stock rose 1.38% in premarket trading to $200, following the strong results, though it had closed down 2.84% at $197.28 the previous day. This performance comes after M&T Bank missed analyst expectations in Q1 2025, when it reported EPS of $3.38 against a forecast of $3.42.
Quarterly Performance Highlights
M&T Bank reported substantial improvements across key financial metrics in Q2 2025. GAAP net income reached $716 million, up 22.6% from $584 million in Q1 2025 and 9.3% from $655 million in Q2 2024. Diluted earnings per share jumped to $4.24, representing a 28% increase quarter-over-quarter and a 14% rise year-over-year.
As shown in the following comprehensive earnings highlights chart, the bank demonstrated strong performance across multiple metrics:
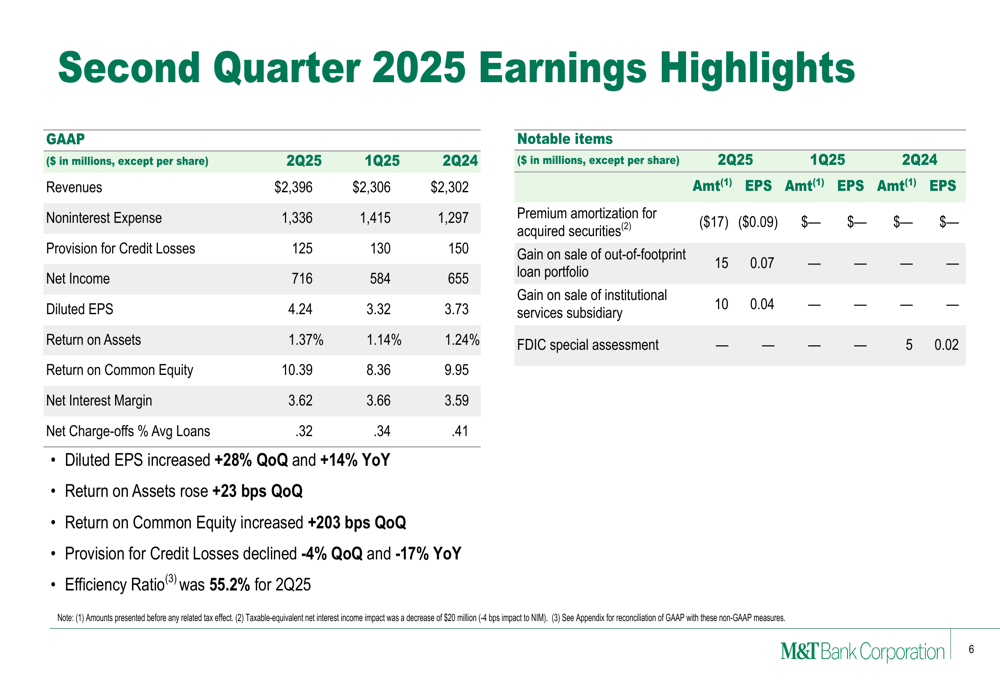
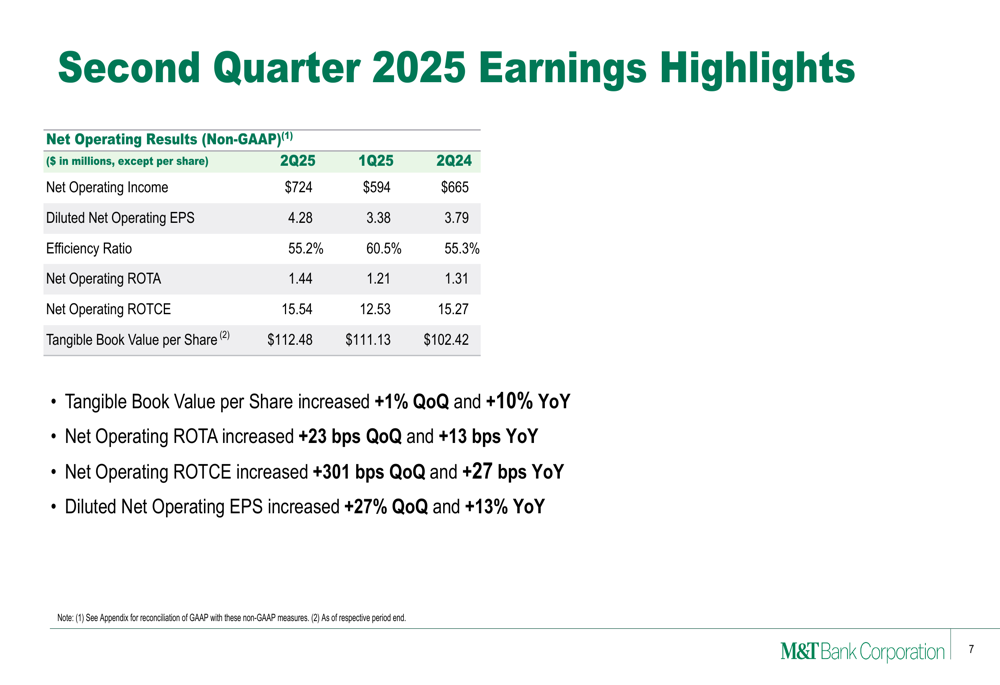
On a non-GAAP basis, the results were equally impressive. Net operating income rose to $724 million from $594 million in the previous quarter, while diluted net operating EPS increased to $4.28 from $3.38. The efficiency ratio improved significantly to 55.2% from 60.5% in Q1, indicating better operational performance.
Total (EPA:TTEF) revenue for Q2 2025 reached $2,396 million, up from $2,306 million in Q1 2025 and $2,302 million in Q2 2024. This represents a 3.9% increase quarter-over-quarter and a 4.1% rise year-over-year, demonstrating the bank’s ability to grow its top line despite challenging market conditions.
Detailed Financial Analysis
Net Interest Income and Margin
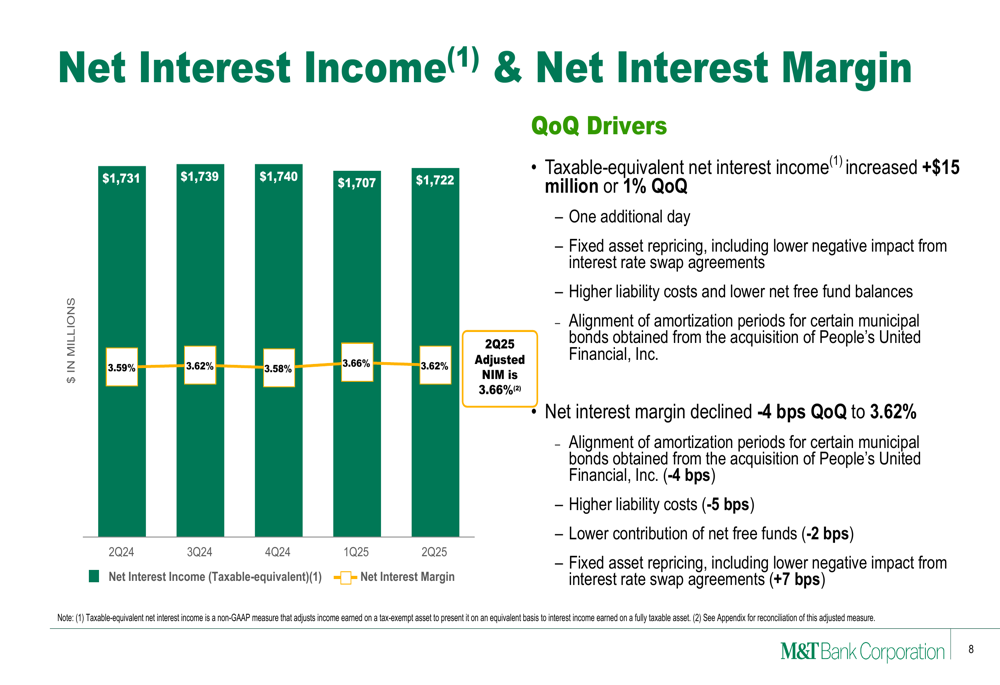
M&T Bank’s taxable-equivalent net interest income increased by $15 million or 1% quarter-over-quarter to $1,722 million. However, the net interest margin declined slightly to 3.62% from 3.66% in the previous quarter. The following chart illustrates the trend in net interest income and margin over the past five quarters:
Balance Sheet Strength
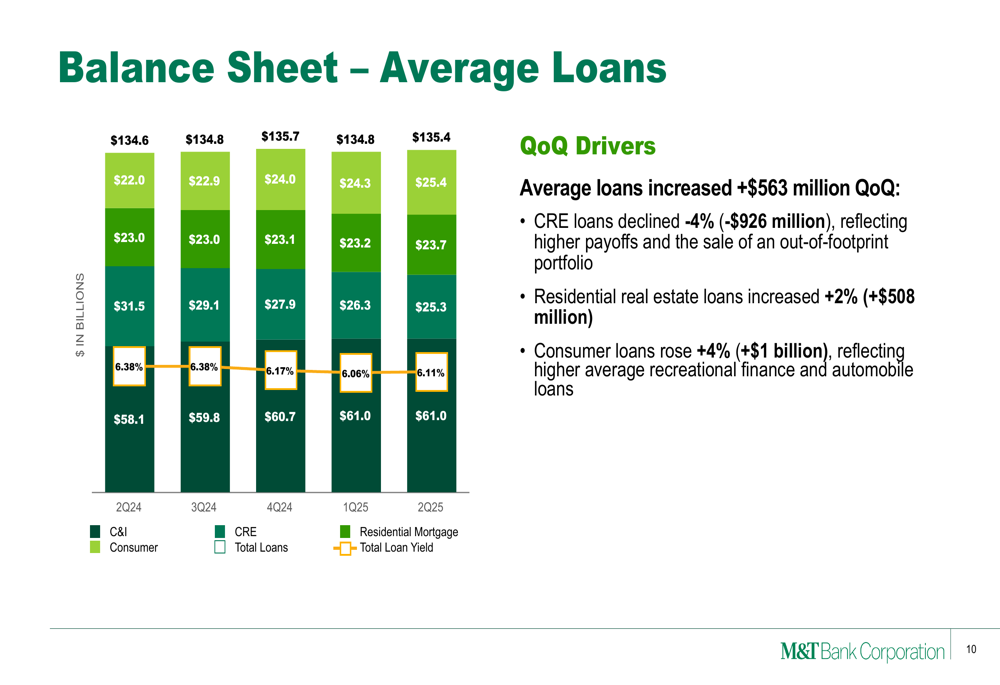
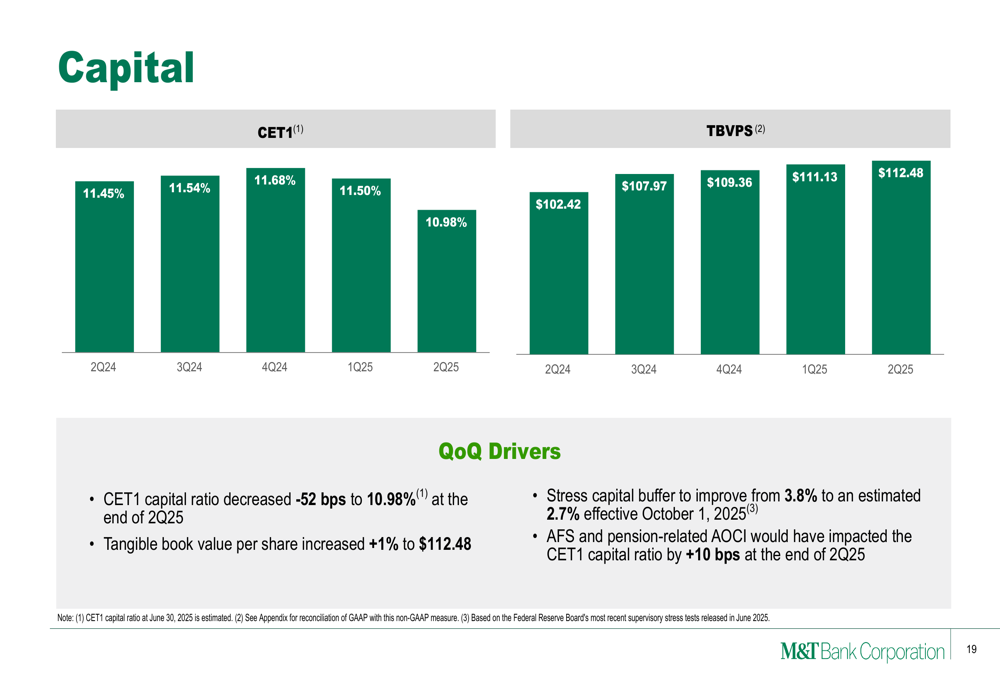
The bank maintained a strong balance sheet with total average loans of $135.4 billion, relatively unchanged from the previous quarter but up 1% year-over-year. Average deposits increased by $2.2 billion or 1% quarter-over-quarter to $163.4 billion. The bank’s capital position remained solid with a Common Equity Tier 1 (CET1) capital ratio of 10.98%, though this was down 52 basis points from the previous quarter, primarily due to $1.1 billion in share repurchases during Q2.
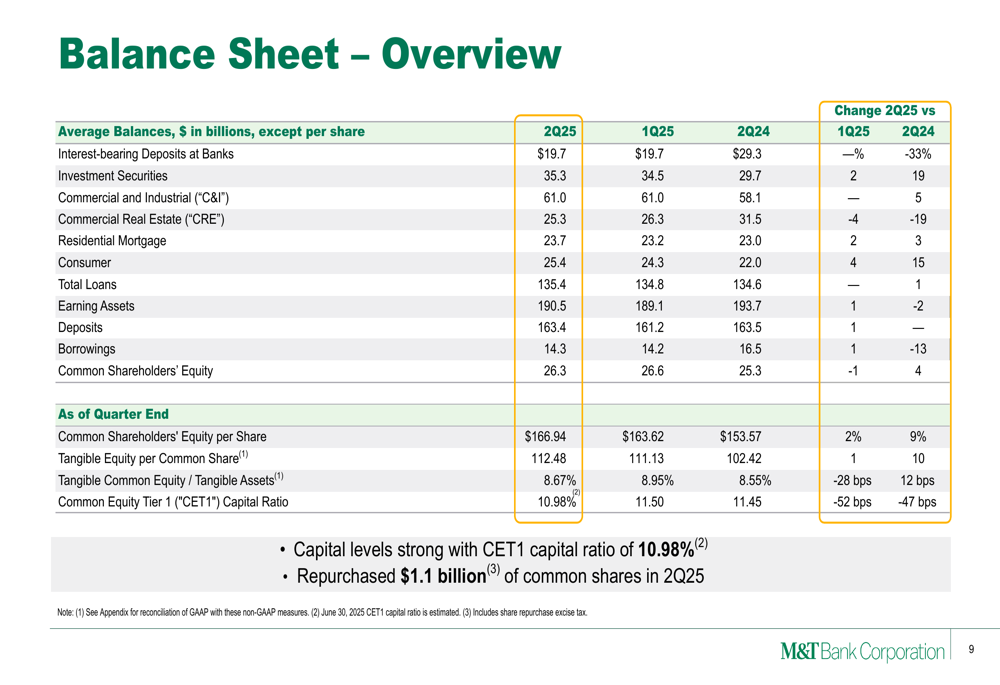
Looking at the loan portfolio composition, commercial and industrial (C&I) loans remained stable, while commercial real estate (CRE) loans declined by 4% or $926 million quarter-over-quarter. This reduction reflected higher payoffs and the sale of an out-of-footprint portfolio. Meanwhile, residential real estate loans increased by 2% ($508 million) and consumer loans rose by 4% ($1 billion).
Noninterest Income and Expenses
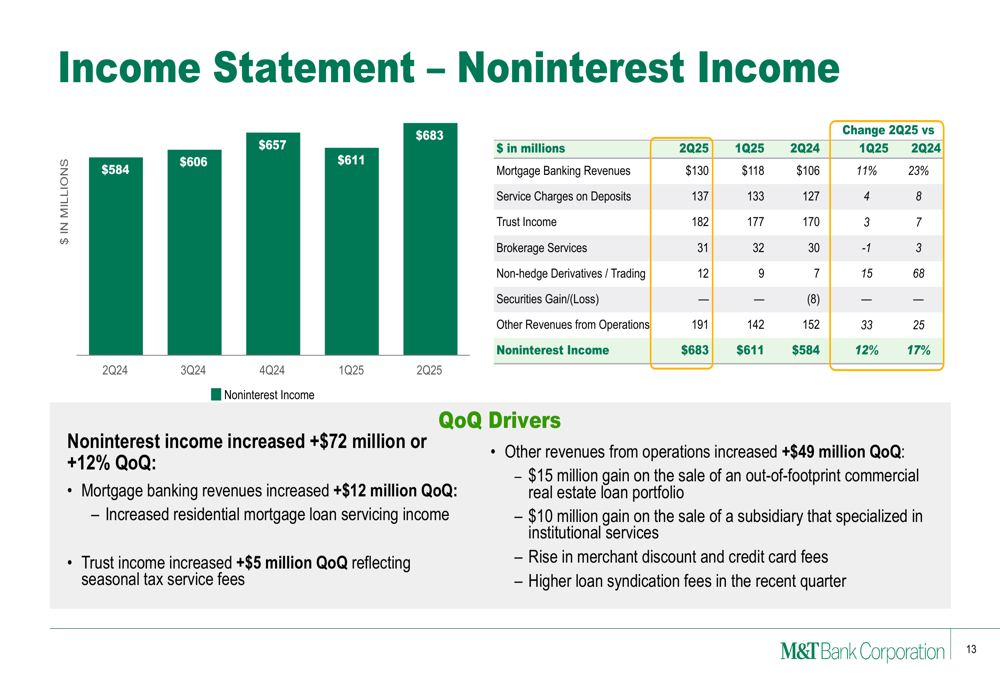
Noninterest income showed strong growth, increasing by $72 million or 12% quarter-over-quarter to $683 million. This improvement was driven by increases across multiple revenue streams, including mortgage banking revenues (+$12 million) and trust income (+$5 million).
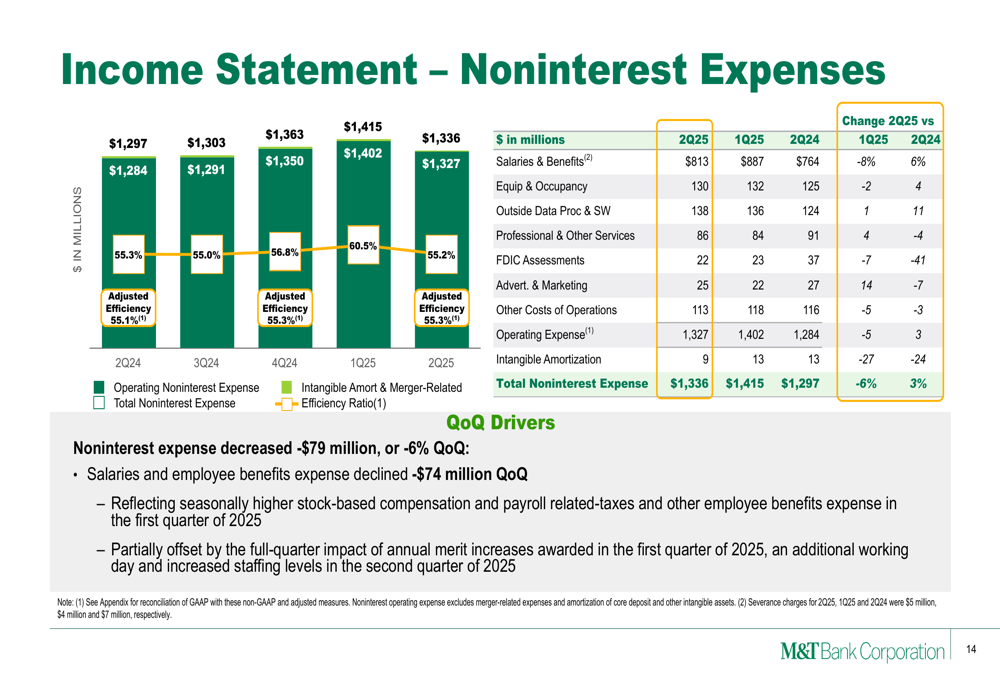
On the expense side, M&T Bank demonstrated effective cost management with noninterest expenses decreasing by $79 million or 6% quarter-over-quarter to $1,336 million. The reduction was primarily driven by a $74 million decline in salaries and employee benefits expenses.
Credit Quality and Risk Management
M&T Bank continued to show improvement in credit quality metrics during Q2 2025. Net charge-offs declined to $108 million or 0.32% of average loans, down from $114 million (0.34%) in Q1 2025 and $137 million (0.41%) in Q2 2024. Nonaccrual loans increased slightly to $1,573 million or 1.16% of loans, compared to $1,540 million (1.14%) in the previous quarter, but remained well below the $2,024 million (1.50%) reported a year ago.
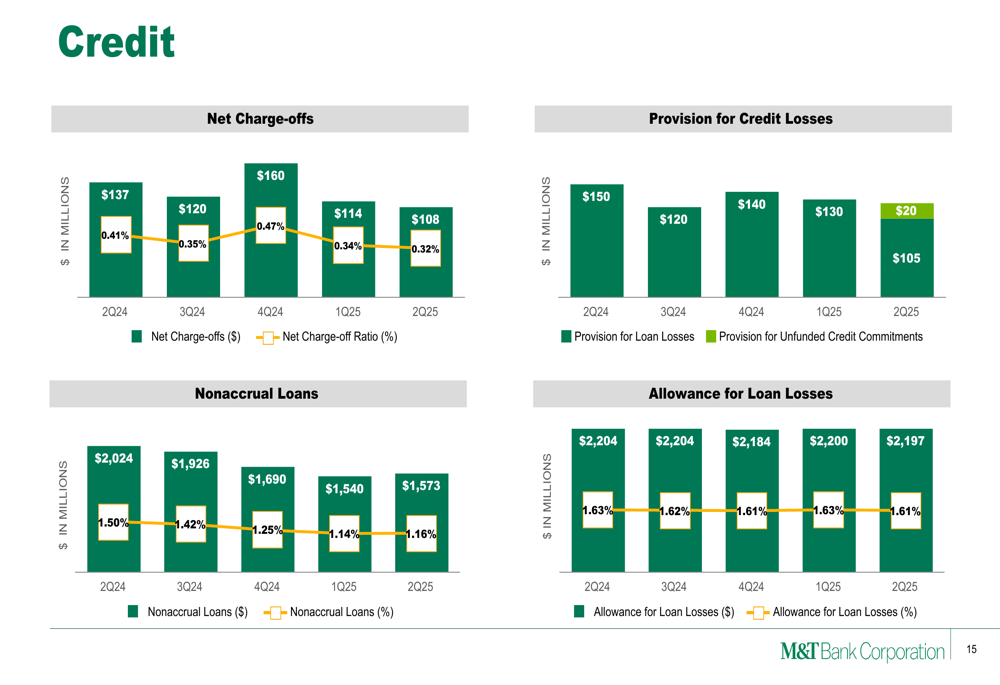
The provision for credit losses decreased to $125 million from $130 million in Q1 2025 and $150 million in Q2 2024, reflecting the bank’s confidence in its loan portfolio quality. The allowance for loan losses stood at $2,197 million or 1.61% of loans, compared to $2,200 million (1.63%) in the previous quarter.
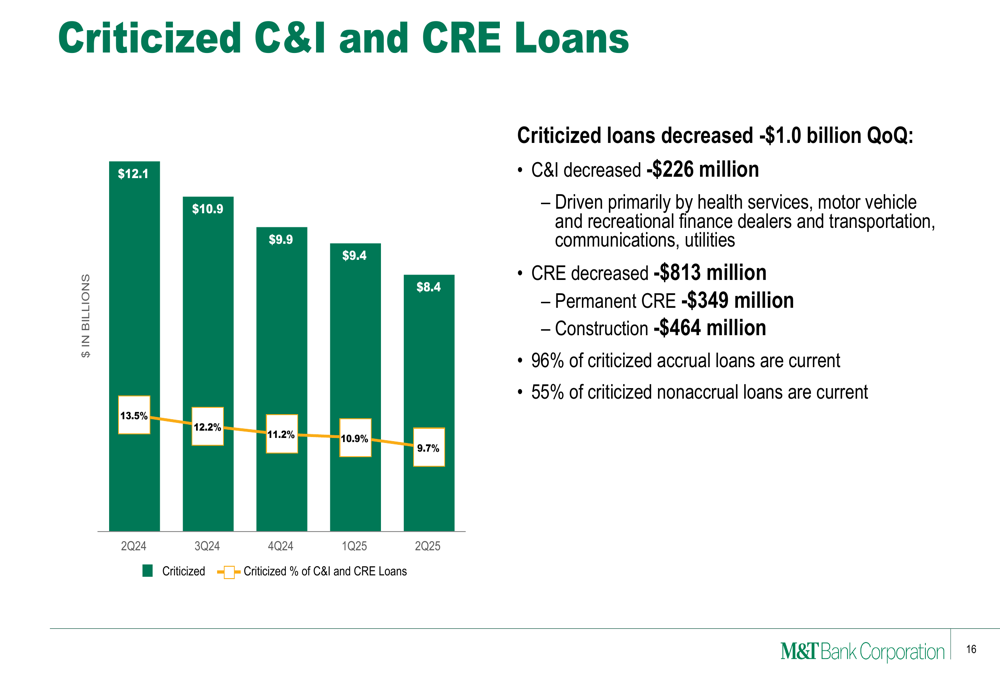
Criticized commercial loans continued their downward trend, decreasing by $1.0 billion quarter-over-quarter to $8.4 billion or 9.7% of commercial loans. This improvement was driven by decreases in both C&I (-$226 million) and CRE (-$813 million) criticized loans.
Strategic Initiatives and Outlook
M&T Bank outlined four strategic priorities: building its New England and Long Island markets, optimizing resources through simplification, making systems and processes resilient and scalable, and continuing to develop risk management capabilities.
For the full year 2025, M&T Bank provided the following guidance:
- Net Interest Income (taxable-equivalent): $7.0 billion to $7.15 billion, with net interest margin in the mid to high 3.60s
- Fee Income: $2.5 billion to $2.6 billion, with continued strength in trust and mortgage
- GAAP Expense: $5.4 billion to $5.5 billion, trending toward the low end of the range
- Net Charge-Offs: less than 40 basis points
- Loans: $135 billion to $137 billion
- Deposits: $162 billion to $164 billion
- CET1 Capital Ratio: 10.75% to 11.00%
The bank also highlighted its capital position, noting that its tangible book value per share increased by 1% quarter-over-quarter and 10% year-over-year to $112.48. Additionally, the stress capital buffer is expected to improve from 3.8% to an estimated 2.7% effective October 1, 2025.
M&T Bank emphasized its value proposition for investors, highlighting its purpose-driven organization, successful and sustainable business model, and strong shareholder returns. The bank targets a 15-17% return on tangible common equity (ROTCE), robust dividend growth, and 8% tangible book value per share growth.
Overall, M&T Bank’s Q2 2025 presentation demonstrates a strong recovery from its Q1 performance, with significant improvements across key financial metrics and continued focus on strategic initiatives while maintaining strong credit quality.
Full presentation:
This article was generated with the support of AI and reviewed by an editor. For more information see our T&C.