AirNet Technology raises $180 million in digital assets offering

Introduction & Market Context
NetApp Inc (NASDAQ:NTAP) released its first quarter fiscal year 2026 earnings presentation on August 27, 2025, revealing modest revenue growth amid continued expansion in its strategic cloud and AI initiatives. The data infrastructure company reported results largely in line with guidance, while highlighting its achievement of the top market position in the All-Flash storage segment.
Despite beating earnings expectations in the previous quarter, NetApp’s stock has shown volatility, trading at $109.41 at market close on the day of the earnings release, well below its 52-week high of $135.45 but significantly above its 52-week low of $71.84.
The company continues to position itself as "The Intelligent Data Infrastructure Company," emphasizing its evolution from data storage to comprehensive data management across hybrid multicloud environments, with increasing focus on AI workloads.
Quarterly Performance Highlights
NetApp reported Q1 FY26 revenue of $1.56 billion, representing a 1.2% year-over-year increase and falling within the company’s guidance range of $1.455-1.605 billion. Billings showed stronger growth at 4.3% year-over-year, reaching $1.51 billion.
As shown in the following financial summary, the company delivered results within its guided ranges across all key metrics:
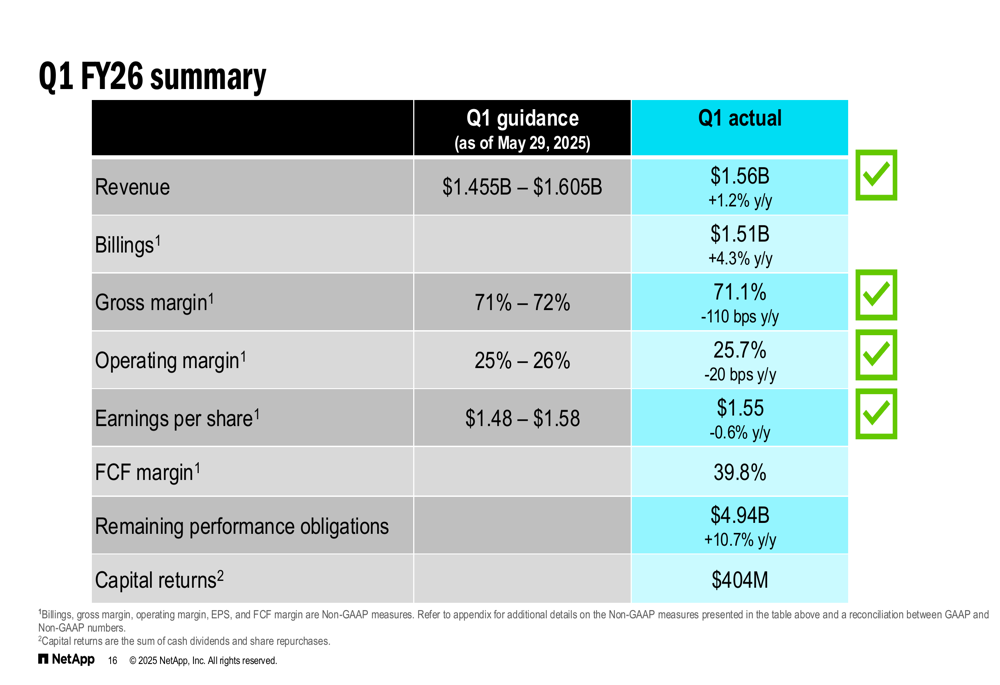
Non-GAAP earnings per share came in at $1.55, down 0.6% year-over-year but within the guided range of $1.48-1.58. Operating margin was 25.7%, showing a slight decline of 20 basis points from the previous year.
A significant highlight was NetApp’s cash generation, with record Q1 cash flow from operations of $673 million and free cash flow of $620 million, resulting in an impressive free cash flow margin of 39.8%.
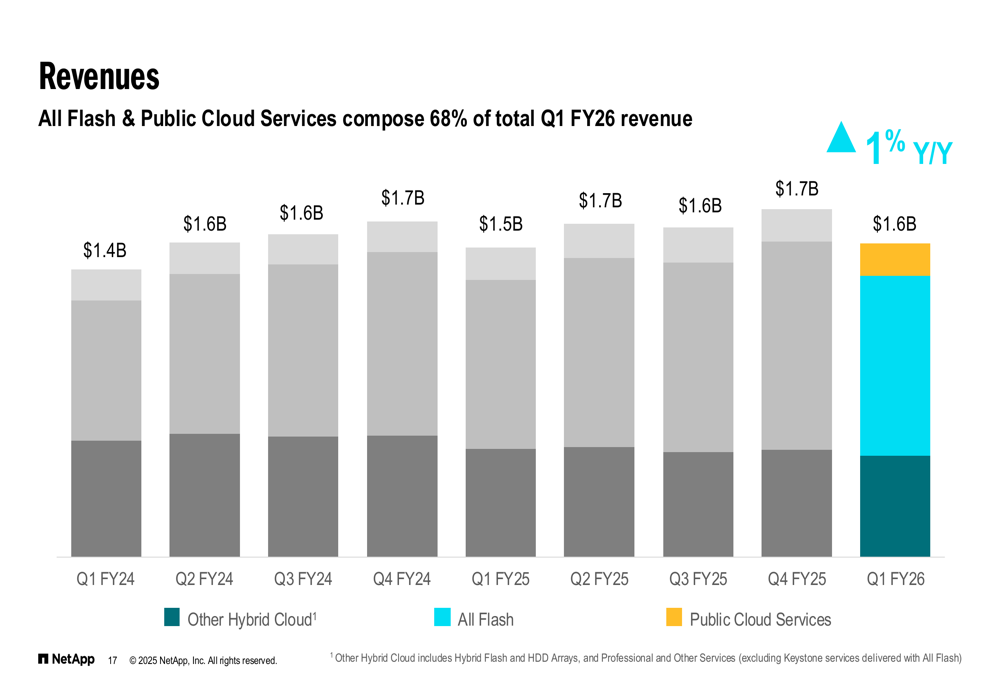
The revenue breakdown shows that All Flash and Public Cloud Services now compose 68% of total revenue, reflecting the company’s strategic shift toward higher-growth segments:
Detailed Financial Analysis
NetApp’s All Flash Array business continued to show solid growth, with an annualized revenue run rate of $3.6 billion, representing a 6% year-over-year increase. This performance helped the company achieve the #1 market share position in the All-Flash market for calendar Q1 2025.
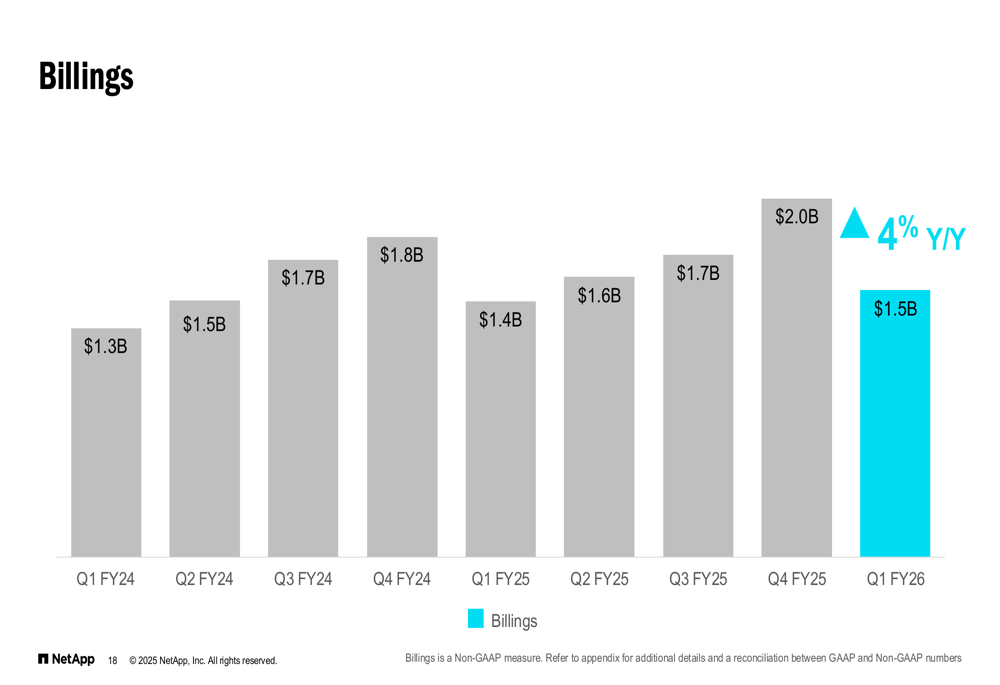
Billings growth outpaced revenue growth, suggesting potential for stronger revenue performance in future quarters:
One of the most notable improvements was in the Public Cloud segment, where gross margin jumped significantly from 66.9% in Q1 FY24 to 80.1% in Q1 FY26, even as revenue grew modestly from $154 million to $161 million:
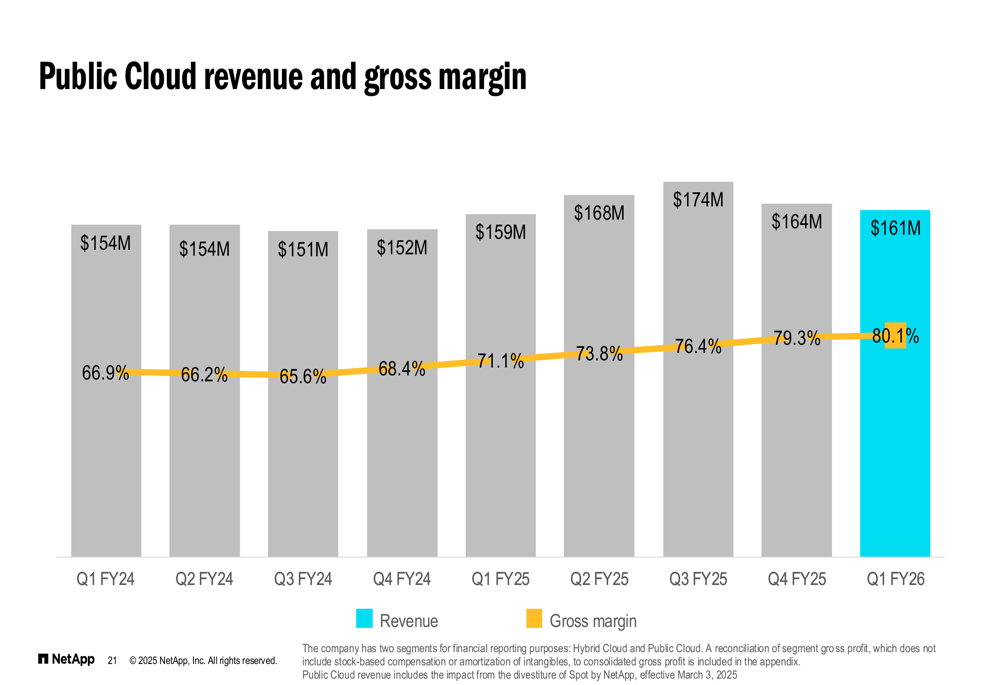
This dramatic margin improvement led NetApp to raise its long-term target range for Public Cloud Services gross margin to 80-85%, signaling confidence in the sustainability of these efficiency gains.
Meanwhile, the company’s Hybrid Cloud segment, which still accounts for the majority of revenue at $1.4 billion, saw its gross margin decline slightly from 71.1% to 70.0% year-over-year.
Strategic Initiatives in AI and Cloud
NetApp continues to expand its strategic positioning across key markets, with particular emphasis on Flash, Block, Cloud, and AI infrastructure. The company’s presentation highlighted its competitive advantages in each of these areas:
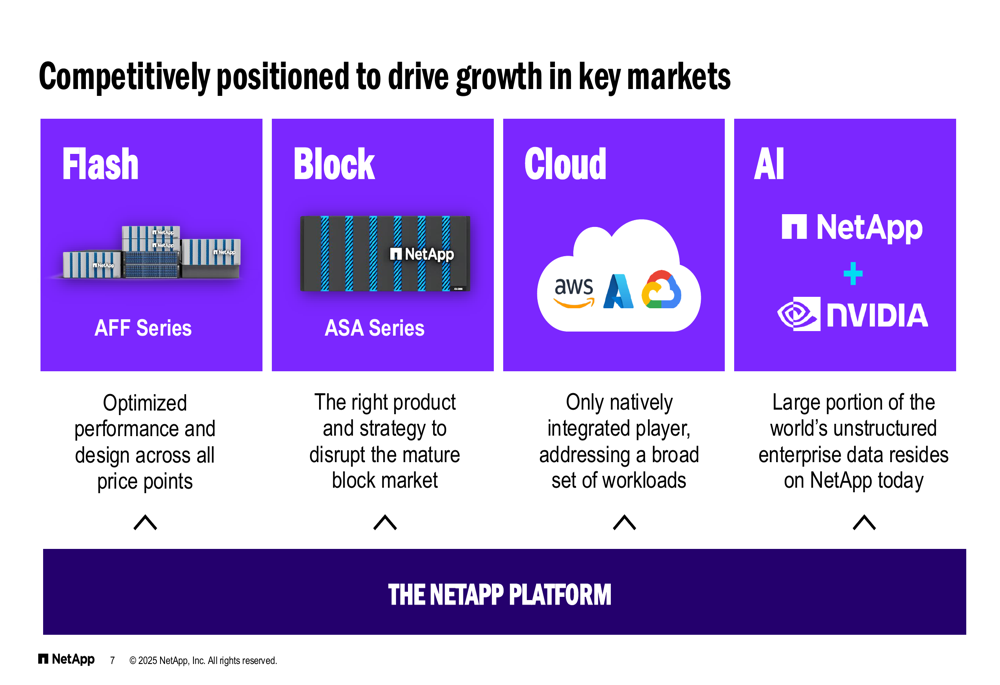
In the AI space, NetApp announced the introduction of the AIPod Mini with Intel, designed to service departmental and team-level AI deployments. The company also expanded its partnership with NVIDIA, implementing deeper integrations and a validated reference architecture for NVIDIA Cloud Partners.
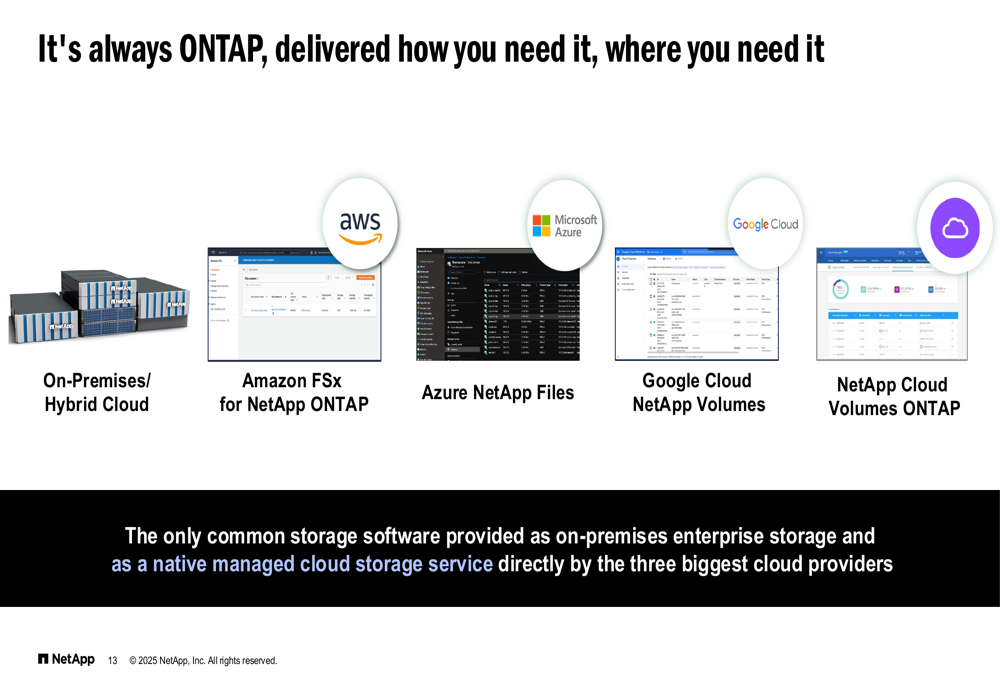
The company’s cloud strategy centers around its ONTAP data management software, which is available both on-premises and as native managed cloud storage services across all major cloud providers:
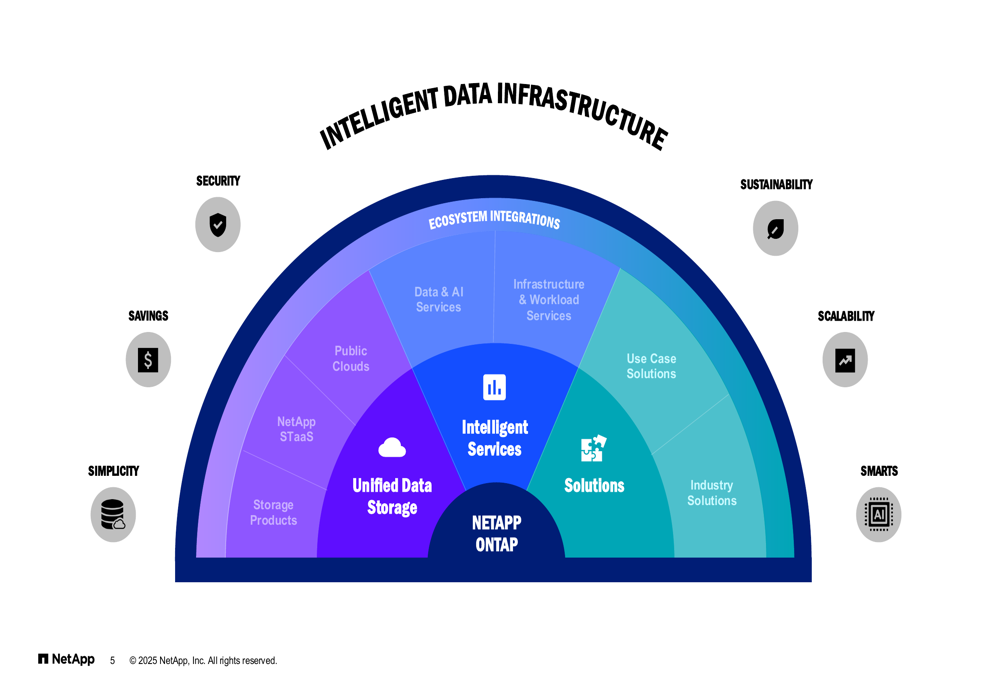
NetApp’s Intelligent Data Infrastructure ecosystem integrates various components including security, savings, simplicity, smart features, and sustainability, all centered around its core ONTAP platform:
Forward-Looking Statements
Looking ahead to Q2 FY26, NetApp provided the following guidance:
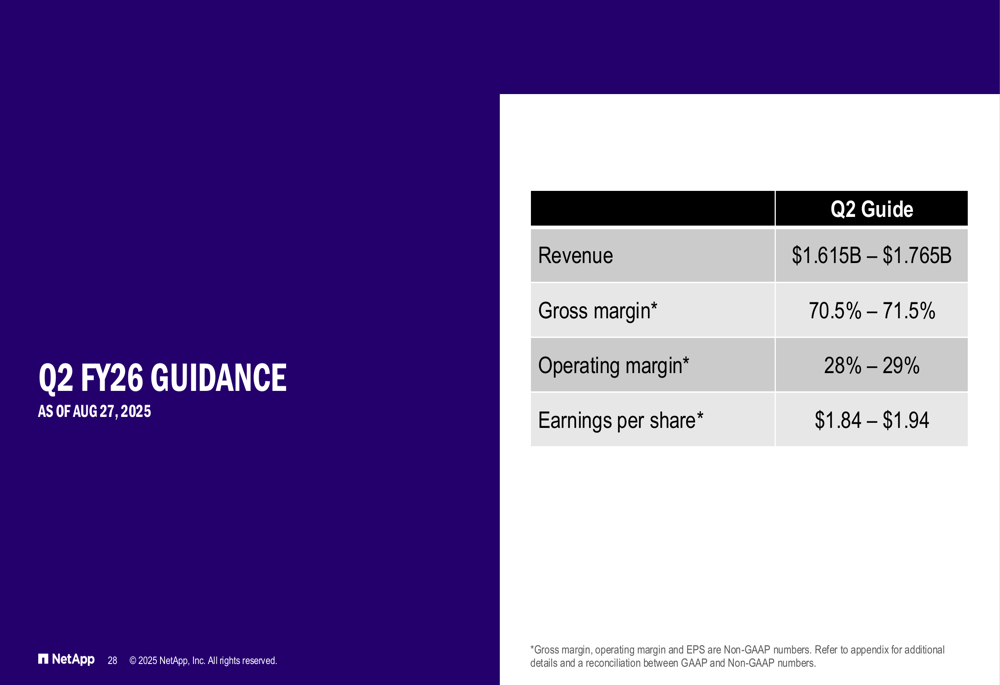
The company expects revenue between $1.615-1.765 billion, with gross margin in the range of 70.5-71.5% and operating margin between 28-29%. Earnings per share are projected to be $1.84-1.94.
NetApp also reaffirmed its full-year FY26 guidance:
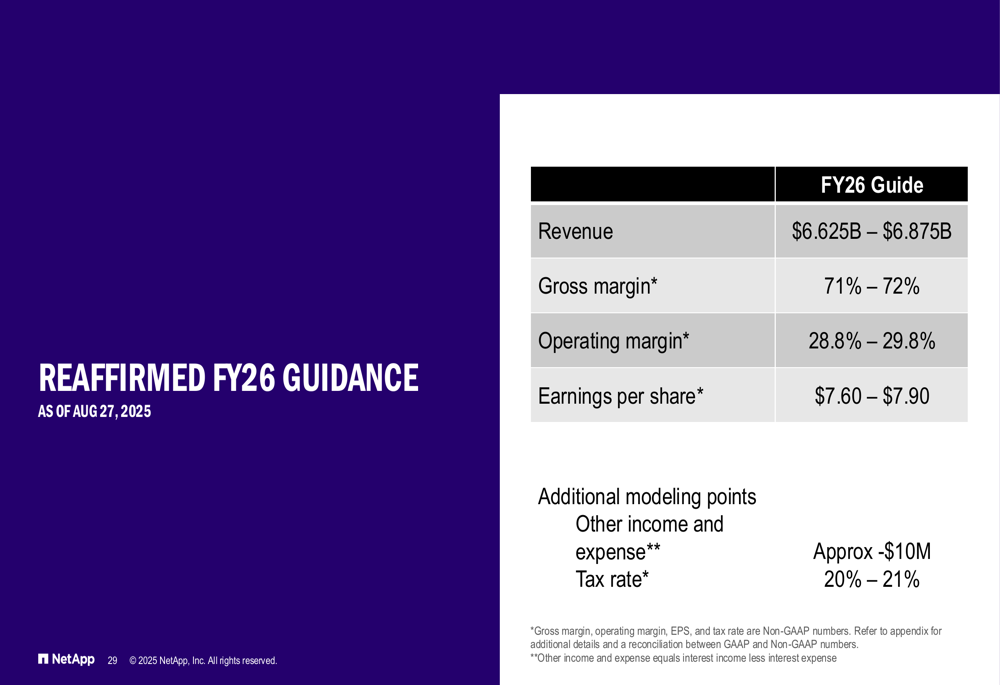
For the full fiscal year, the company continues to project revenue of $6.625-6.875 billion, gross margin of 71-72%, operating margin of 28.8-29.8%, and earnings per share of $7.60-7.90.
These projections suggest NetApp expects improved performance in the coming quarters, with higher margins and earnings per share compared to Q1 results. The company’s continued investment in AI infrastructure and cloud services, combined with its market leadership in All-Flash storage, positions it to capitalize on enterprise digital transformation initiatives despite the challenging macroeconomic environment.
Full presentation:
This article was generated with the support of AI and reviewed by an editor. For more information see our T&C.