Asia FX cautious amid US govt shutdown; yen tumbles after Takaichi’s LDP win

Introduction & Market Context
NETSTREIT Corp (NYSE:NTST) released its Q1 2025 investor presentation highlighting the company’s continued focus on defensive retail sectors and high-quality tenants. The net lease REIT maintains a 99.9% occupancy rate across its portfolio of 695 properties spanning 45 states. The stock has shown recent momentum, with premarket trading indicating a 5.37% increase to $16.49, building on its previous close of $15.65.
The company’s presentation comes after a mixed Q4 2024 performance where NETSTREIT missed EPS expectations but exceeded revenue forecasts. The current presentation emphasizes the REIT’s strategic positioning in necessity-based retail and its ability to source investments at attractive yields.
Portfolio Highlights
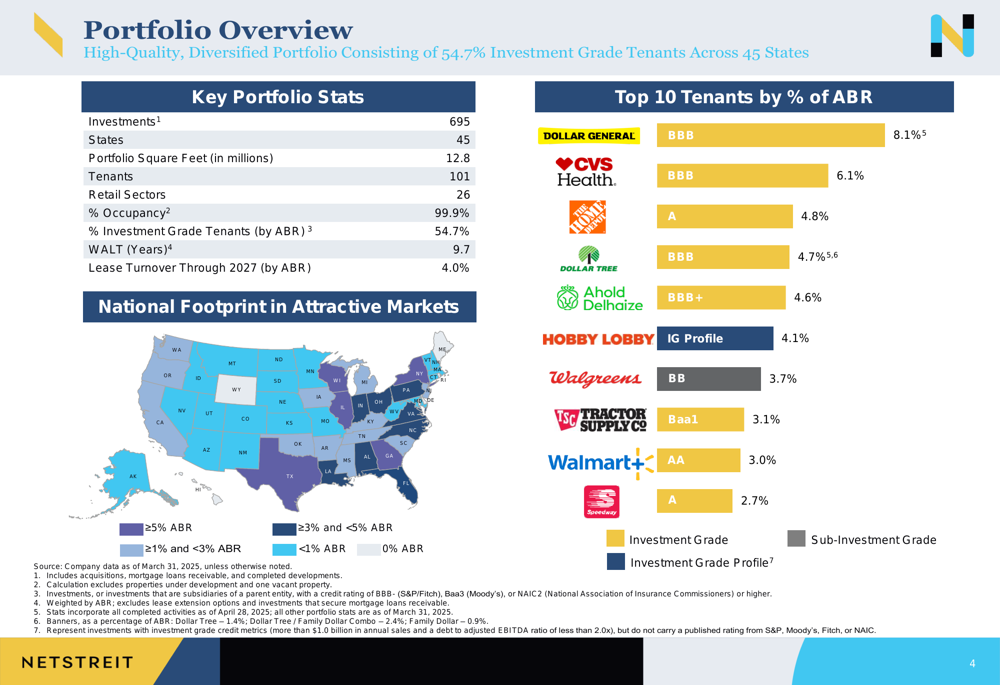
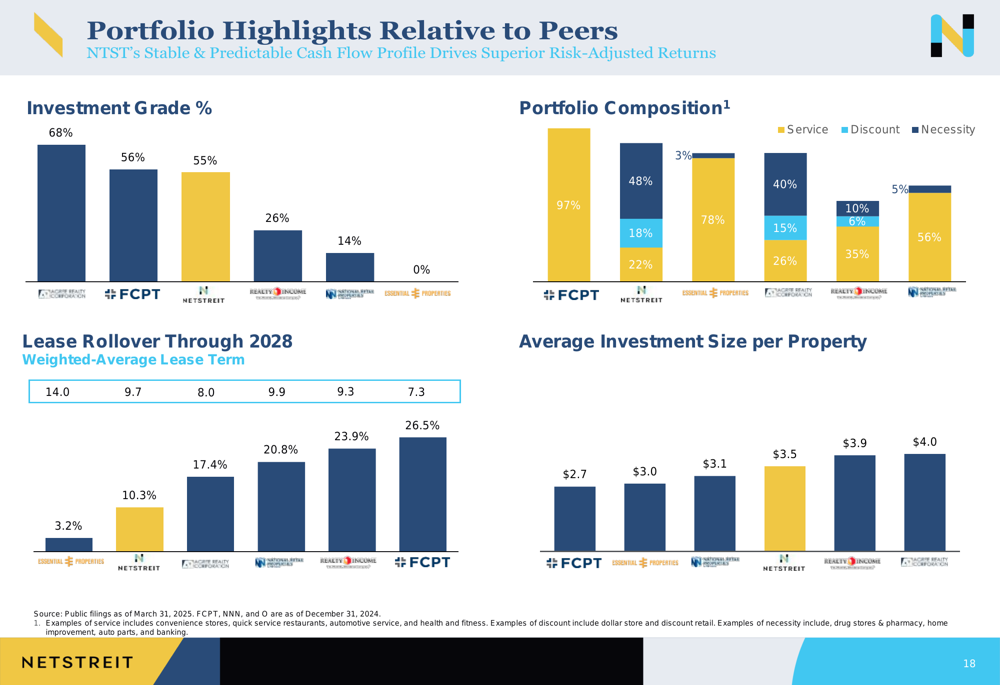
NETSTREIT’s portfolio demonstrates a strong focus on defensive retail sectors with high tenant credit quality. The company reports that 71% of its portfolio consists of Investment Grade (IG) and Investment Grade Profile (IGP) tenants, with 54.7% being formally rated Investment Grade.
As shown in the following portfolio overview, the company maintains a well-diversified tenant base with a weighted average lease term (WALT) of 9.7 years:
The portfolio is strategically concentrated in defensive retail sectors, with 47.8% in necessity retail, 18.2% in discount retail, and 21.7% in service-oriented businesses. This focus on recession-resistant sectors is illustrated in the following breakdown:
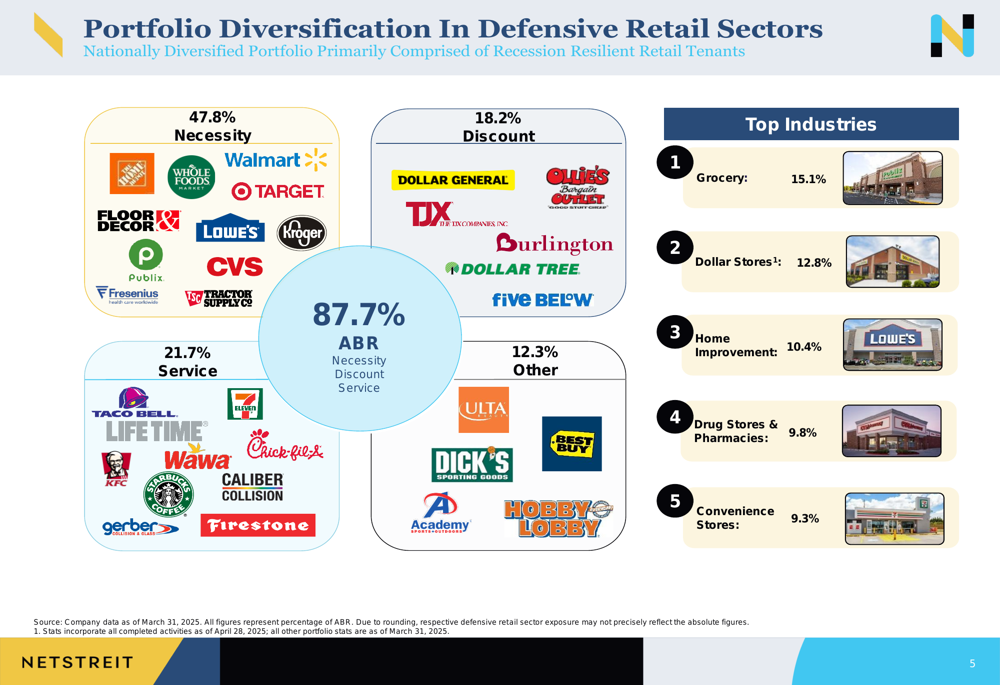
The top five industries represented in the portfolio include grocery (15.1%), dollar stores (12.8%), home improvement (10.4%), drug stores & pharmacies (9.8%), and convenience stores (9.3%). Major tenants include Dollar General (NYSE:DG) (8.1% of ABR), CVS Health (NYSE:CVS) (6.1%), The Home Depot (NYSE:HD) (4.8%), Dollar Tree (NASDAQ:DLTR) (4.7%), and Ahold Delhaize (4.6%).
Q1 2025 Financial Performance
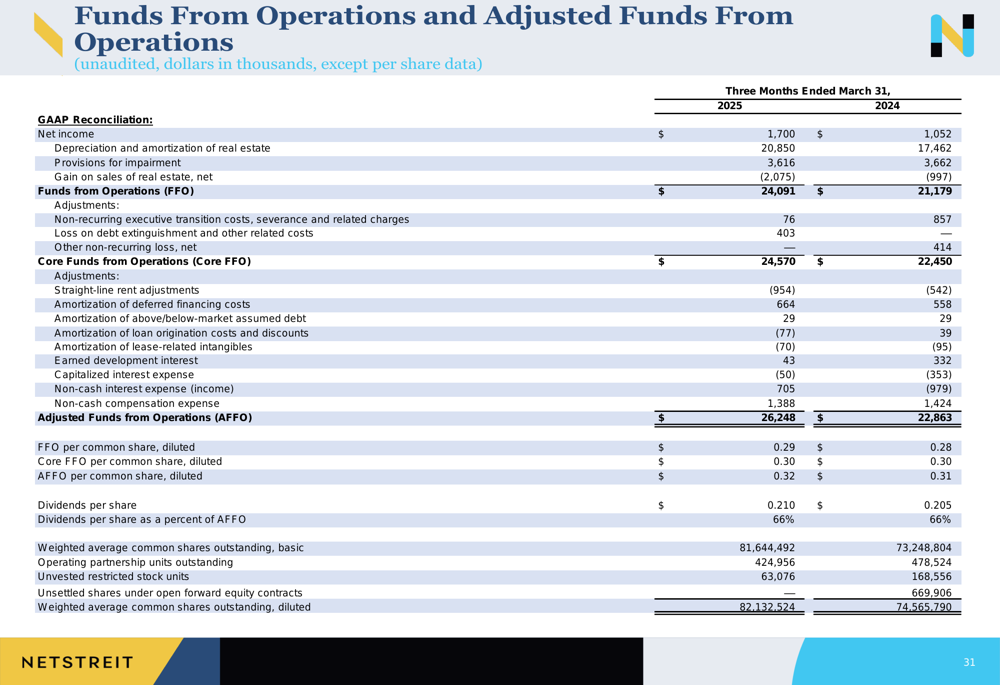
For Q1 2025, NETSTREIT reported rental revenue of $42.59 million and net income attributable to common stockholders of $1.69 million. The company’s Adjusted Funds From Operations (AFFO) reached $26.25 million, representing a significant portion of its financial performance metrics.
The following table details the company’s FFO and AFFO performance:
NETSTREIT’s investment activity remained robust in Q1 2025, with $90.7 million in gross investments across 25 properties at an average investment of $3.63 million per property. These new investments were secured at a cash cap rate of 7.7%, with 65.9% of the investments rated as Investment Grade or Investment Grade Profile.
The company also engaged in strategic disposition activity, selling $40.29 million worth of properties in Q1 2025 at a 7.3% cash cap rate. This active portfolio management approach has resulted in the disposition of 155 properties totaling $398 million since the company’s inception.
Strategic Positioning
NETSTREIT emphasizes its consistent investment approach focused on defensive tenancy in necessity-based and e-commerce-resistant retail industries. The company targets granular assets in the $1-10 million range within a highly fragmented, undercapitalized market segment.
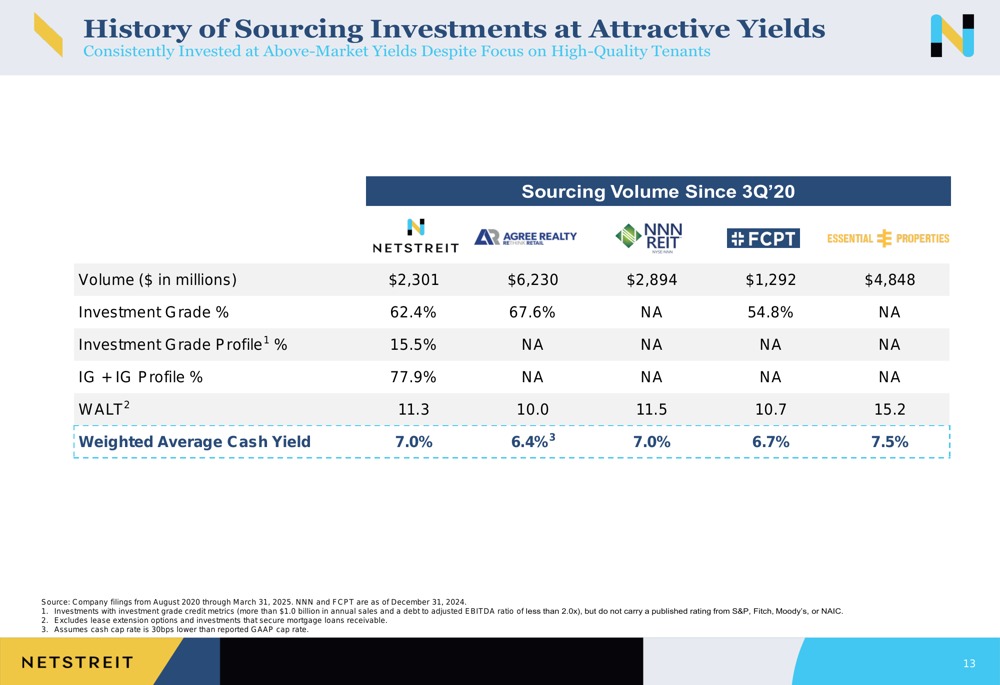
As illustrated in the following comparison, NETSTREIT has demonstrated a strong history of sourcing investments at attractive yields relative to its peers:
The company’s portfolio metrics compare favorably to peers across several dimensions, including investment grade percentage and portfolio composition:
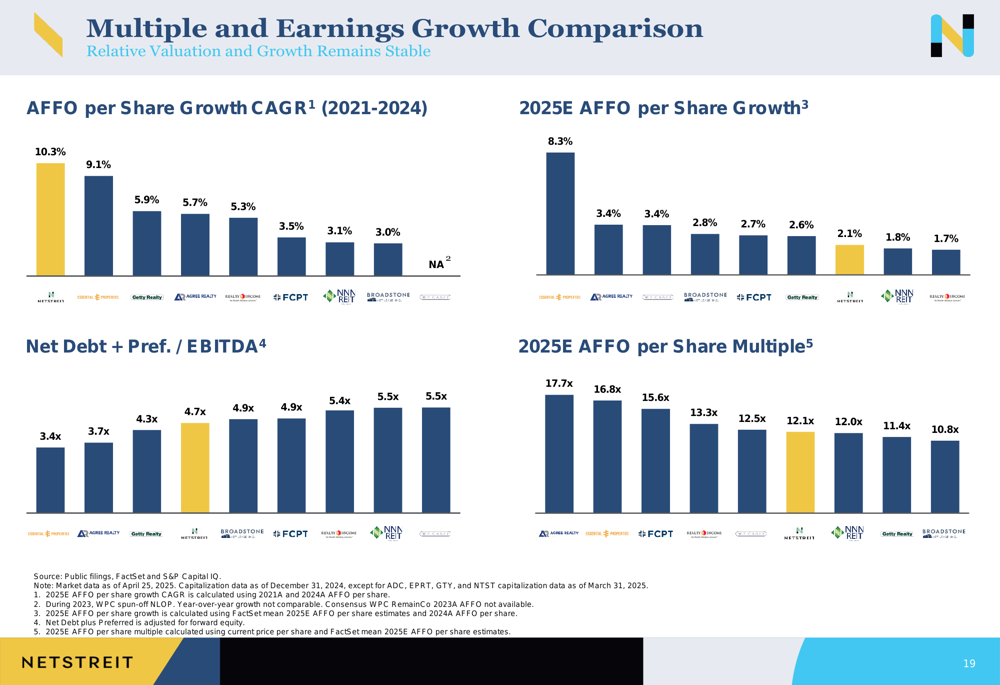
NETSTREIT’s AFFO growth and valuation multiples also position it competitively within the net lease REIT sector:
Balance Sheet & Liquidity
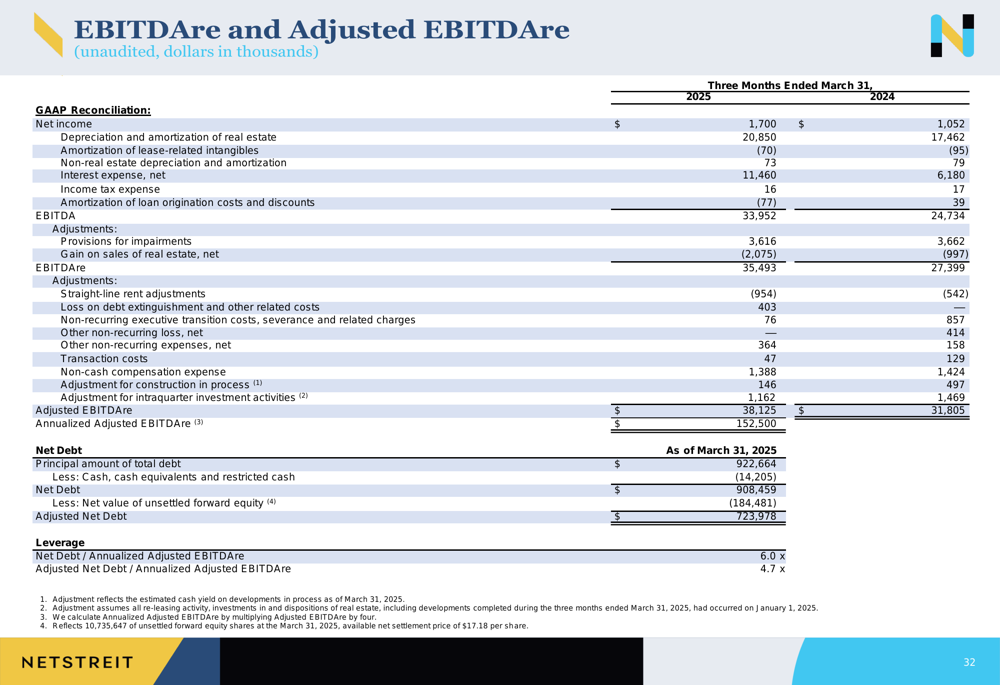
The company maintains a conservative balance sheet with $584 million in total liquidity, including $184.5 million of unsettled forward equity. NETSTREIT reports a leverage ratio of 4.7x Adjusted Net Debt to Annualized Adjusted EBITDAre, with no debt maturities until 2028.
The following chart illustrates the company’s EBITDAre metrics and leverage position:
This conservative financial approach provides NETSTREIT with significant flexibility for future investments while maintaining a defensive position against market volatility.
Forward Outlook
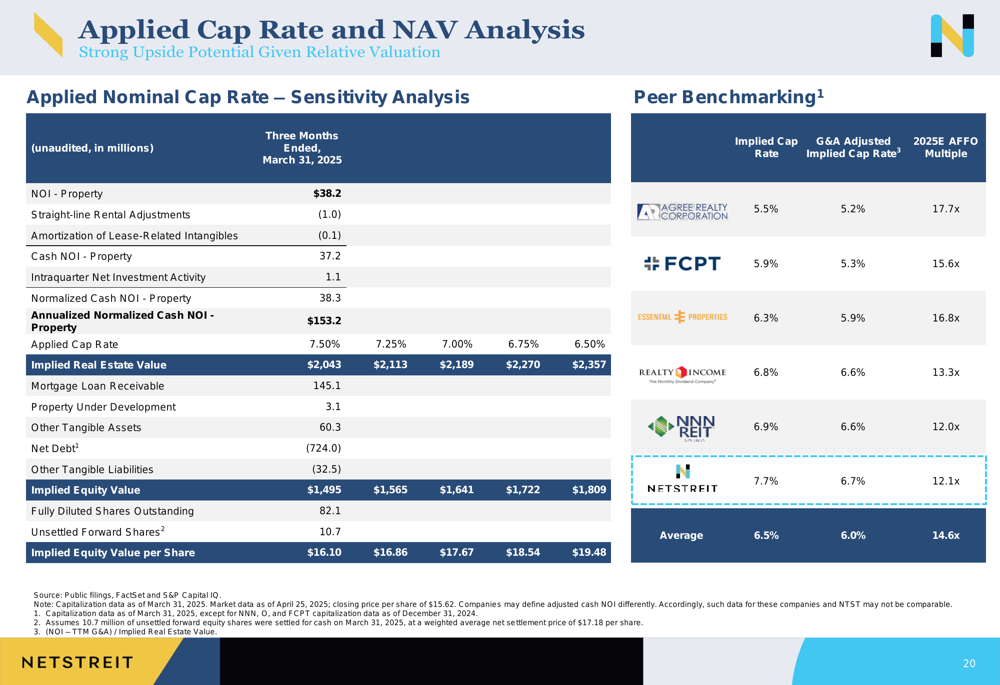
NETSTREIT’s valuation analysis suggests potential upside based on applied cap rates, as shown in the following sensitivity analysis:
Based on the earnings article from Q4 2024, the company has provided AFFO per share guidance for 2025 between $1.27 and $1.30, with planned net investment activity of $75-125 million. The company expects to maintain its quarterly dividend of $0.21 per share, reflecting a stable AFFO payout ratio.
The presentation highlights NETSTREIT’s continued focus on defensive retail sectors, high-quality tenants, and disciplined investment approach as key drivers of future performance. With its strong liquidity position and well-staggered debt maturity profile, the company appears positioned to navigate the current retail landscape while pursuing accretive investment opportunities.
Full presentation:
This article was generated with the support of AI and reviewed by an editor. For more information see our T&C.