IonQ CRO Alameddine Rima sells $4.6m in shares

Introduction & Market Context
Omda AS (OMDA) shares climbed 4.54% to 48.4 on November 14, 2025, following the company's Q3 2025 presentation that highlighted record profitability and strong revenue growth. The Norwegian healthcare and emergency software provider reported a 14% year-over-year revenue increase while achieving a 30% EBITDA margin despite dilution from recent acquisitions.
The stock's positive performance brings it closer to its 52-week high of 57.4, reflecting investor confidence in Omda's business model and growth strategy. The company's presentation, delivered by CEO Sverre Flatby and CFO Einar Bonnevie, emphasized Omda's value creation journey through both organic growth and strategic acquisitions.
Quarterly Performance Highlights
Omda delivered impressive financial results in the third quarter, with total revenue growth of 14% year-over-year. The company achieved a significant milestone with a record 30% EBITDA margin, demonstrating strong operational efficiency.
As shown in the following chart highlighting the company's EBITDA margin achievement:
Organic growth reached 7%, while reported Annual Recurring Revenue (ARR) grew by 15%, indicating strong customer retention and expansion within existing accounts.
As illustrated in the revenue growth slide:
Particularly noteworthy was the 27% growth in professional services, which has become an increasingly important revenue stream for the company.
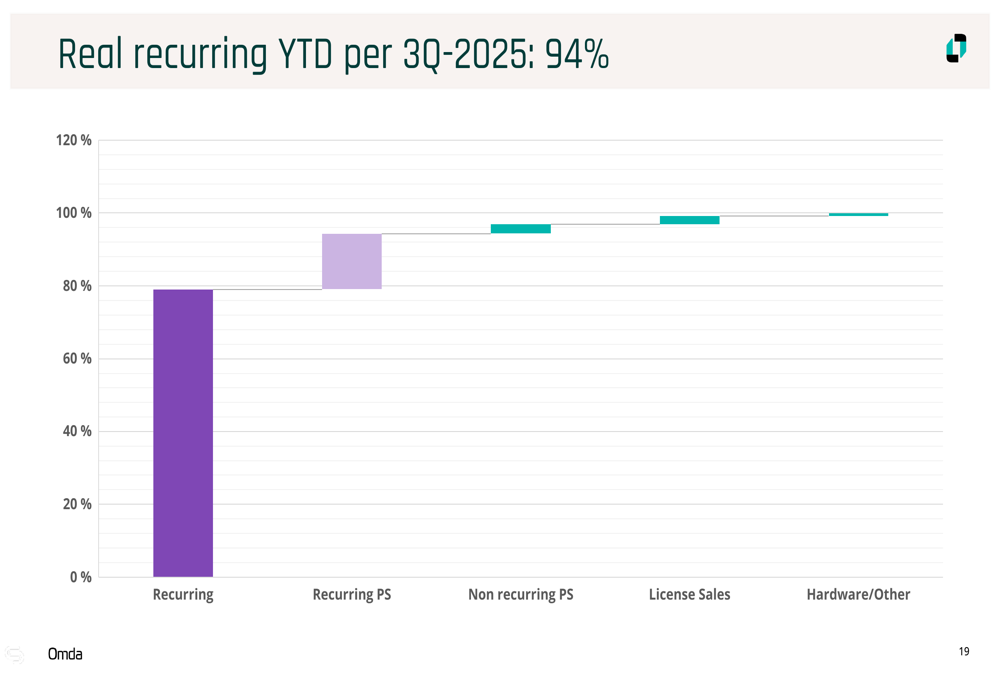
The company emphasized that its recurring revenue base extends beyond traditional software subscriptions. According to management, 94% of year-to-date revenue through Q3 2025 can be considered recurring when accounting for stable professional services relationships, with 92% of Q3 customers also being customers 12 months ago.
As shown in this breakdown of the company's recurring revenue components:
Strategic M&A Approach
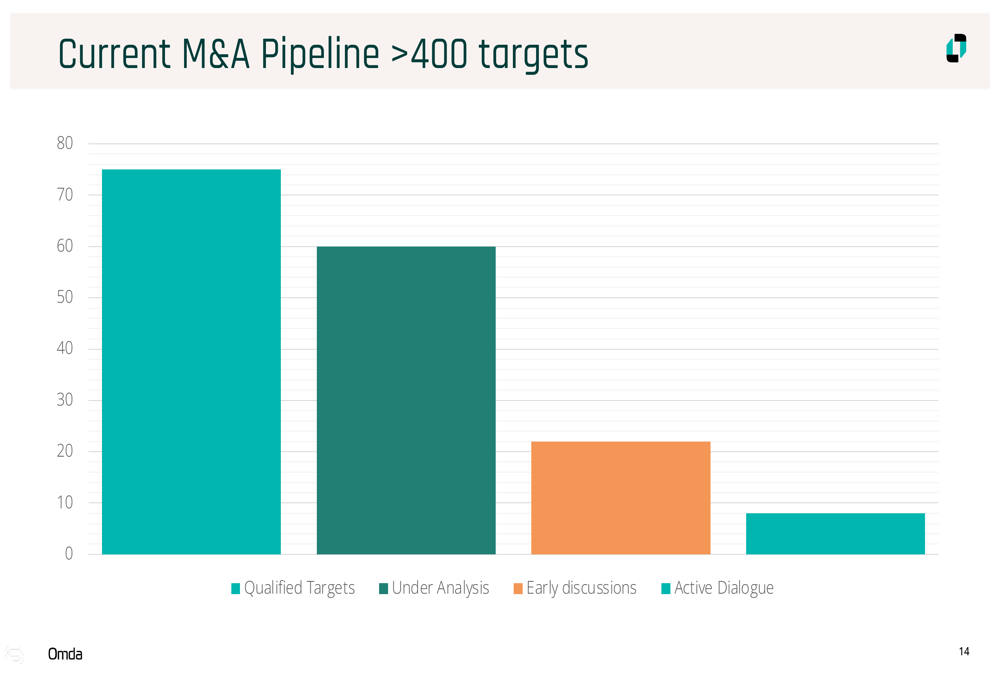
A central element of Omda's growth strategy is its "Buy, Integrate, Build" (BiB) approach to acquisitions. The company maintains an extensive M&A pipeline with over 400 potential targets at various stages of evaluation.
The following slide illustrates the company's robust M&A pipeline:
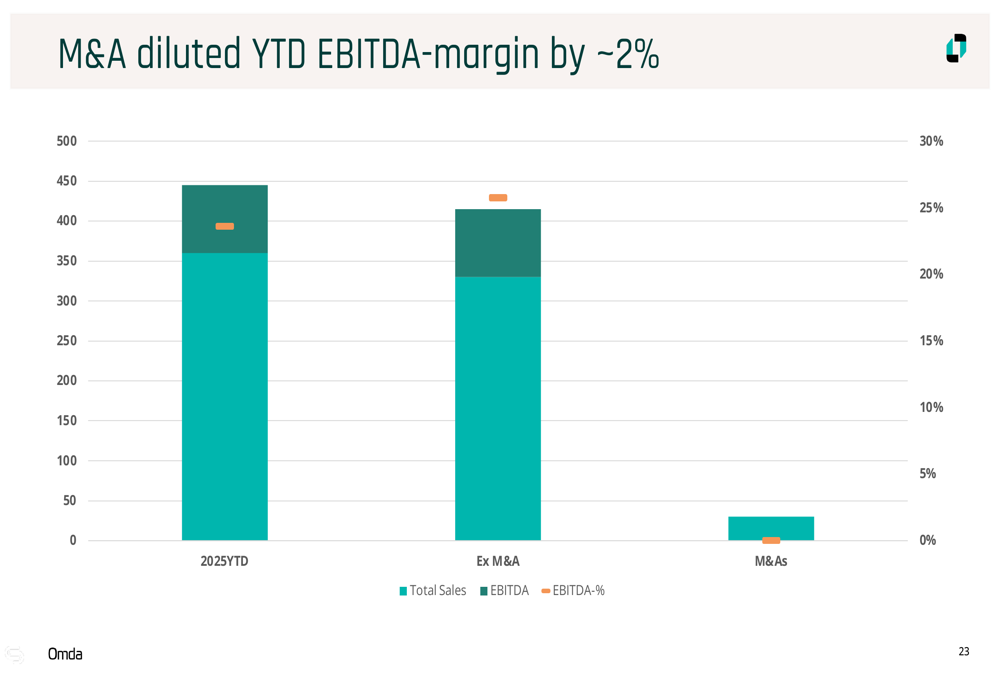
Recent acquisitions include Predicare, Dermicus, and Aweria, which closed in Q1 2025. While these acquisitions temporarily diluted the company's EBITDA margin, management explained this is part of their deliberate strategy of acquiring underperforming businesses with strong potential.
As shown in the following chart, M&A activities diluted the year-to-date EBITDA margin by approximately 2 percentage points:
The quarterly impact was even more pronounced, with M&A diluting Q3 EBITDA margin by 3 percentage points:
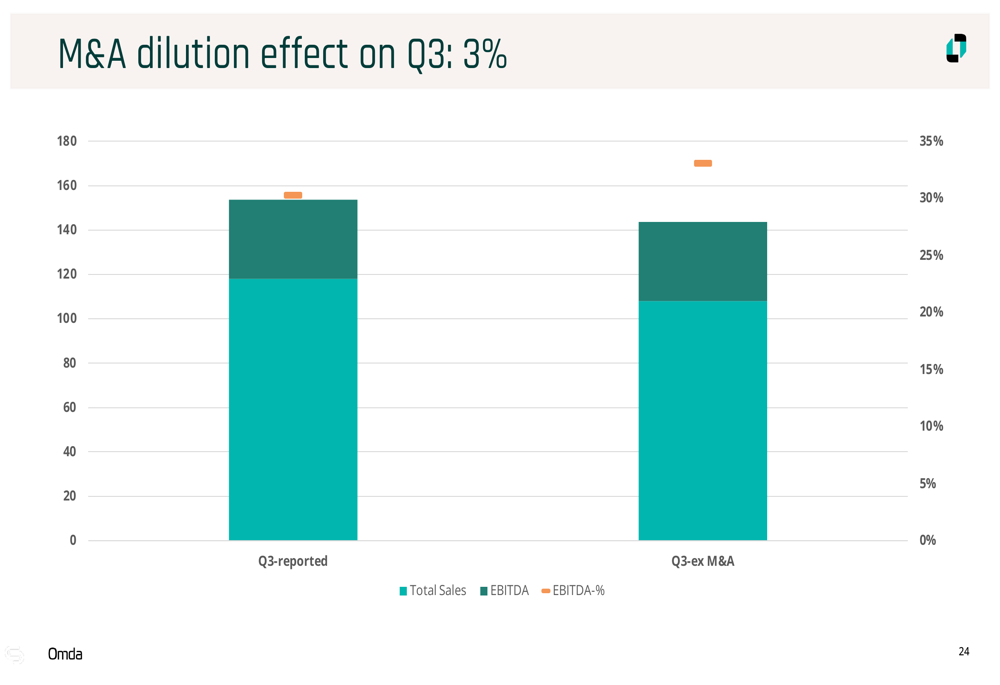
CEO Sverre Flatby defended this approach, noting that "initial underperformance is part of the business case" and that over the next 12-18 months, the company expects to bring these acquired businesses up to the same performance level as the rest of the organization. The company has successfully executed this strategy across 15 previous acquisitions.
Forward-Looking Statements
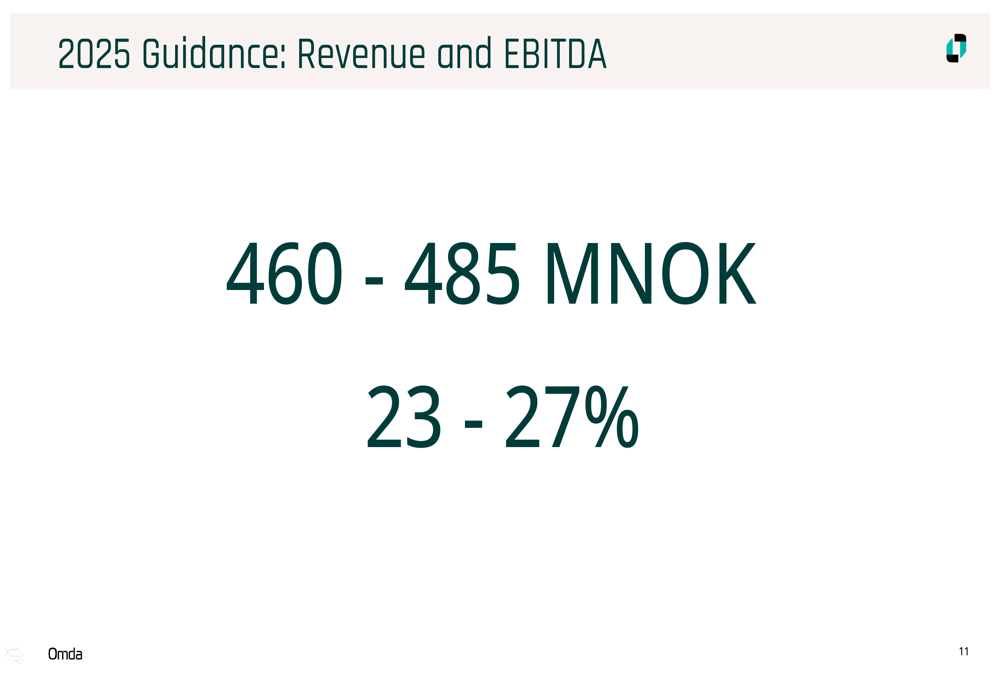
Omda provided clear guidance for both 2025 and 2026, projecting continued growth and margin expansion. For 2025, the company expects revenue between 460-485 million NOK with an EBITDA margin of 23-27%.
The 2025 guidance is illustrated in the following slide:
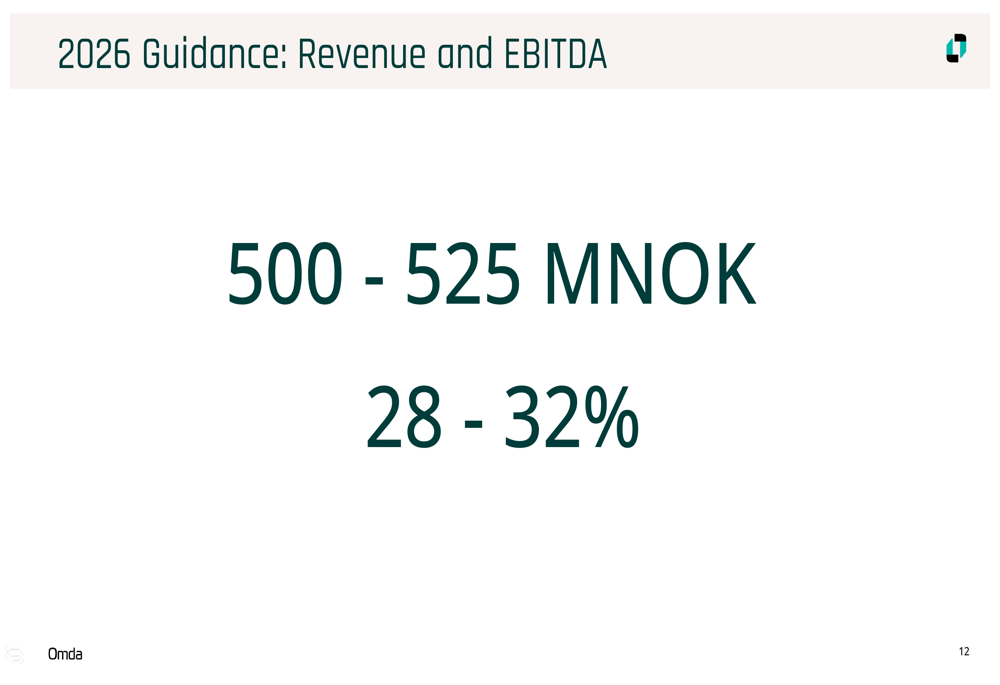
Looking further ahead to 2026, Omda projects revenue of 500-525 million NOK with an improved EBITDA margin of 28-32%, reflecting the company's confidence in its ability to integrate acquisitions and drive operational efficiencies.
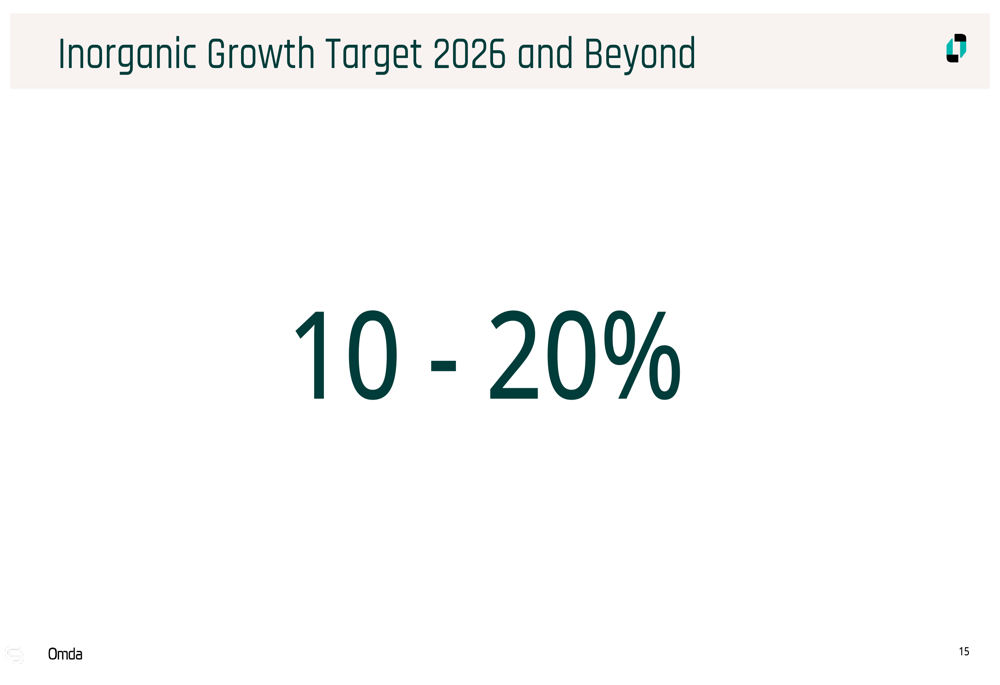
Beyond 2026, the company has set an ambitious inorganic growth target of 10-20% through continued M&A activities, complementing its organic growth strategy.
Value Creation Strategy
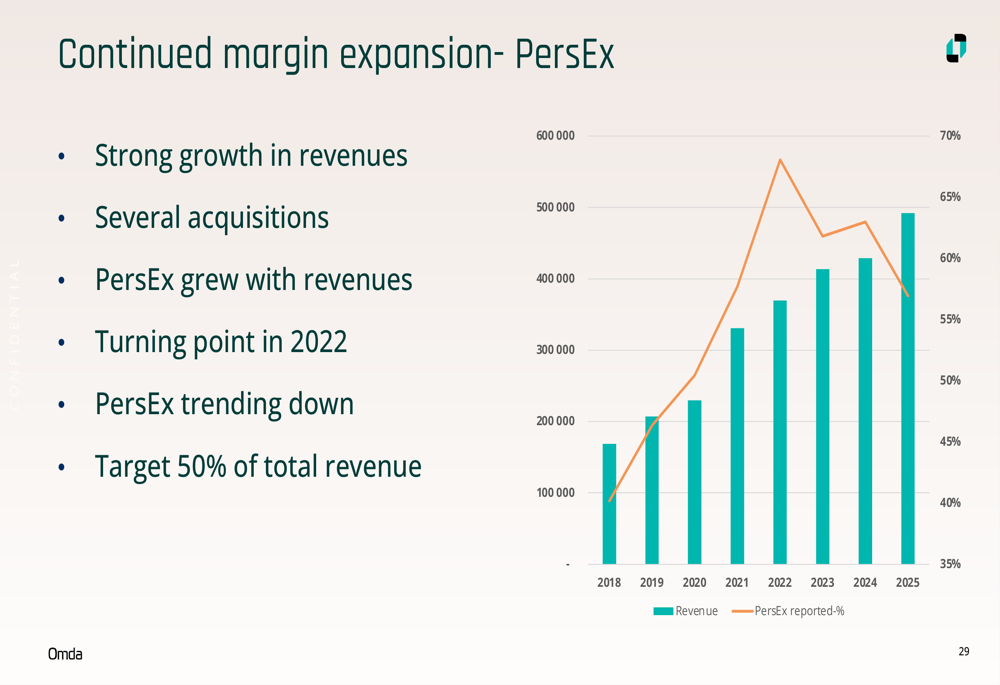
Omda outlined three key components of its long-term value creation strategy: personnel expense optimization (PersEx), continued margin expansion, and capital expenditure (Capex) compression.
The company has been steadily reducing personnel expenses as a percentage of revenue, with a target of 50% of total revenue. This trend is illustrated in the following chart showing the declining PersEx ratio since 2022:
Similarly, Omda has been reducing its COGS (Cost of Goods Sold) from approximately 6% of revenue to a target of 5%, while also lowering "Other Costs" from 15% to a revised target of 10% of revenue.
The company has also made significant progress in Capex compression, reducing capital expenditures from 14% of revenue in 2018 to 9% in 2024, with a long-term target of 5%. Management attributes this improvement to increased development efficiency following decentralization, homesourcing, and the use of AI.
These efficiency improvements, combined with organic growth of 5-10% per annum and continued M&A activity, form the foundation of Omda's value creation strategy for shareholders.
In conclusion, Omda's Q3 2025 presentation highlighted the company's ability to deliver strong financial results while executing on its strategic acquisition plan. Despite temporary margin dilution from recent acquisitions, the record 30% EBITDA margin demonstrates the effectiveness of the company's operational model and positions Omda for continued growth and value creation in the coming years.
Full presentation:
This article was generated with the support of AI and reviewed by an editor. For more information see our T&C.