Street Calls of the Week

Introduction & Market Context
Omnicom Group Inc. (NYSE:OMC) reported its second-quarter 2025 results on July 15, showing organic revenue growth of 3.0%, in line with the company’s full-year guidance range of 2.5% to 4.5%. The advertising and marketing giant’s stock declined 2.53% on the day of the announcement, closing at $72.65, though it showed signs of recovery with a 0.37% gain in after-hours trading.
The Q2 results come after a first quarter that saw slightly stronger organic growth of 3.4%, indicating a modest deceleration as the company progresses through 2025 while working toward completing its acquisition of Interpublic Group (IPG).
Quarterly Performance Highlights
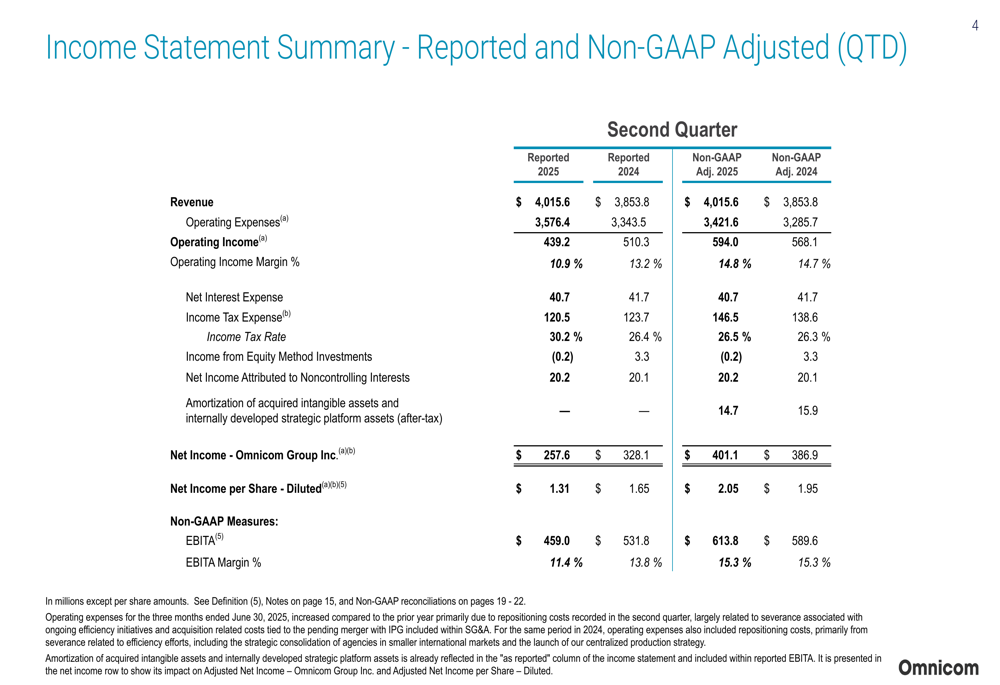
Omnicom reported Q2 2025 revenue of $4.02 billion, representing a 4.2% increase from the $3.85 billion reported in the same period last year. The company’s non-GAAP adjusted earnings before interest, taxes, and amortization (EBITA) reached $613.8 million, up 4.1% year-over-year, maintaining a 15.3% margin.
As shown in the following quarterly highlights:
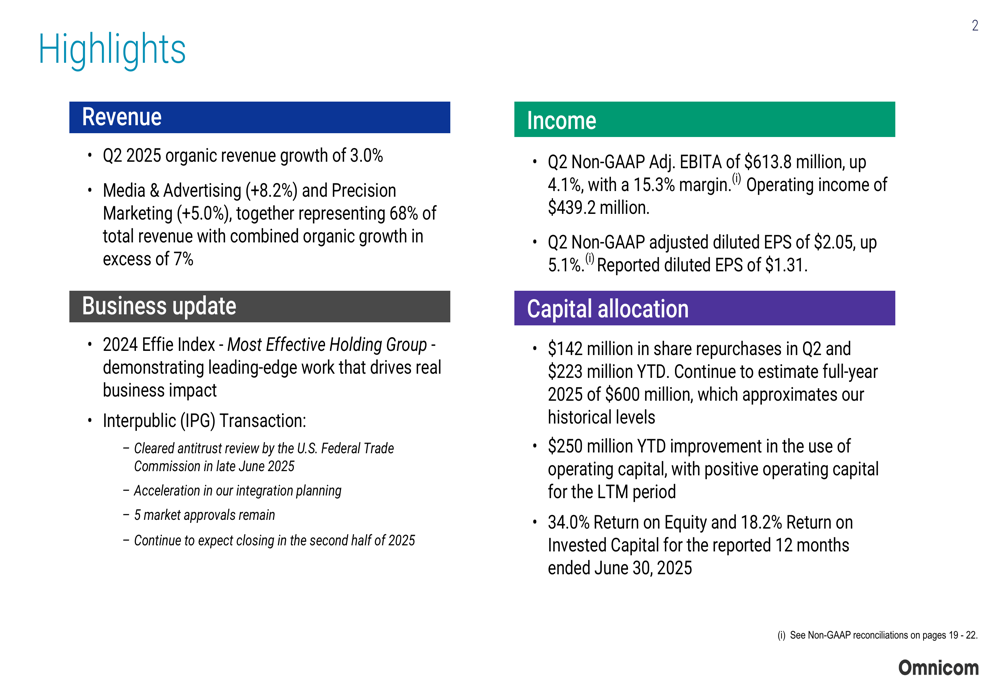
The company’s non-GAAP adjusted diluted earnings per share grew 5.1% to $2.05, compared to $1.95 in Q2 2024. However, reported diluted EPS was significantly lower at $1.31, down from $1.65 in the prior year, primarily due to increased repositioning costs and acquisition-related expenses.
The detailed income statement reveals the impact of these special items:
Discipline Performance Analysis
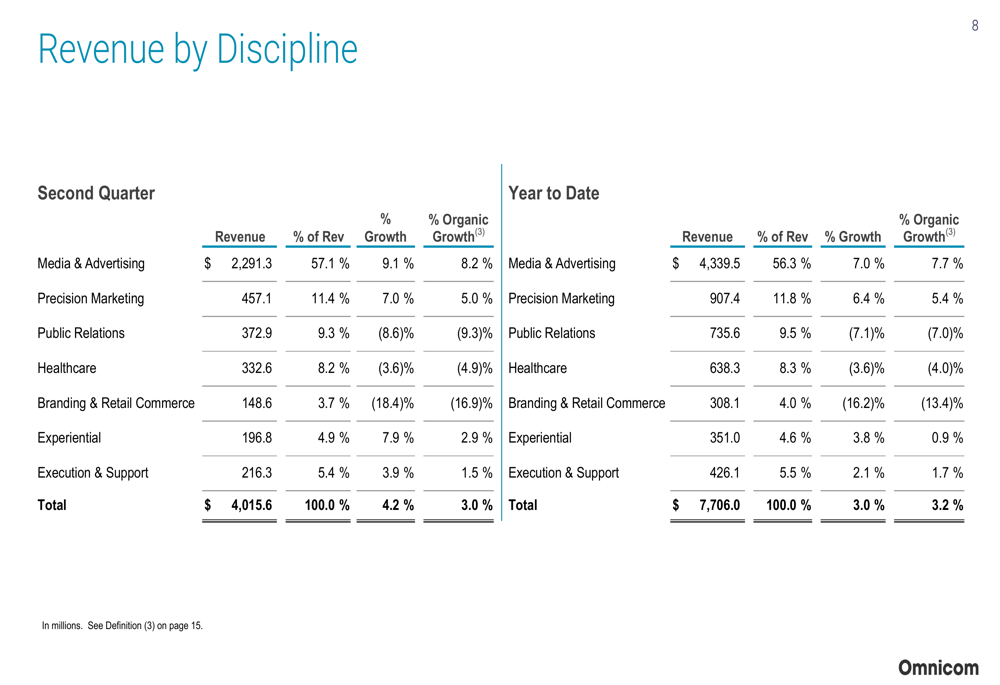
Omnicom’s performance varied significantly across its business disciplines. Media & Advertising, which represents 57.1% of total revenue, led growth with an impressive 8.2% organic increase. Precision Marketing also performed well with 5.0% organic growth. Together, these two segments account for 68% of the company’s revenue and delivered combined organic growth exceeding 7%.
However, several segments faced challenges, with Public Relations experiencing a 9.3% organic decline and Branding & Retail Commerce falling 16.9% organically. Healthcare also struggled with a 4.9% organic decrease.
The following breakdown illustrates the performance across all disciplines:
Geographic Performance
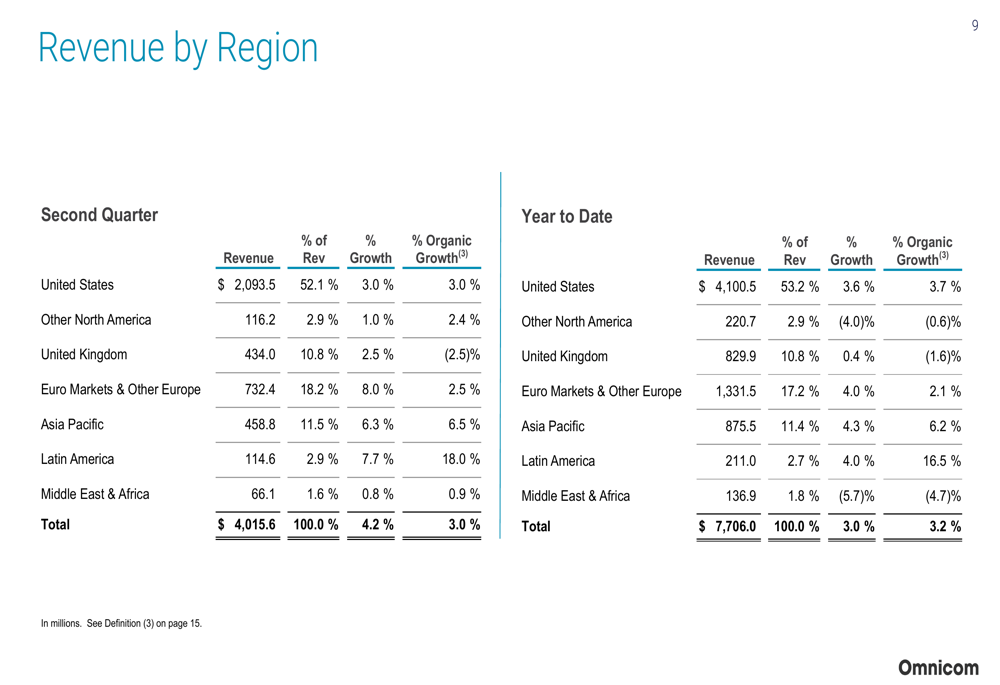
Geographically, Omnicom’s results showed considerable variation. Latin America emerged as the standout performer with 18.0% organic growth, albeit from a smaller base (2.9% of total revenue). Asia Pacific also delivered solid results with 6.5% organic growth.
The United States, representing 52.1% of total revenue, maintained steady organic growth of 3.0%. However, the United Kingdom (TADAWUL:4280) experienced a 2.5% organic decline, while Euro Markets & Other Europe achieved 2.5% organic growth.
The regional performance breakdown provides additional context:
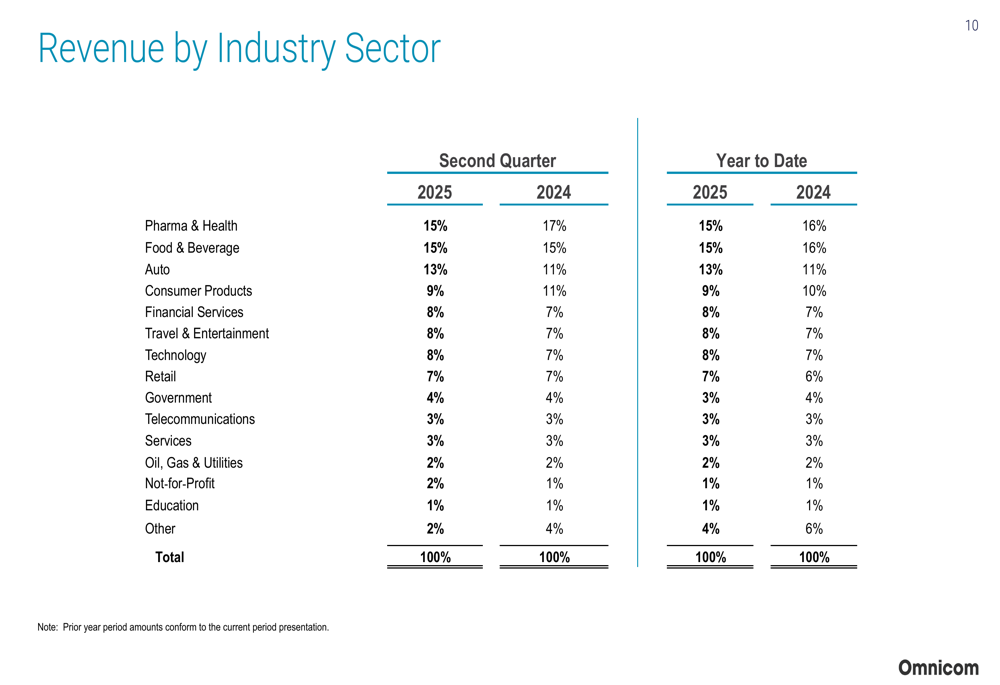
Industry Sector Shifts
Omnicom’s client industry mix showed notable shifts compared to the previous year. The Automotive sector increased its share from 11% to 13% of total revenue, while Pharma & Health declined from 17% to 15%. Consumer Products also decreased from 11% to 9%.
Financial Services, Travel & Entertainment, and Technology each gained one percentage point to represent 8% of revenue. These shifts reflect changing market dynamics and client spending patterns across industries.
Acquisition Progress and Strategic Initiatives
A significant development in the quarter was the clearance of Omnicom’s acquisition of Interpublic Group by the U.S. Federal Trade Commission in late June 2025. The company reported that integration planning has accelerated, with five market approvals still pending. Management continues to expect the transaction to close in the second half of 2025.
This acquisition represents a major strategic move in the advertising and marketing industry, potentially creating significant scale advantages. The Q1 2025 earnings call had indicated expected cost synergies of approximately $750 million from the combination.
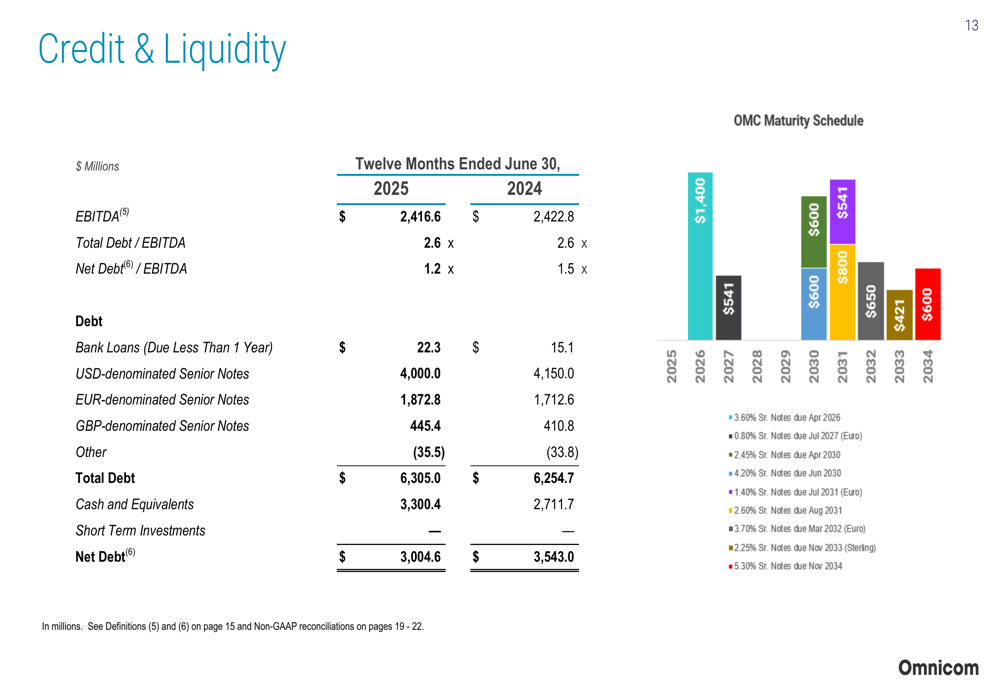
Financial Position and Capital Allocation
Omnicom maintained a strong financial position with improved leverage metrics. The company’s net debt to EBITDA ratio improved to 1.2x as of June 30, 2025, compared to 1.5x a year earlier, indicating strengthened balance sheet health.
The credit and liquidity position shows this improvement:
The company continued its commitment to shareholder returns, repurchasing $142 million in shares during Q2 and $223 million year-to-date. Management expects to maintain its historical level of share repurchases, projecting approximately $600 million for the full year 2025.
Free cash flow for the first half of 2025 reached $835.0 million, slightly below the $901.3 million generated in the same period of 2024. The company’s return on equity stood at an impressive 34.0%, with return on invested capital at 18.2% for the twelve months ended June 30, 2025.
Forward Outlook
While Omnicom did not provide updated specific guidance for the remainder of 2025, the company’s year-to-date organic growth of 3.2% positions it within its previously stated full-year target range of 2.5% to 4.5%. The continued strength in Media & Advertising and Precision Marketing segments provides a solid foundation, though challenges in Public Relations and Branding & Retail Commerce may persist.
The pending IPG acquisition remains the most significant strategic focus, with integration planning accelerating as regulatory approvals progress. The transaction’s completion in the second half of 2025 will likely dominate the company’s strategic agenda and could reshape competitive dynamics in the advertising and marketing industry.
As Omnicom navigates the remainder of 2025, investors will closely monitor organic growth trends across segments, progress on the IPG acquisition, and the company’s ability to maintain its strong margin profile amid ongoing repositioning efforts and integration planning.
Full presentation:
This article was generated with the support of AI and reviewed by an editor. For more information see our T&C.