Gold prices edge higher on raised Fed rate cut hopes

OPENLANE Inc (NYSE:KAR) released its first quarter 2025 earnings presentation on May 7, revealing a substantial 99.5% year-over-year increase in income from continuing operations despite a slight decline in total vehicles sold. The company reported strong revenue growth and improved profitability metrics across key segments while maintaining a robust balance sheet position.
Quarterly Performance Highlights
OPENLANE reported Q1 2025 total operating revenues of $460.1 million, a 7% increase from $429.9 million in Q1 2024. Income from continuing operations nearly doubled to $36.9 million compared to $18.5 million in the prior-year period, while diluted earnings per share more than tripled to $0.18 from $0.05.
The company’s adjusted EBITDA grew 10.7% to $82.8 million, up from $74.8 million in Q1 2024, reflecting improved operational efficiency. Operating adjusted net income from continuing operations per diluted share increased to $0.31 from $0.19 year-over-year, representing a 63% improvement.
As shown in the following comprehensive financial overview:
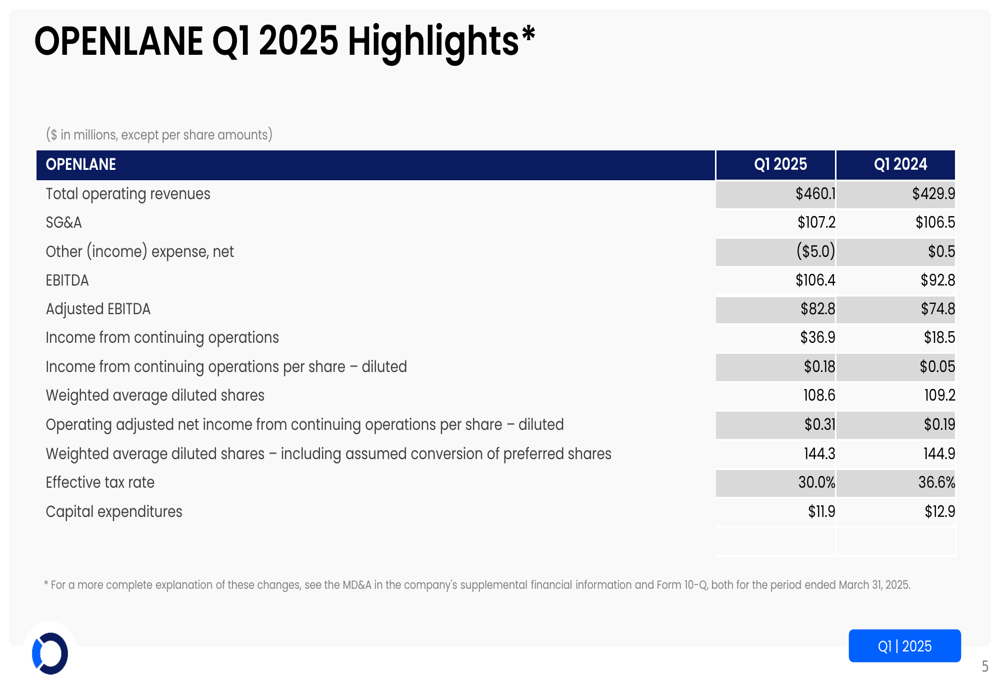
The effective tax rate improved significantly to 30.0% from 36.6% in the prior year period, contributing to the bottom-line growth. Capital expenditures remained relatively stable at $11.9 million compared to $12.9 million in Q1 2024.
Segment Analysis: Marketplace
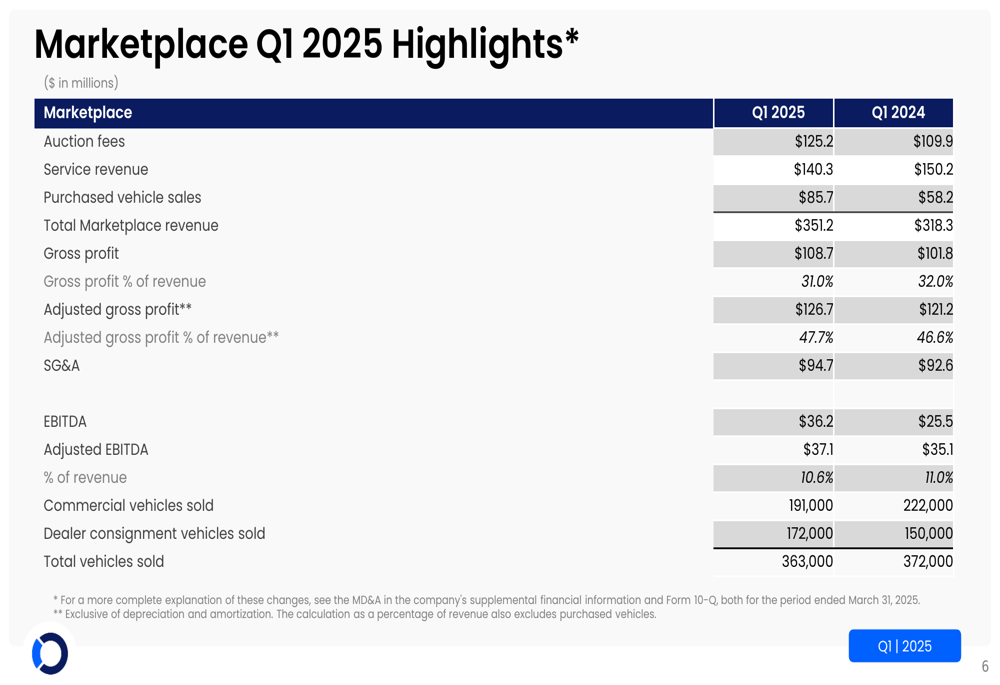
OPENLANE’s Marketplace segment, which represents the majority of the company’s business, delivered strong performance with revenue increasing 10.3% to $351.2 million from $318.3 million in Q1 2024. This growth was primarily driven by higher auction fees, which rose to $125.2 million from $109.9 million, and increased purchased vehicle sales of $85.7 million compared to $58.2 million in the prior year.
The segment’s EBITDA showed impressive growth of 42%, reaching $36.2 million compared to $25.5 million in Q1 2024. Adjusted EBITDA for the Marketplace segment increased to $37.1 million from $35.1 million, though as a percentage of revenue it slightly decreased to 10.6% from 11.0%.
A notable shift occurred in the mix of vehicles sold, with dealer consignment vehicles increasing 14.7% to 172,000 units, while commercial vehicles declined 14% to 191,000 units. Total (EPA:TTEF) vehicles sold decreased slightly by 2.4% to 363,000 units.
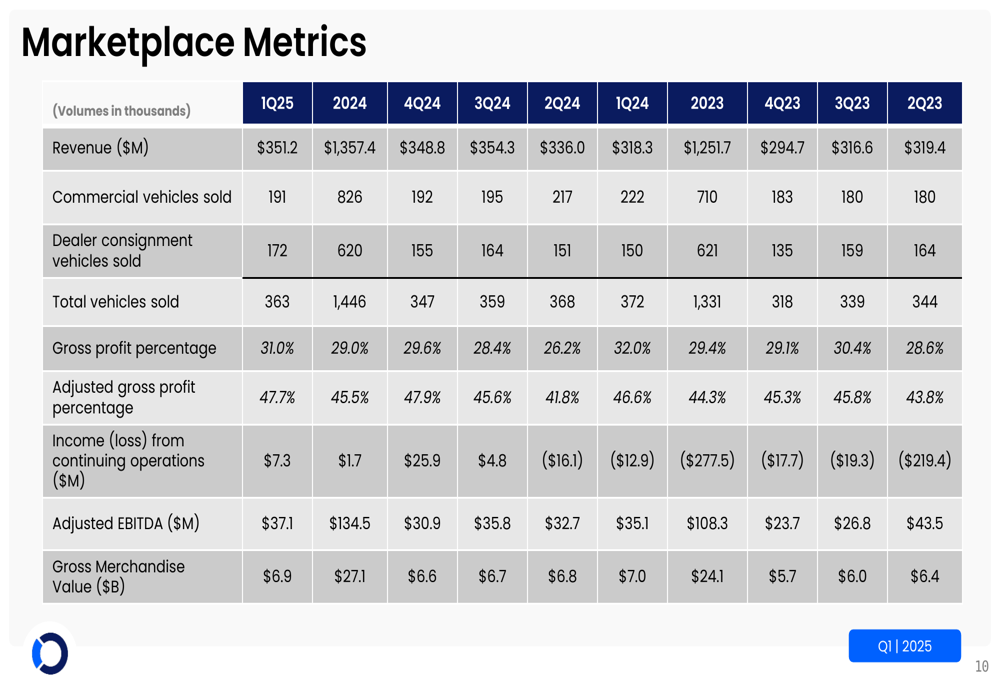
The detailed Marketplace segment performance is illustrated below:
Segment Analysis: Finance
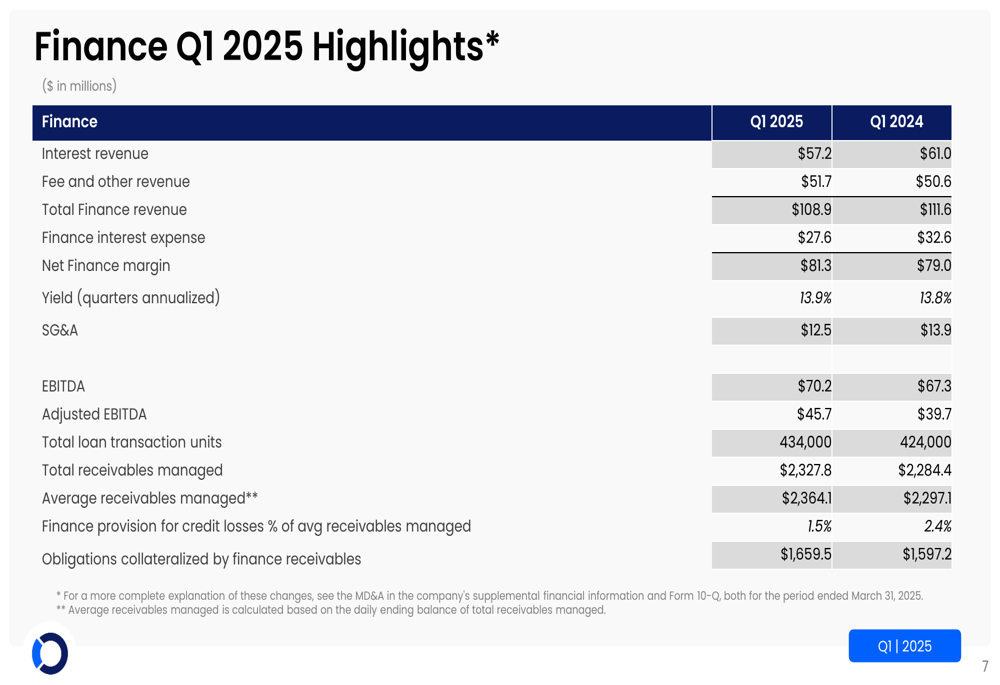
The Finance segment showed a slight revenue decline of 2.4% to $108.9 million from $111.6 million in Q1 2024, primarily due to lower interest revenue. However, the segment’s profitability improved, with EBITDA increasing to $70.2 million from $67.3 million and adjusted EBITDA growing to $45.7 million from $39.7 million.
The Finance segment’s yield (quarters annualized) improved slightly to 13.9% from 13.8% in the prior year. Total loan transaction units increased to 434,000 from 424,000, and total receivables managed grew to $2,327.8 million from $2,284.4 million.
Credit quality showed significant improvement, with the Finance provision for credit losses as a percentage of average receivables managed decreasing to 1.5% from 2.4% in Q1 2024, indicating stronger underwriting or improved economic conditions for borrowers.
The Finance segment’s performance metrics are detailed in the following table:
Balance Sheet Strength & Leverage
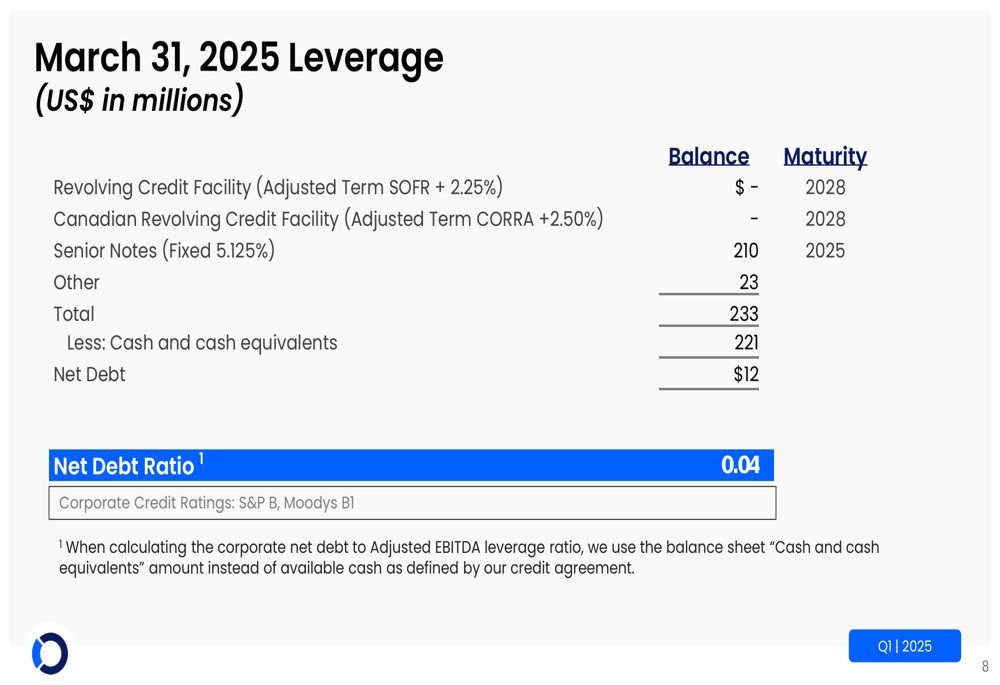
OPENLANE maintained a strong balance sheet with minimal leverage. As of March 31, 2025, the company reported total debt of $233 million, primarily consisting of $210 million in Senior Notes with a fixed 5.125% rate maturing in 2025. With cash and cash equivalents of $221 million, the company’s net debt was just $12 million, resulting in an exceptionally low net debt ratio of 0.04.
The company’s corporate credit ratings remained stable at B from S&P and B1 from Moody’s. The low leverage position provides OPENLANE with significant financial flexibility for potential strategic investments, share repurchases, or debt reduction.
The company’s debt structure and leverage position are illustrated in the following table:
2025 Outlook & Guidance
For the full year 2025, OPENLANE provided guidance indicating continued growth. The company expects income from continuing operations to range between $100 million and $114 million, with adjusted EBITDA projected between $290 million and $310 million.
Diluted earnings per share from continuing operations are expected to be between $0.38 and $0.48, while operating adjusted net income from continuing operations per diluted share is projected to range from $0.90 to $1.00.
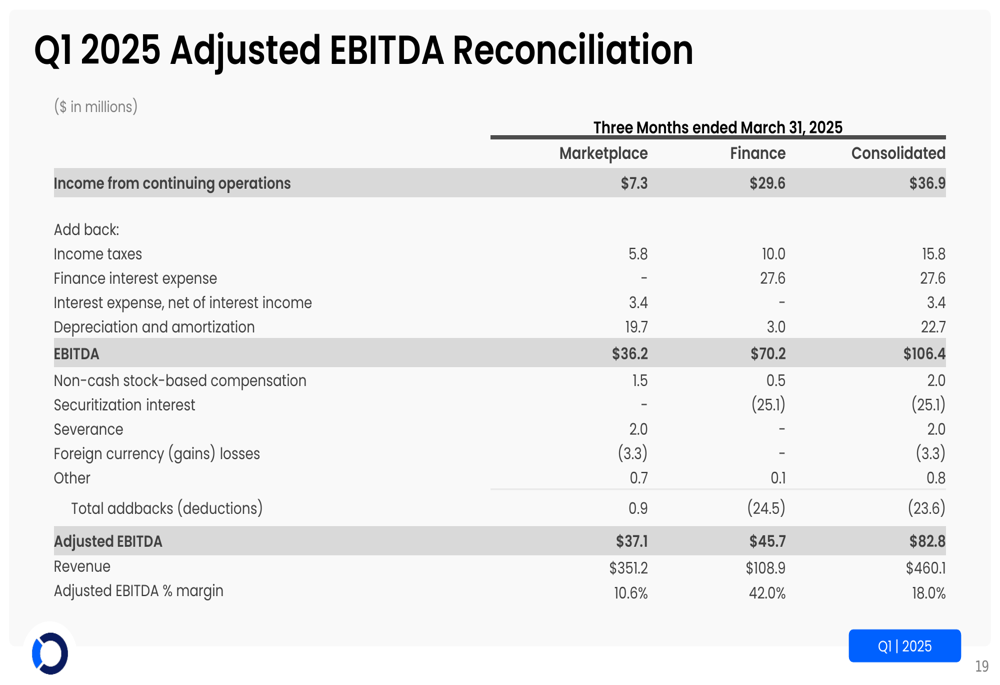
The reconciliation of adjusted EBITDA provides insight into how the company calculates this key metric:
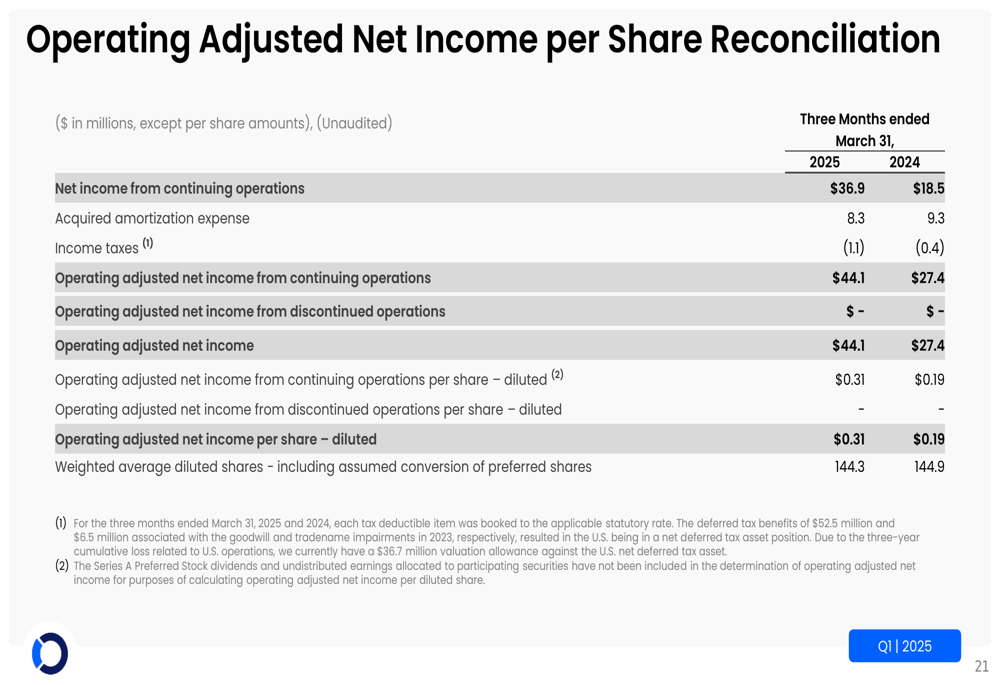
Similarly, the reconciliation of operating adjusted net income per share shows the adjustments made to arrive at this non-GAAP measure:
OPENLANE’s historical data shows consistent performance across key metrics, providing context for the current quarter’s results and supporting the company’s guidance for continued growth throughout 2025:
The company’s stock closed at $19.34 on May 7, 2025, down 0.88% for the day. In after-hours trading, the stock was relatively stable at $19.17, down just 0.05%. With its strong financial performance and solid balance sheet, OPENLANE appears well-positioned to continue its growth trajectory through 2025.
Full presentation:
This article was generated with the support of AI and reviewed by an editor. For more information see our T&C.