
Introduction & Market Context
Orkla ASA (OB:ORK) reported its first quarter 2025 results on May 9, showing continued adjusted EBIT growth despite modest organic sales growth. The Norwegian consumer goods conglomerate, which operates a portfolio of businesses across food, ingredients, and consumer products, demonstrated the effectiveness of its portfolio strategy with adjusted earnings per share increasing by 19% year-over-year.
The company’s strategic categorization of businesses into "Anchor," "Grow and build," and "Transform or exit" segments appears to be yielding results, with particularly strong performance in the Health, Home & Personal Care, and House Care segments.
Quarterly Performance Highlights
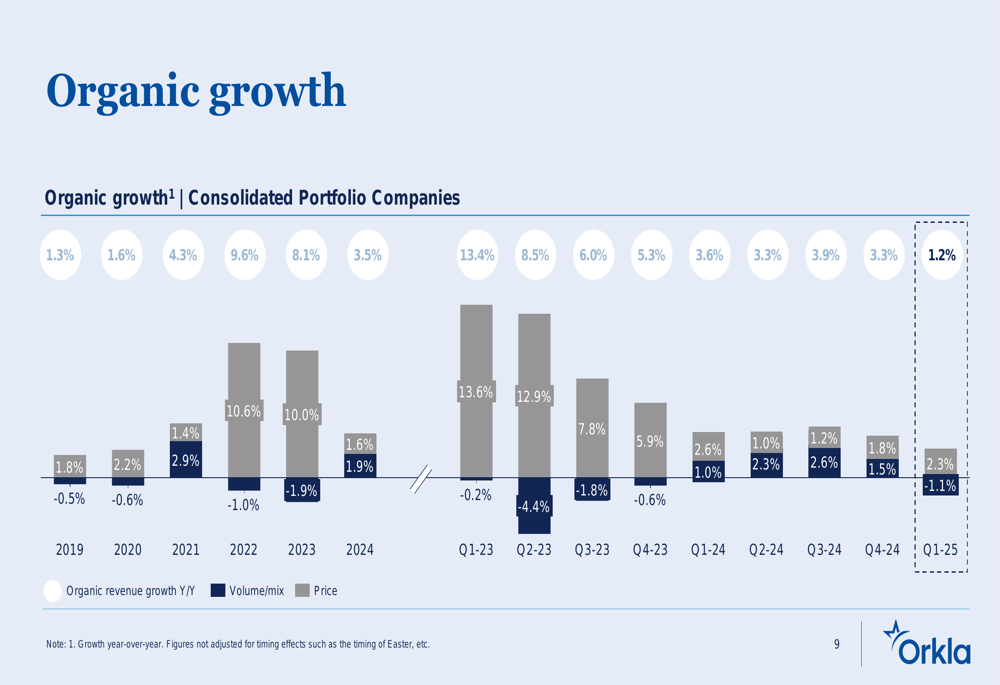
Orkla reported Q1 2025 operating revenues of 17,176 million NOK, representing a 2% increase compared to the same period last year. The company achieved organic growth of 1.2%, composed of a 2.3% price increase offset by a 1.1% decline in volume/mix.
As shown in the following chart of key quarterly metrics, adjusted EBIT grew by 10% to 1,758 million NOK, while adjusted earnings per share reached 1.68 NOK, a 19% increase from Q1 2024:
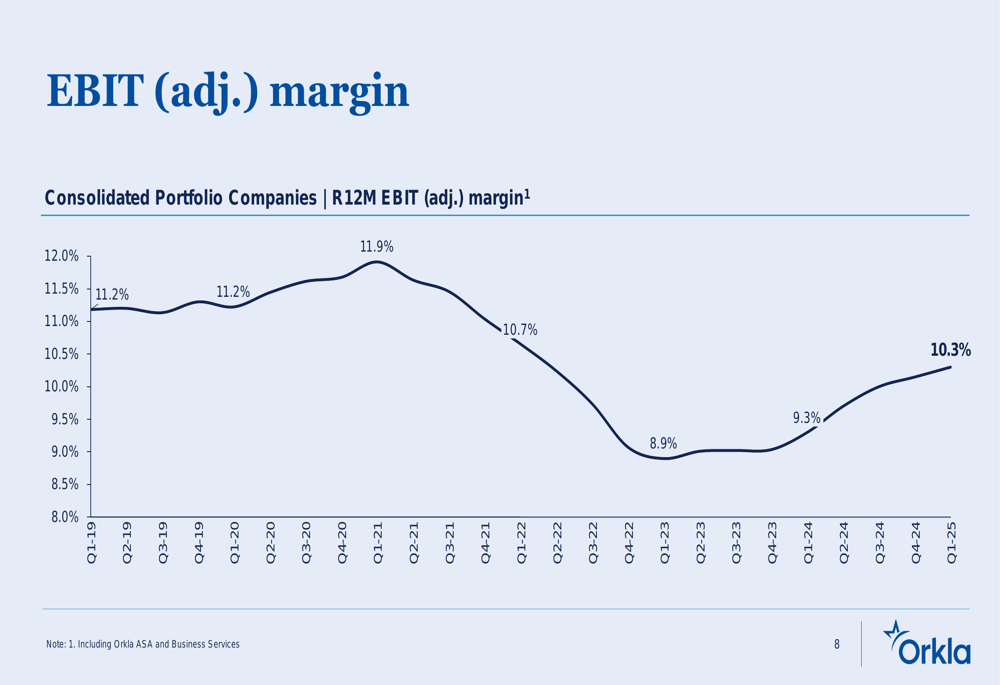
The company’s adjusted EBIT margin has been steadily improving over recent quarters, reaching 10.3% in Q1 2025, up from 8.9% in Q1 2023. This margin expansion demonstrates Orkla’s ability to improve profitability despite challenging market conditions.
As illustrated in the following margin trend chart, Orkla has been successfully rebuilding margins after a period of decline:
The organic growth breakdown shows that while price increases contributed positively, volume/mix remained a challenge in the quarter:
Portfolio Performance
Orkla’s portfolio approach showed varied results across its business segments. The company’s breakdown of performance by business category reveals that most segments delivered positive underlying EBIT growth:
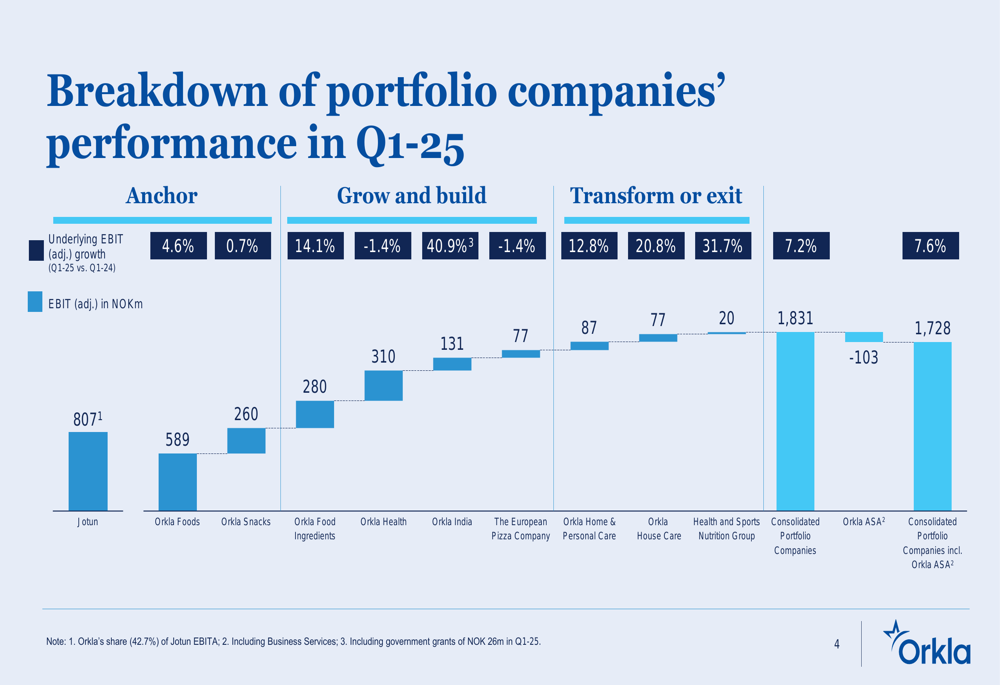
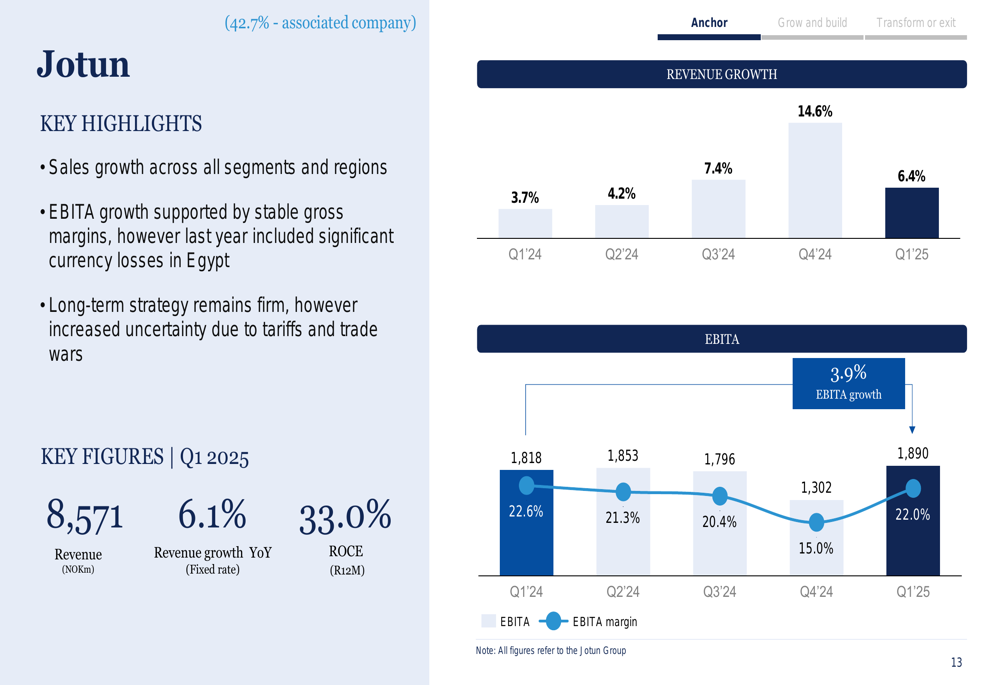
Jotun, in which Orkla holds a 42.7% stake, continued to be a strong performer with 6.1% revenue growth at fixed exchange rates. The paint and coatings company saw sales growth across all segments and regions, with EBITA growth supported by stable gross margins. Jotun’s EBITA margin remained robust at 22.0% in Q1 2025.
The following chart illustrates Jotun’s consistent performance:
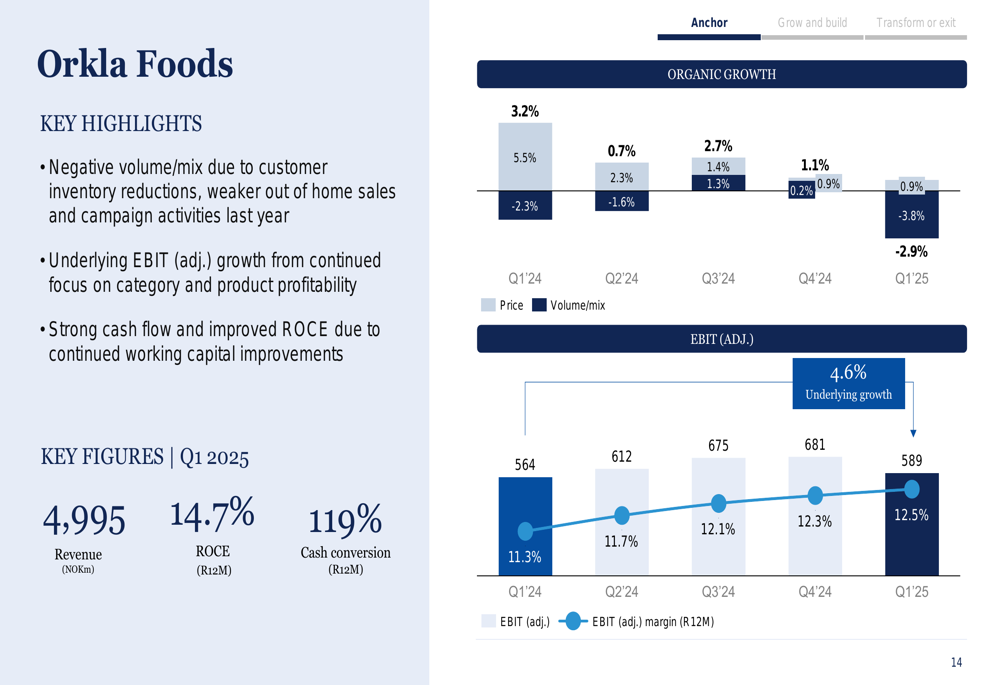
In the core food business, Orkla Foods faced some challenges with organic growth declining by 2.9% in Q1 2025, primarily due to a 3.8% volume decline. However, the segment maintained a healthy EBIT margin of 12.5% and delivered underlying EBIT growth of 4.6%.
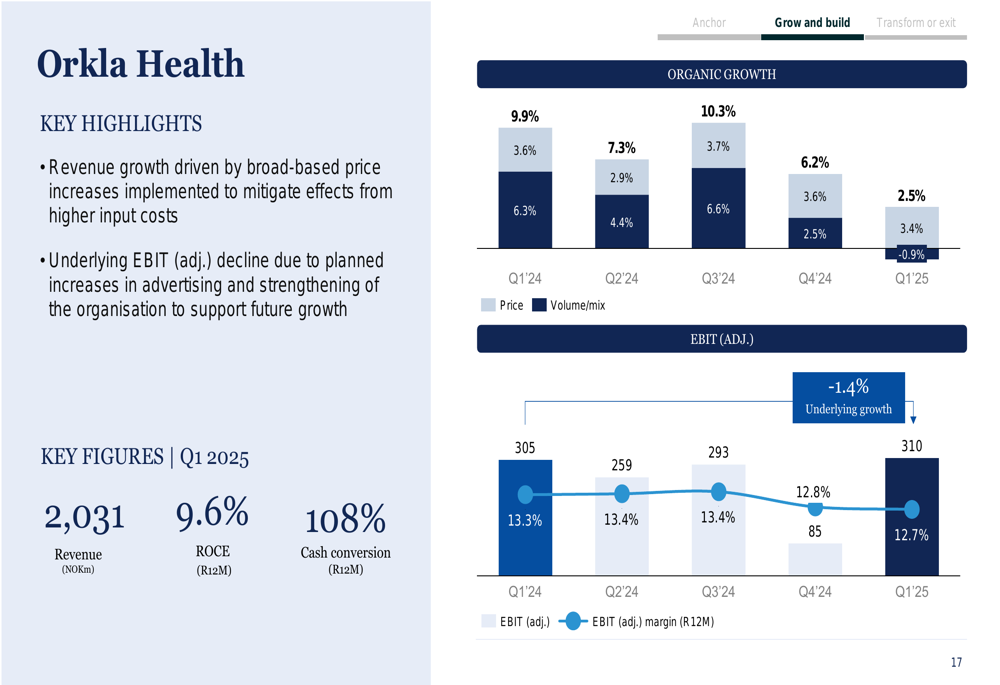
The standout performer in Orkla’s portfolio was Orkla Health, which delivered exceptional underlying EBIT growth of 40.9%, reaching 310 million NOK in Q1 2025. The segment achieved organic growth of 2.5% and maintained a strong EBIT margin of 12.7%.
Other notable performers included Orkla House Care with 31.7% underlying EBIT growth and Orkla Home & Personal Care with 20.8% growth. The European Pizza Company also showed solid results with 12.8% underlying EBIT growth.
Strategic Outlook
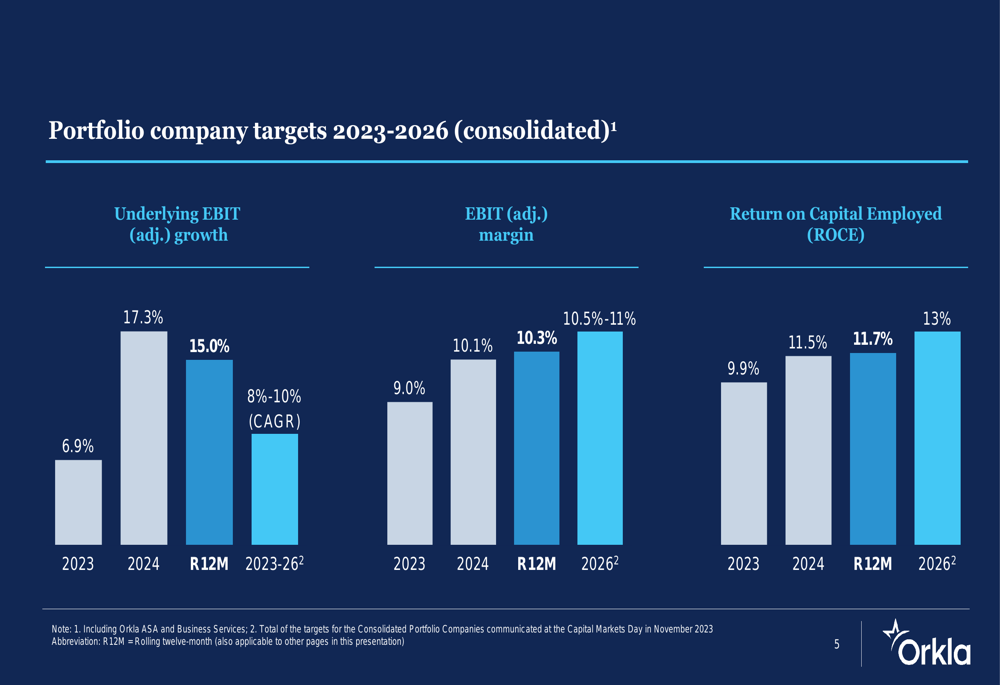
Orkla continues to make progress toward its 2023-2026 financial targets. The company is targeting 8-10% compound annual growth rate (CAGR) in underlying adjusted EBIT, an adjusted EBIT margin of 10.5-11% by 2026, and a return on capital employed (ROCE) of 13% by 2026.
As shown in the following chart, Orkla is making steady progress toward these targets:
The company has scheduled a Capital Markets Update for May 28, 2025, which will include presentations from CEO Nils K. Selte, CFO Arve Regland, and business unit leaders from Orkla Foods, Orkla Snacks, and Orkla Food Ingredients.
Financial Position
Orkla maintained a solid financial position with a net interest-bearing debt (NIBD) to EBITDA ratio of 1.6x at the end of Q1 2025. This represents a slight increase from 1.5x at the end of 2024 but remains well within manageable levels.
The following chart shows the components affecting Orkla’s net interest-bearing debt position:
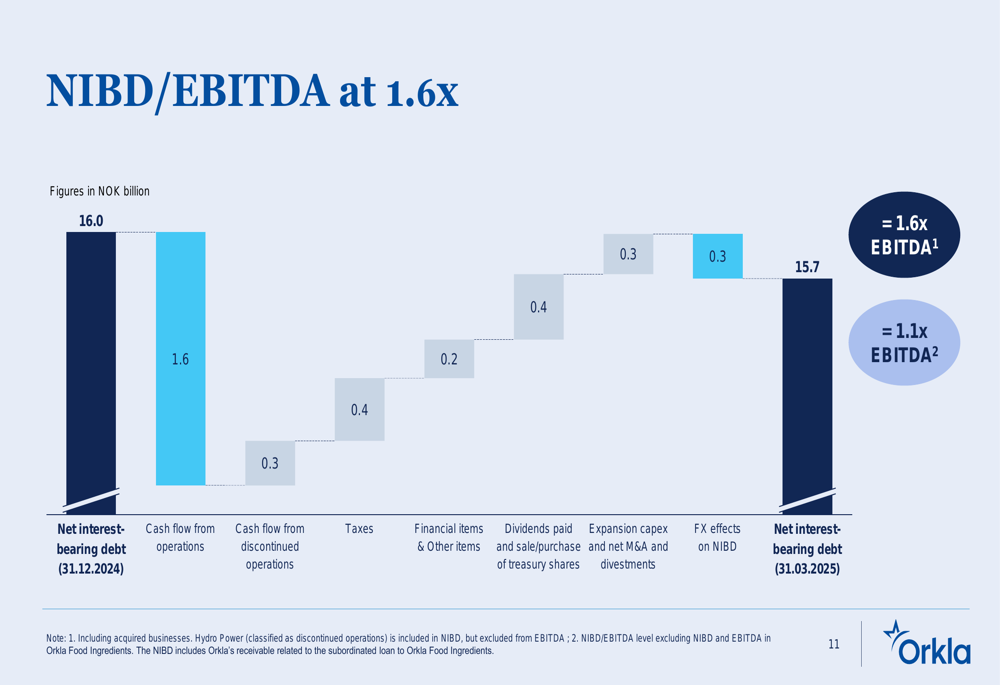
Cash flow from operations improved to 1.6 billion NOK in Q1 2025 compared to 1.2 billion NOK in Q1 2024, primarily due to stronger operating results and a smaller increase in working capital. However, cash flow before capital allocation decreased to 0.7 billion NOK from 1.2 billion NOK in the same period last year, mainly due to higher expansion investments and M&A activities.
Overall, Orkla’s Q1 2025 results demonstrate the effectiveness of its portfolio strategy, with strong performances in several business segments offsetting challenges in others. The company continues to make progress toward its medium-term financial targets while maintaining a solid financial position.
Full presentation:
This article was generated with the support of AI and reviewed by an editor. For more information see our T&C.