Intel, Ford and Target rise premarket; Deckers slumps

Oxford Square Capital Corp. (NASDAQ:OXSQ) released its second quarter 2025 presentation on August 7, revealing declining net investment income and net asset value amid a strategic shift toward more secured investments. The business development company, which focuses on debt and equity investments primarily in leveraged loan markets, maintained its quarterly distribution despite financial headwinds.
Quarterly Performance Highlights
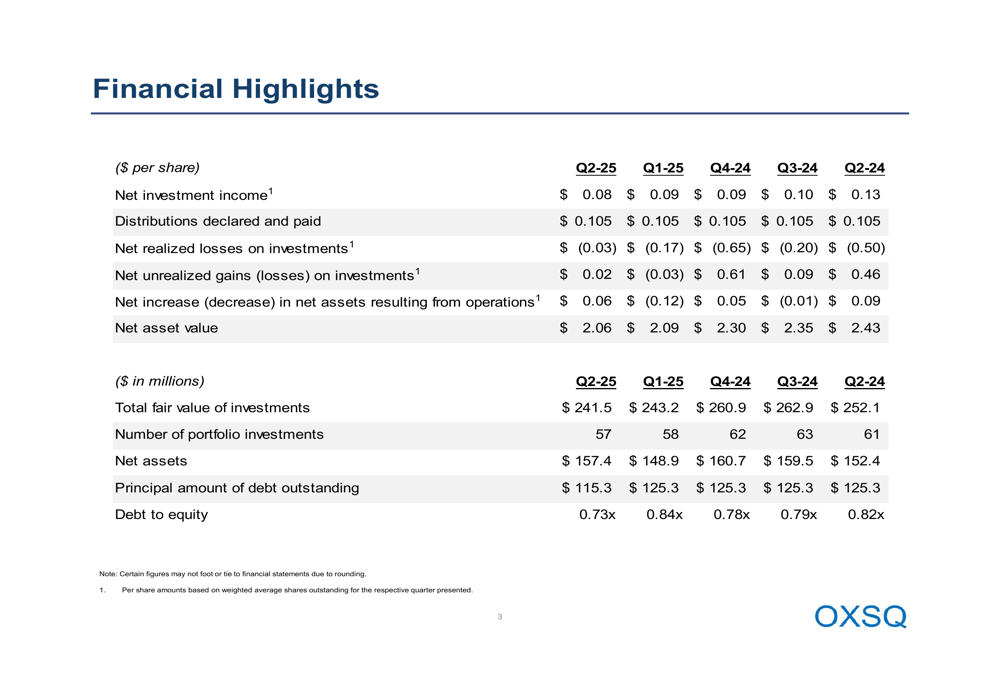
Oxford Square reported net investment income of $0.08 per share for Q2 2025, down from $0.13 in the same quarter last year. The company’s net asset value (NAV) continued its downward trend, reaching $2.06 per share, compared to $2.09 in the previous quarter and $2.43 a year ago. Despite these challenges, OXSQ maintained its quarterly distribution at $0.105 per share.
The total fair value of investments decreased to $241.5 million across 57 portfolio companies, down from $262.9 million and 63 companies in Q3 2024. The company reported modest net realized losses on investments of $(0.03) per share and slight unrealized gains of $0.02 per share.
As shown in the following financial highlights table:
Portfolio Composition and Strategy
Oxford Square demonstrated a significant strategic shift in its portfolio allocation over the past year. First-lien secured debt now represents 49.8% of the portfolio by fair value, up substantially from 34% in Q2 2024. Conversely, second-lien secured debt has been reduced to 11.0% from 31% a year ago, indicating a more defensive positioning.
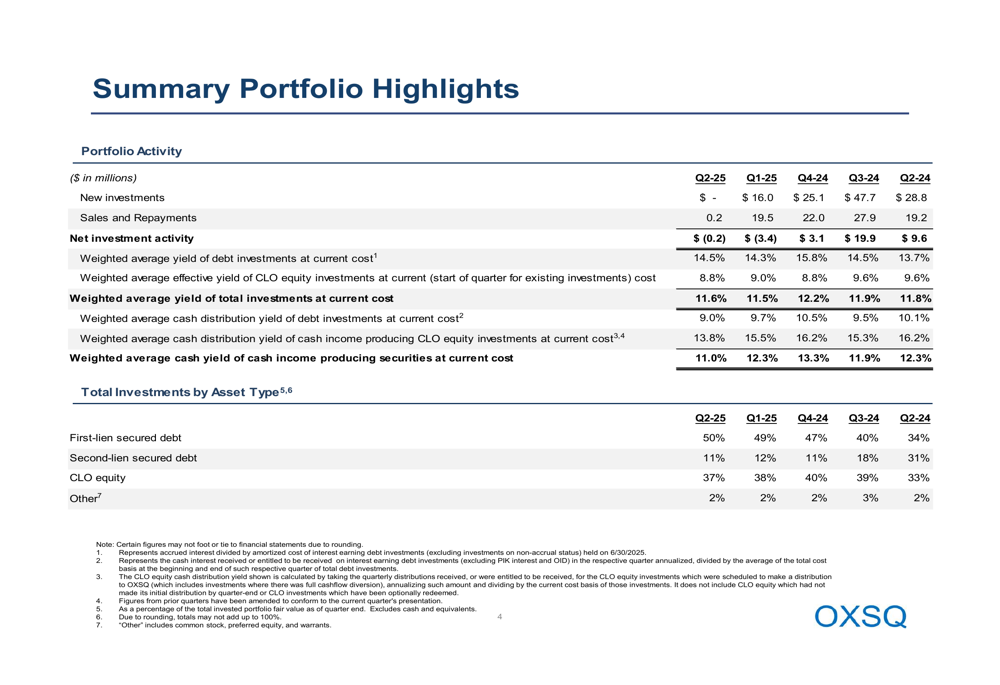
The company reported no new investments during Q2 2025, compared to $16.0 million in the previous quarter and $28.8 million in Q2 2024. This suggests a cautious approach to capital deployment in the current market environment.
The weighted average yield of total investments at current cost stood at 11.6% in Q2 2025, slightly up from 11.5% in Q1 2025 but down from 12.2% in Q4 2024.
The following chart illustrates the company’s current asset allocation:
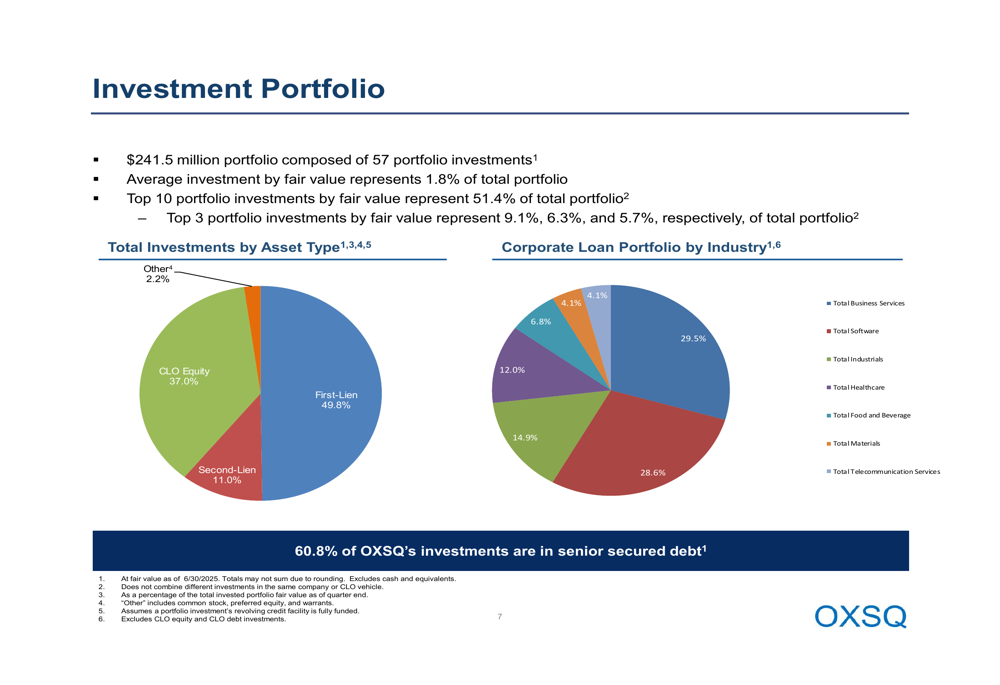
Industry diversification within the corporate loan portfolio shows significant concentration in telecommunication services (29.5%) and materials (28.6%), with smaller allocations to food and beverage (14.9%), healthcare (12.0%), and other sectors.
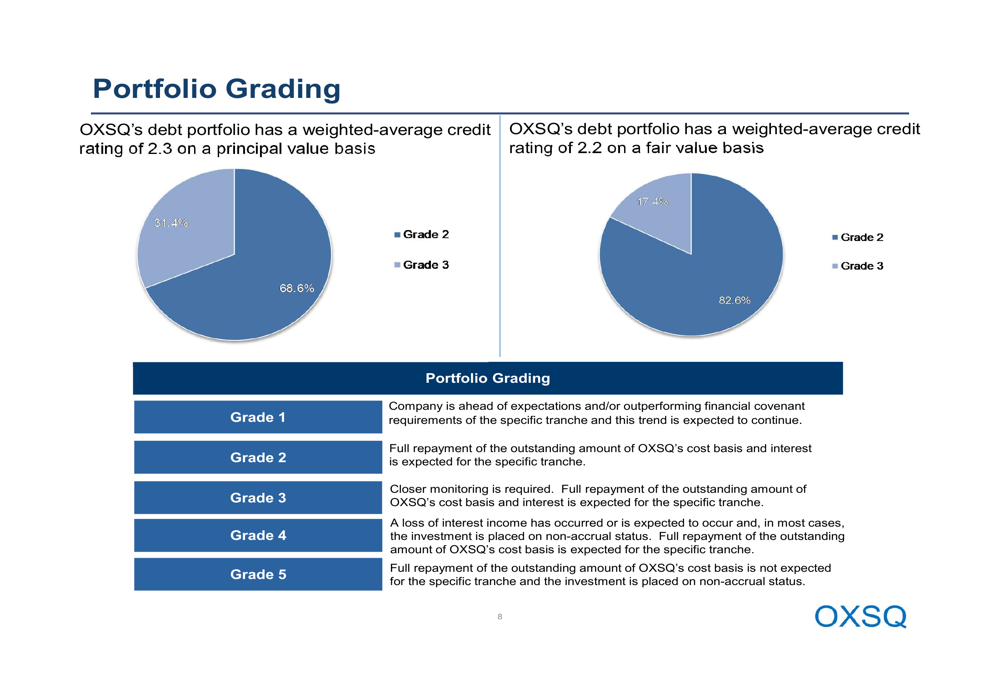
The company’s portfolio quality appears stable, with 82.6% of investments by fair value rated as Grade 3, indicating "expected to repay in full." No investments were rated in the more concerning Grade 4 or 5 categories.
CLO Portfolio Performance
Collateralized Loan Obligation (CLO) equity investments continue to represent a significant portion of Oxford Square’s portfolio at 37.0% of fair value. The weighted average effective yield of CLO equity investments stood at 8.8% in Q2 2025, slightly down from 9.0% in the previous quarter and 9.6% a year ago.
All of the company’s CLO equity investments have made their initial distributions, with total CLO equity at original cost of $192.9 million, down from $222.9 million in Q1 2025. The cash distribution yield of income-producing CLO equity investments was 13.8% in Q2 2025, down from 15.5% in Q1 2025 and 16.2% a year ago.
Debt Profile and Capital Structure
Oxford Square’s debt profile shows improvement in leverage metrics, with debt-to-equity ratio decreasing to 0.73x from 0.84x in the previous quarter. The company’s total outstanding debt stood at $115.3 million as of June 30, 2025, consisting of two unsecured note issuances: $34.8 million of notes due in April 2026 (6.25% coupon) and $80.5 million due in July 2028 (5.50% coupon).
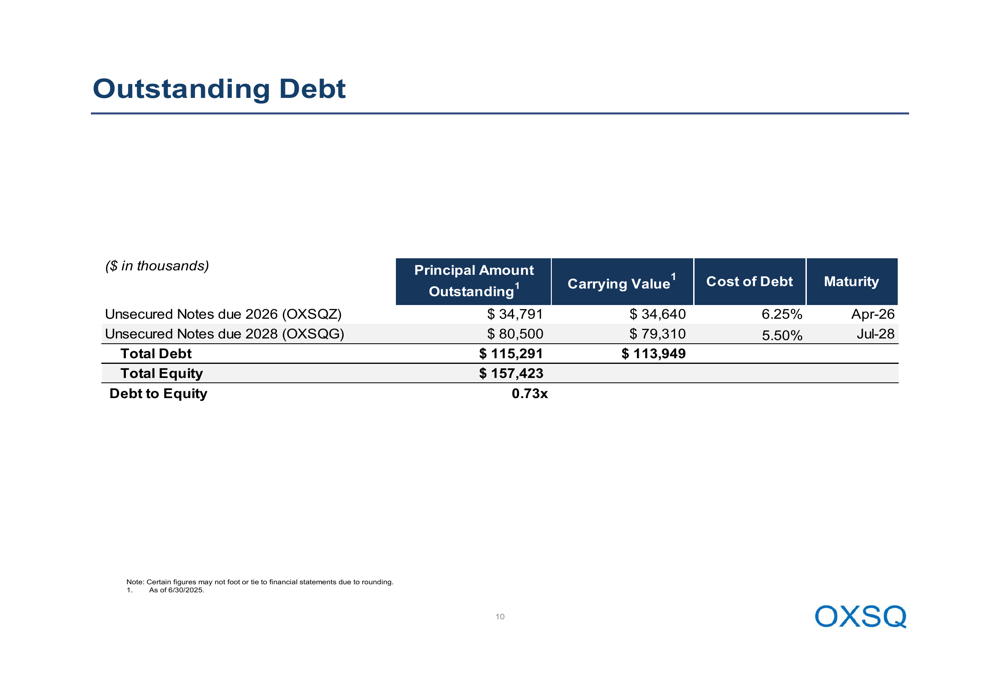
The company’s total equity was $157.4 million at quarter-end, supporting the reduced leverage ratio. This improved capital structure provides additional flexibility in navigating challenging market conditions.
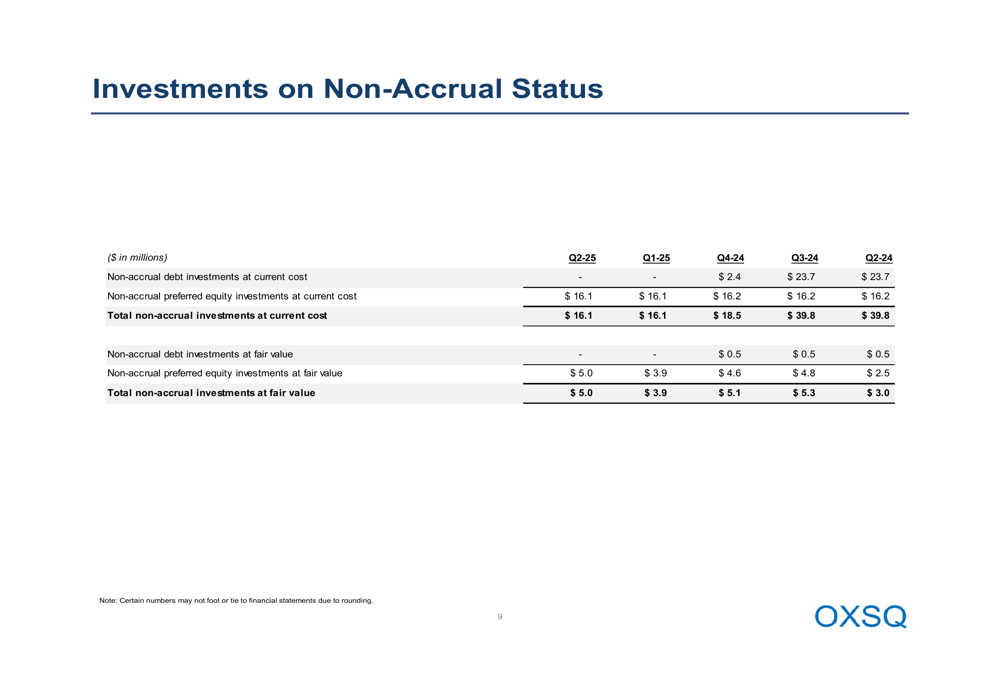
Non-Accrual Investments and Credit Quality
Oxford Square reported $5.0 million of investments at fair value on non-accrual status as of Q2 2025, representing preferred equity investments. This marks an increase from $3.9 million in the previous quarter but a significant improvement from the combined debt and equity non-accruals of previous years.
The company had no debt investments on non-accrual status for the second consecutive quarter, compared to $0.5 million in Q4 2024 and earlier periods. This improvement suggests enhanced credit quality management despite broader market challenges.
Forward Outlook
Oxford Square faces continued challenges in maintaining its investment income levels amid portfolio restructuring and cautious deployment of capital. The shift toward more secured investments may provide downside protection but could limit upside potential in the near term.
The stock closed at $2.35 on August 7, 2025, down 0.51% for the day, and currently trades at a significant discount to its NAV of $2.06. The company’s consistent quarterly distribution of $0.105 per share represents an annualized yield of approximately 17.9% based on the current share price.
As Oxford Square continues to navigate a complex market environment, investors will be watching closely for signs of stabilization in NAV and whether the company can maintain its distribution level in coming quarters despite the declining net investment income trend.
Full presentation:
This article was generated with the support of AI and reviewed by an editor. For more information see our T&C.