Bullish indicating open at $55-$60, IPO prices at $37

Introduction & Market Context
Park Hotels & Resorts Inc . (NYSE:PK) released its first quarter 2025 supplemental data on May 5, 2025, revealing a net loss of $57 million and a significant downward revision to its full-year outlook. The lodging REIT, which owns a portfolio of 40 premium-branded hotels with approximately 25,000 rooms, faced operational challenges despite maintaining relatively stable revenue levels compared to the prior year.
The company’s stock has shown volatility following the earnings release, with shares trading at $11.20 at the previous close, well below its 52-week high of $16.23. In premarket trading on July 14, 2025, the stock was down an additional 0.71% to $11.12, reflecting continued investor concerns following the disappointing quarterly results.
Quarterly Performance Highlights
Park Hotels reported total revenues of $630 million for Q1 2025, slightly down from $639 million in Q1 2024 but above analyst expectations of $614.12 million. However, the company posted a significant loss of $57 million compared to a profit of $29 million in the same period last year, resulting in a loss per share of $0.29 versus earnings of $0.13 per share in Q1 2024.
The financial results were heavily impacted by a $70 million impairment and casualty loss, compared to just $6 million in the prior year period. This substantial increase in impairment charges was a key factor in the company’s swing to a net loss.
As shown in the following condensed consolidated statements of operations:
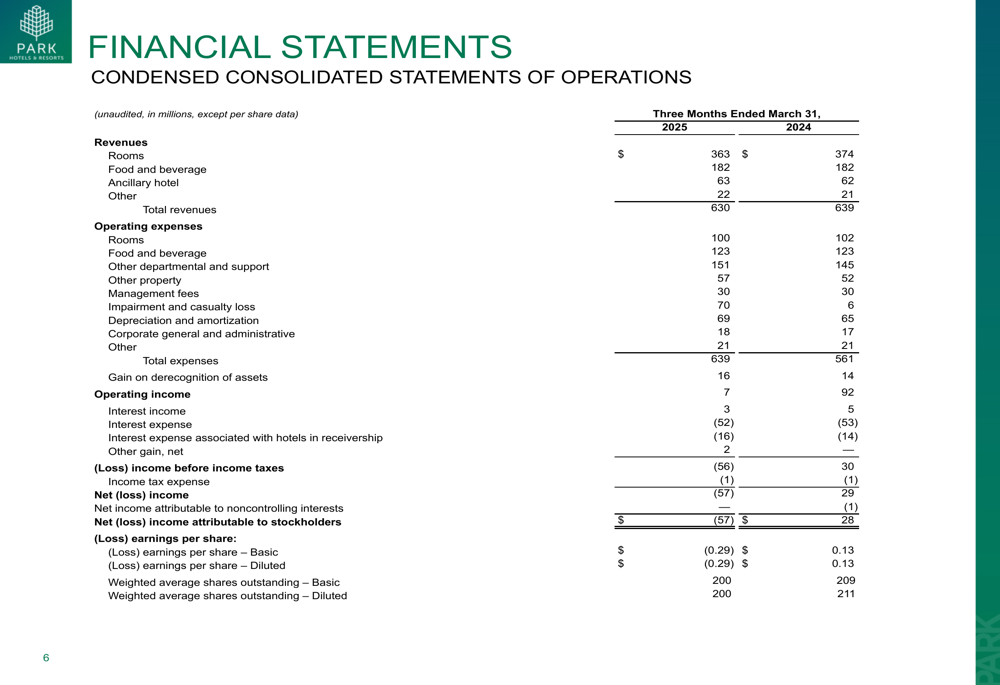
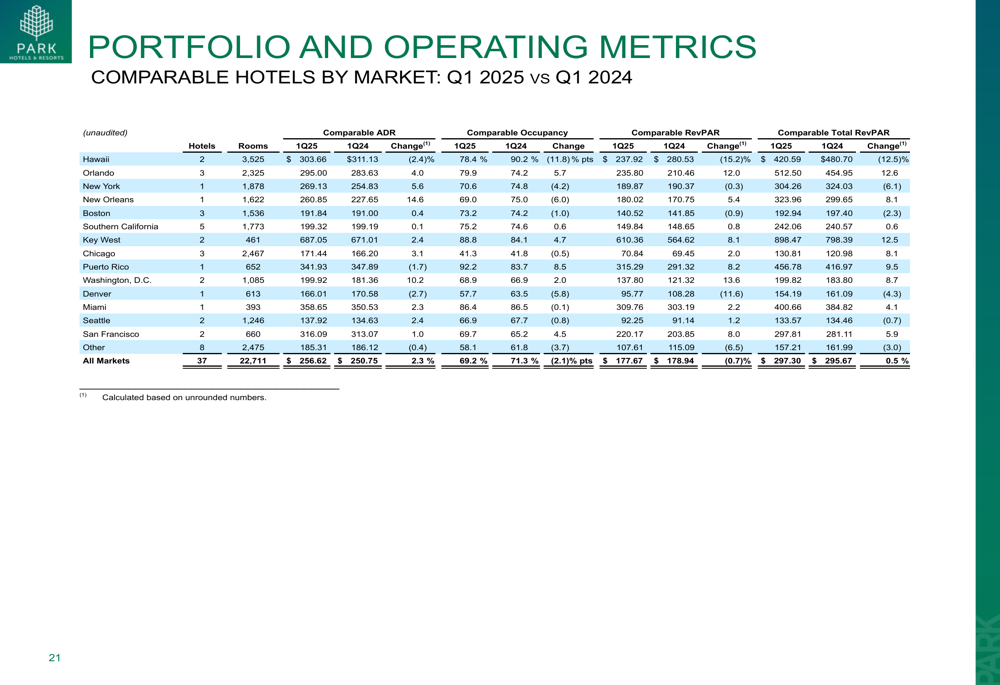
Operating metrics showed mixed results, with average daily rate (ADR) increasing by 2.3% to $256.62, while occupancy decreased by 2.1 percentage points to 69.2%. This resulted in a slight 0.7% decline in Revenue Per Available Room (RevPAR) to $177.67. Despite the RevPAR decrease, total RevPAR increased by 0.5% to $297.30, indicating that the company was able to generate additional revenue from non-room sources.
Detailed Financial Analysis
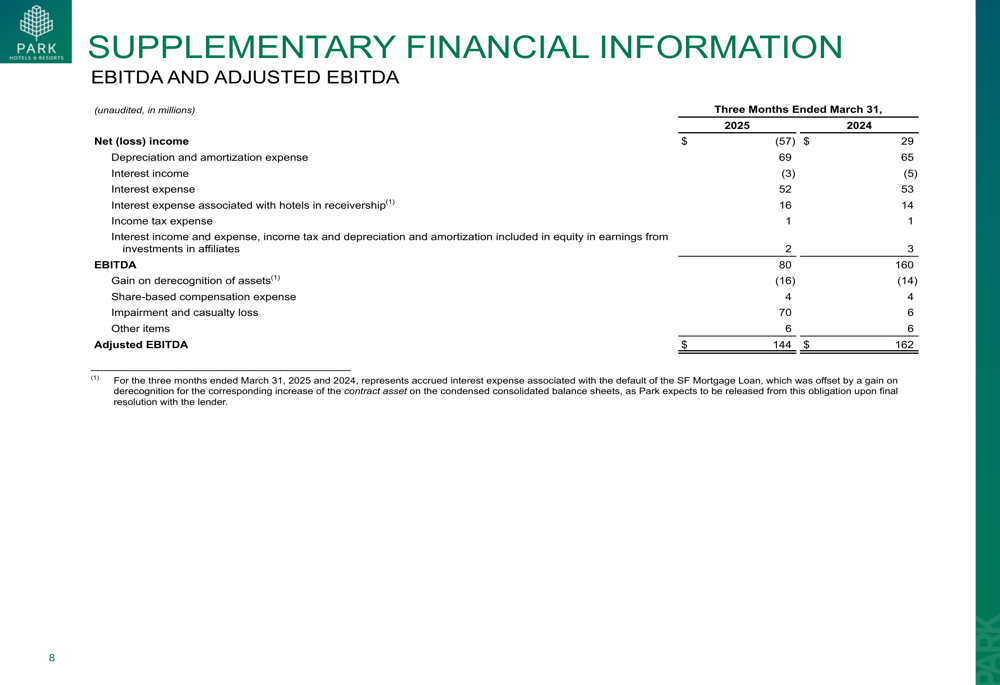
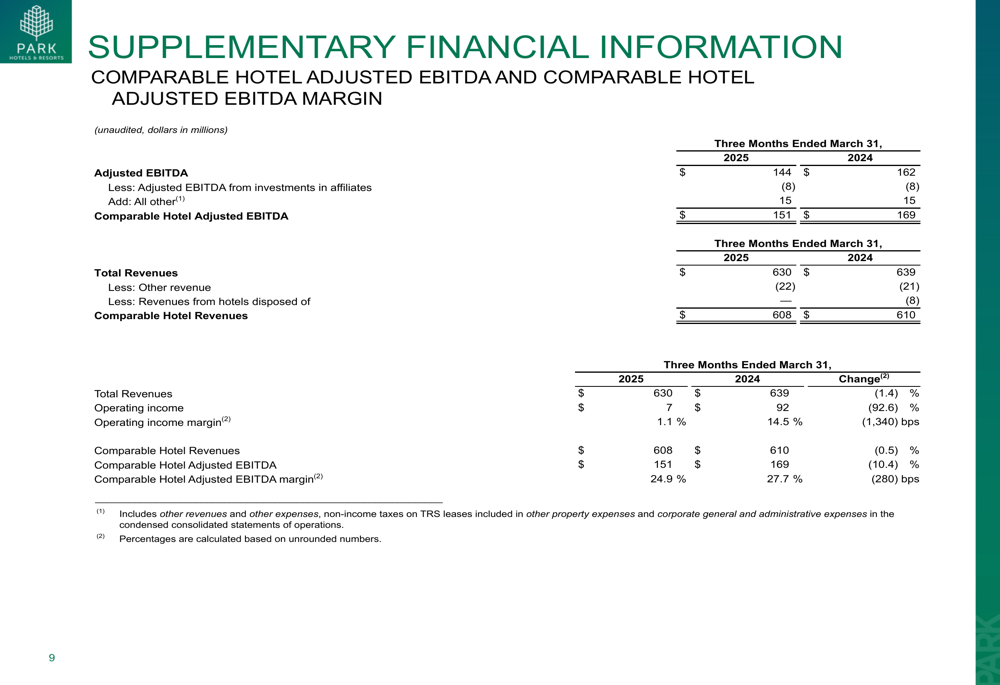
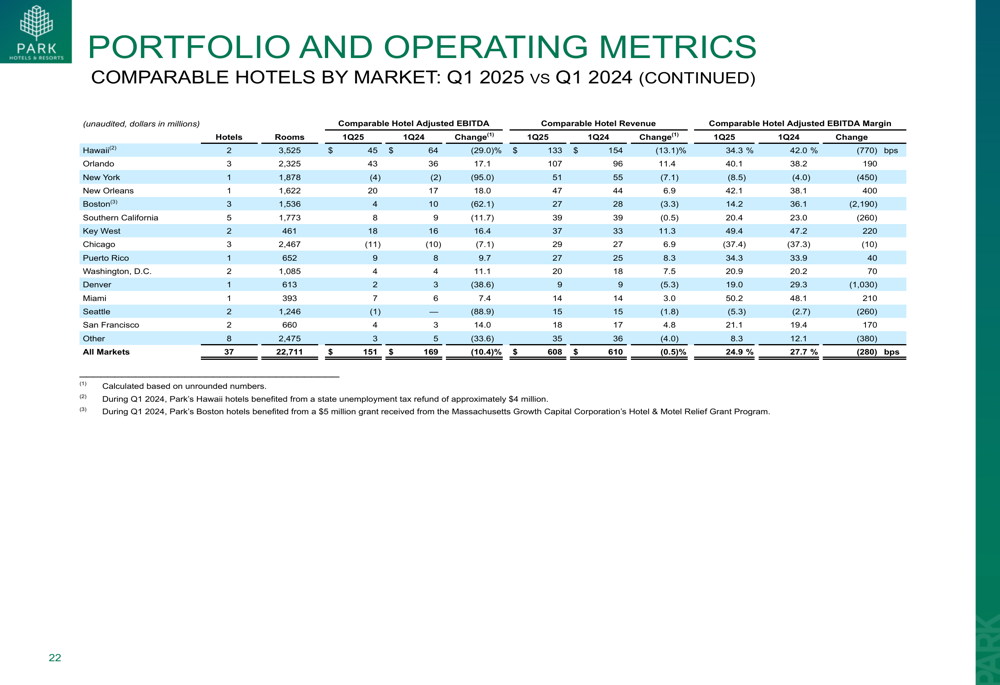
The company’s Adjusted EBITDA for Q1 2025 was $144 million, down 11.1% from $162 million in Q1 2024. Comparable Hotel Adjusted EBITDA margin decreased by 280 basis points to 24.9%, reflecting increased operational costs and reduced efficiency.
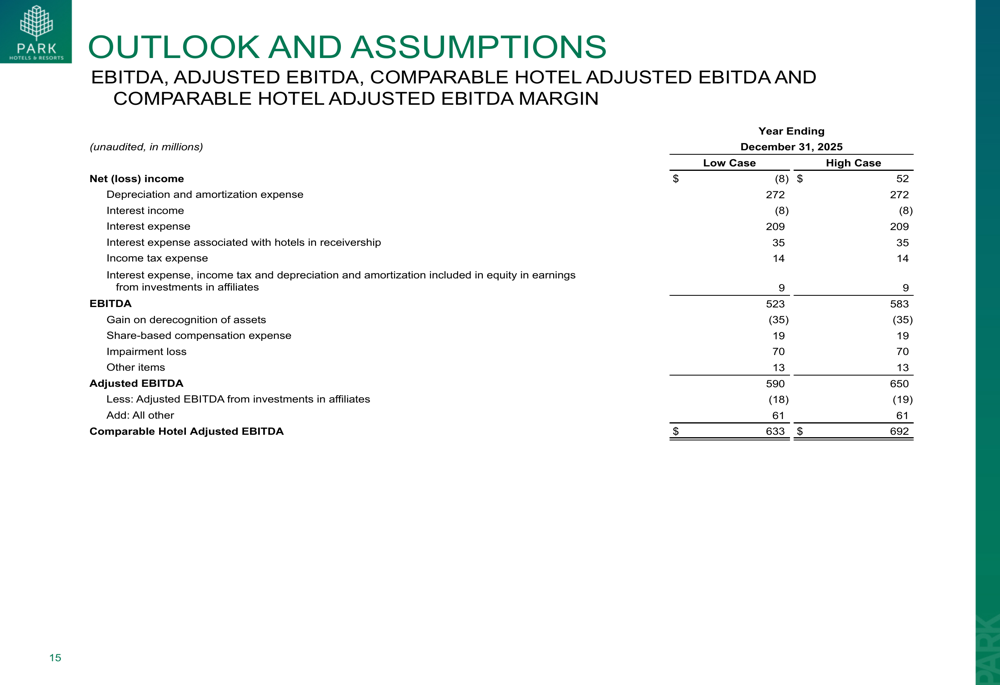
The following chart illustrates the reconciliation of net loss to EBITDA and Adjusted EBITDA:
Comparable Hotel Adjusted EBITDA and margin data further highlight the operational challenges:
From a balance sheet perspective, Park Hotels maintained a relatively stable debt position at $3.84 billion as of March 31, 2025, unchanged from December 31, 2024. However, the company’s leverage ratio, measured as Net Debt to TTM Comparable Adjusted EBITDA, increased to 5.95x from 5.52x at the end of 2024, indicating a deterioration in the company’s debt coverage metrics.
Cash and cash equivalents declined significantly to $233 million from $402 million at the end of 2024, partly due to dividend payments and ongoing capital expenditures.
Forward-Looking Statements
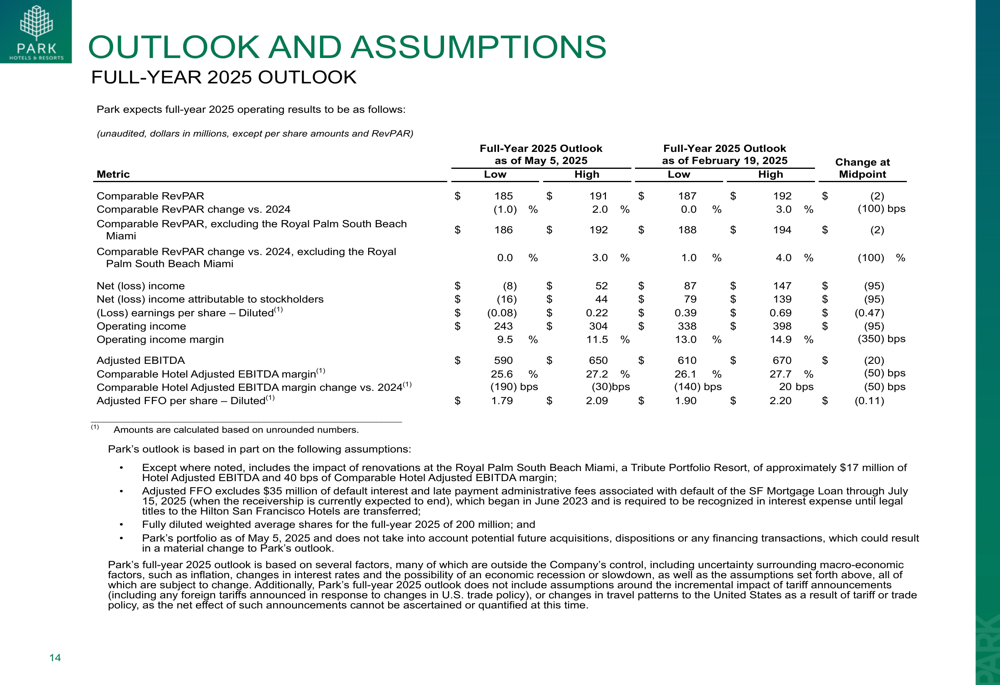
In response to the challenging first quarter results, Park Hotels substantially revised its full-year 2025 outlook. The company now expects:
- Comparable RevPAR of $185-$191, down from the previous forecast of $187-$192
- Comparable RevPAR growth of -1.0% to 2.0% versus 2024, down from the previous guidance of 0.0% to 3.0%
- Net (loss) income of $(8)-$52 million, a dramatic reduction from the previous outlook of $87-$147 million
- Adjusted EBITDA of $590-$650 million, down from $610-$670 million
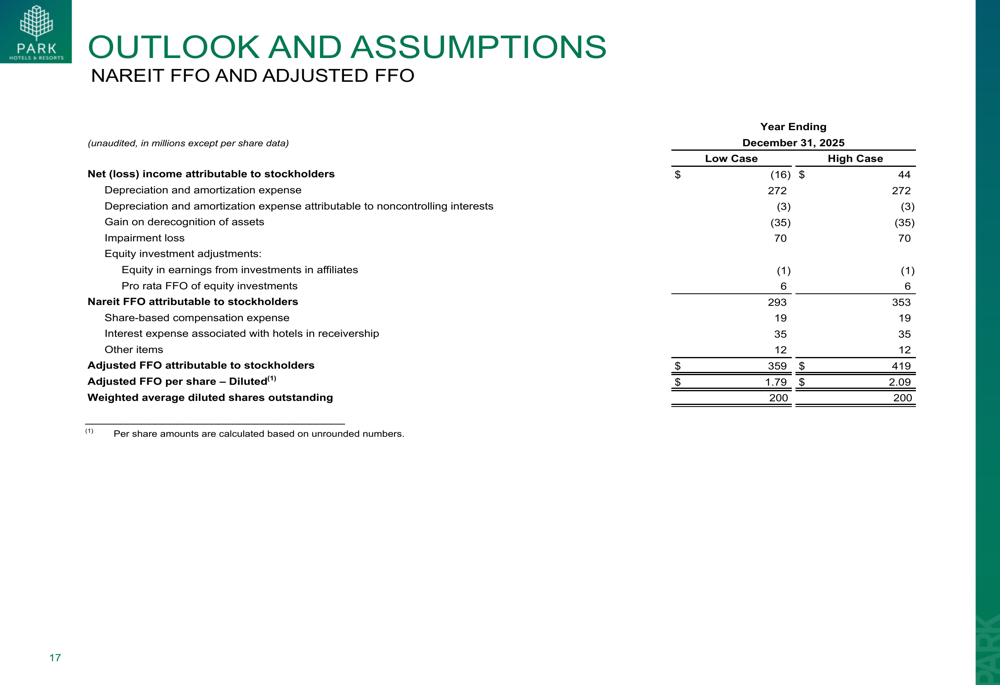
- Adjusted FFO per share of $1.79-$2.09, down from $1.90-$2.20
The following table details the revised outlook compared to the previous guidance:
The company also provided a detailed breakdown of its EBITDA and FFO outlook:
These significant downward revisions reflect management’s more cautious view on the lodging market for the remainder of 2025, particularly regarding occupancy rates and operational costs.
Portfolio Performance by Market
Park Hotels’ performance varied significantly across its different markets in Q1 2025. The company’s portfolio includes properties in key markets such as Hawaii, Orlando, New York, New Orleans, and Boston, among others.
The following table shows the detailed performance by market for Q1 2025 compared to Q1 2024:
Notable market performances included:
- Hawaii: RevPAR decreased by 4.1% to $252.48, with Hotel Adjusted EBITDA down 12.5%
- Orlando: RevPAR increased by 3.9% to $262.00, with Hotel Adjusted EBITDA up 5.9%
- New York: RevPAR increased by 1.1% to $142.71, though Hotel Adjusted EBITDA decreased by 6.2%
- San Francisco: RevPAR decreased by 9.9% to $124.46, with Hotel Adjusted EBITDA down 37.8%
The company’s core portfolio of 20 hotels, which includes flagship properties like Hilton Hawaiian Village Waikiki Beach Resort, New York Hilton Midtown, and Waldorf Astoria Orlando, generally outperformed the remainder of the portfolio, though with mixed results across individual properties.
Overall, Park Hotels & Resorts’ Q1 2025 results and revised outlook reflect ongoing challenges in the lodging sector, with margin pressure and occupancy declines offsetting modest ADR growth. The significant downward revision to full-year guidance suggests management expects these challenges to persist throughout 2025, creating continued uncertainty for investors in the near term.
Full presentation:
This article was generated with the support of AI and reviewed by an editor. For more information see our T&C.