Intel stock extends gains after report of possible U.S. government stake

Introduction & Market Context
Peoples Bancorp Inc . (NASDAQ:PEBO) released its first quarter 2025 earnings presentation on April 22, revealing solid performance with improving credit quality metrics and continued loan growth. The company reported net income of $24.3 million, translating to diluted earnings per share of $0.68, which included a one-time impact of $0.05. Despite the generally positive results, PEBO shares were down 1.05% to $27.55 in trading following the presentation.
The bank’s performance comes amid a shifting interest rate environment, with management anticipating Fed rate cuts later in 2025. Peoples Bancorp continues to position itself for these changes while maintaining focus on loan growth, deposit gathering, and credit quality improvement.
Quarterly Performance Highlights
Peoples Bancorp reported several positive financial metrics for the first quarter of 2025, including annualized loan growth exceeding 4% compared to the previous quarter and a 2% increase in deposit balances.
As shown in the company’s financial highlights slide, book value per share grew 2% to $31.90, while tangible book value per share increased 4% to $20.68. The tangible equity to tangible assets ratio improved by 33 basis points to 8.34%, reflecting strengthened capital position. The company also increased its quarterly dividend rate for the tenth consecutive year.
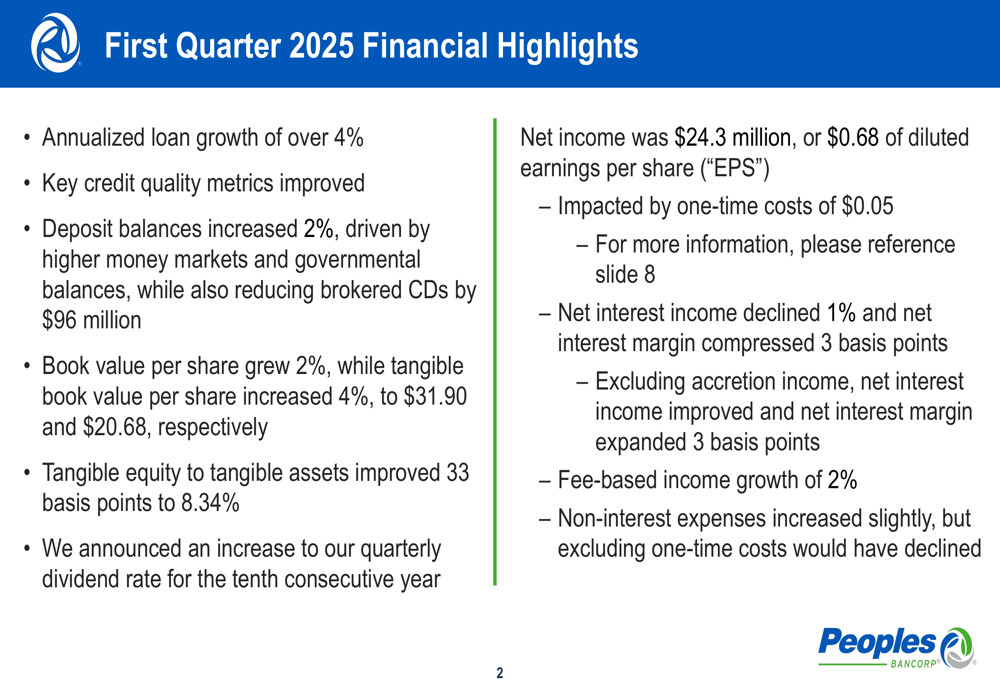
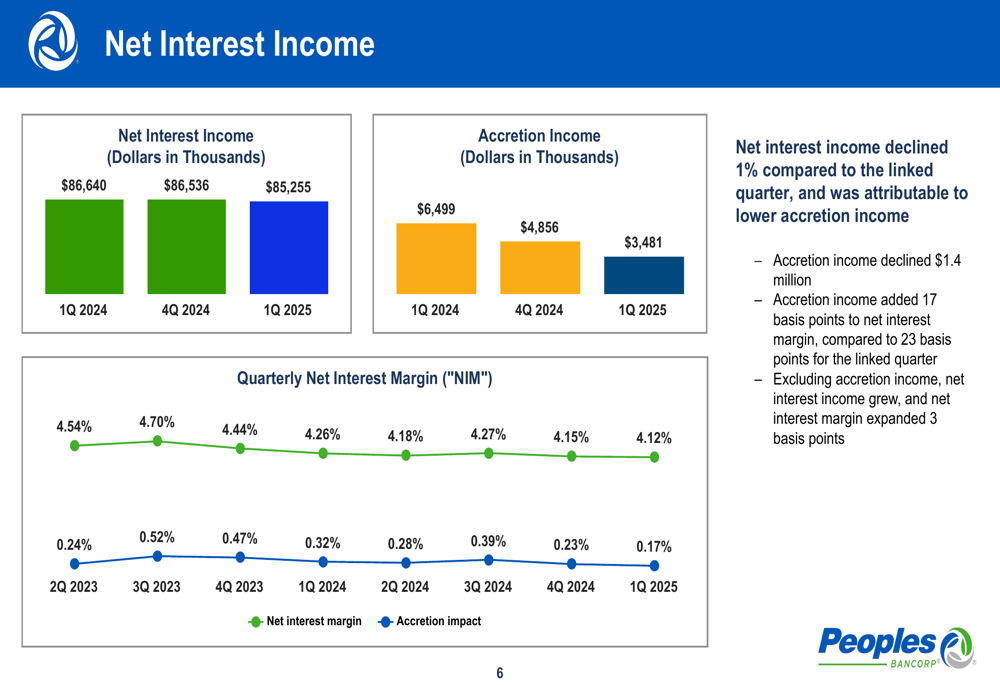
Net interest income declined 1% compared to the linked quarter, though this was primarily attributed to lower accretion income. Excluding this factor, net interest income improved and net interest margin expanded by 3 basis points. Fee-based income grew 2%, while non-interest expenses increased slightly.
Loan Portfolio and Asset Quality
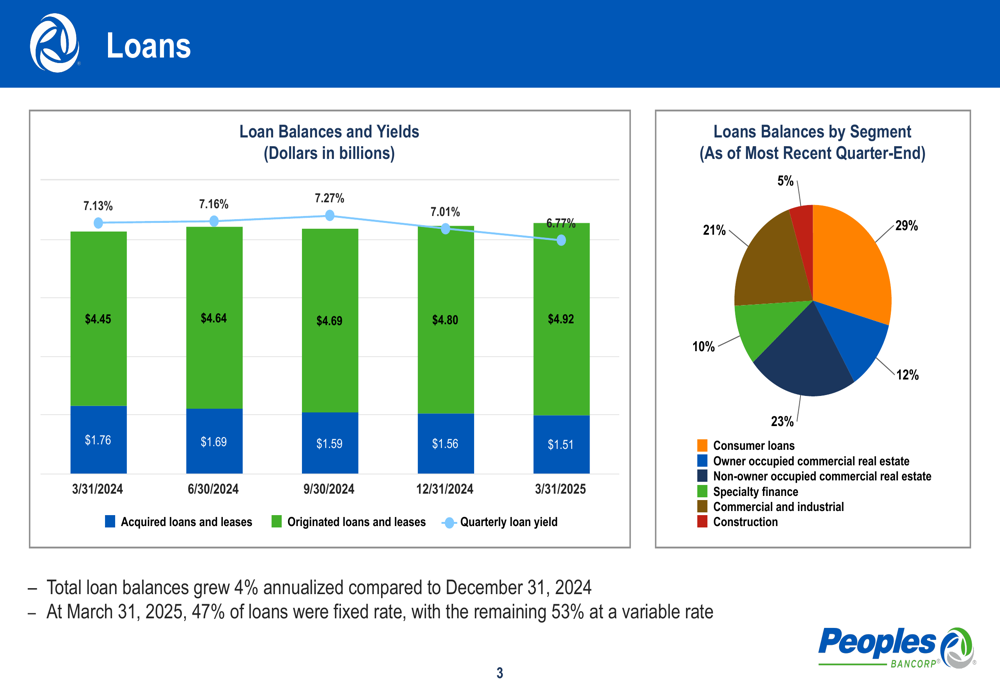
The bank’s loan portfolio showed healthy growth and diversification. Total (EPA:TTEF) loan balances grew at an annualized rate of 4% compared to December 31, 2024. As of March 31, 2025, 47% of loans were fixed rate, with the remaining 53% at variable rates.
The loan portfolio remains well-diversified across segments, with commercial real estate (both owner-occupied and non-owner occupied) comprising 35%, commercial and industrial loans at 21%, specialty finance at 29%, construction at 10%, and consumer loans at 5%.
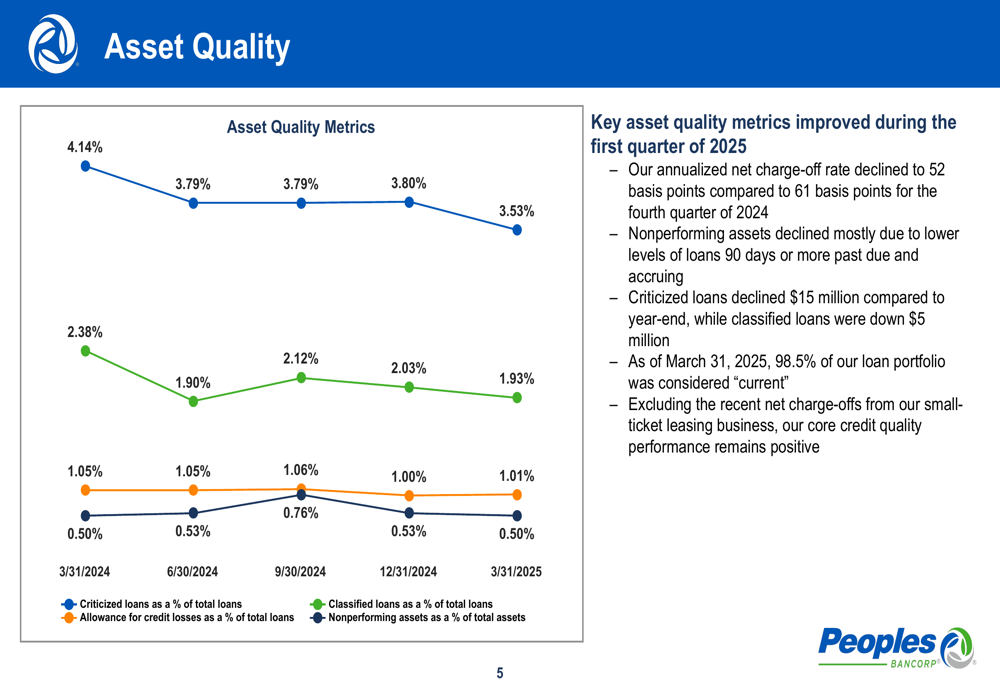
Credit quality metrics showed notable improvement during the first quarter. The annualized net charge-off rate declined to 52 basis points compared to 61 basis points in the fourth quarter of 2024. Criticized loans declined by $15 million compared to year-end, while classified loans were down $5 million. As of March 31, 2025, 98.5% of the loan portfolio was considered "current."
The following slide illustrates the improving trend in key asset quality metrics, including criticized and classified loans as a percentage of total loans, as well as nonperforming assets as a percentage of total assets:
North Star Leasing Performance
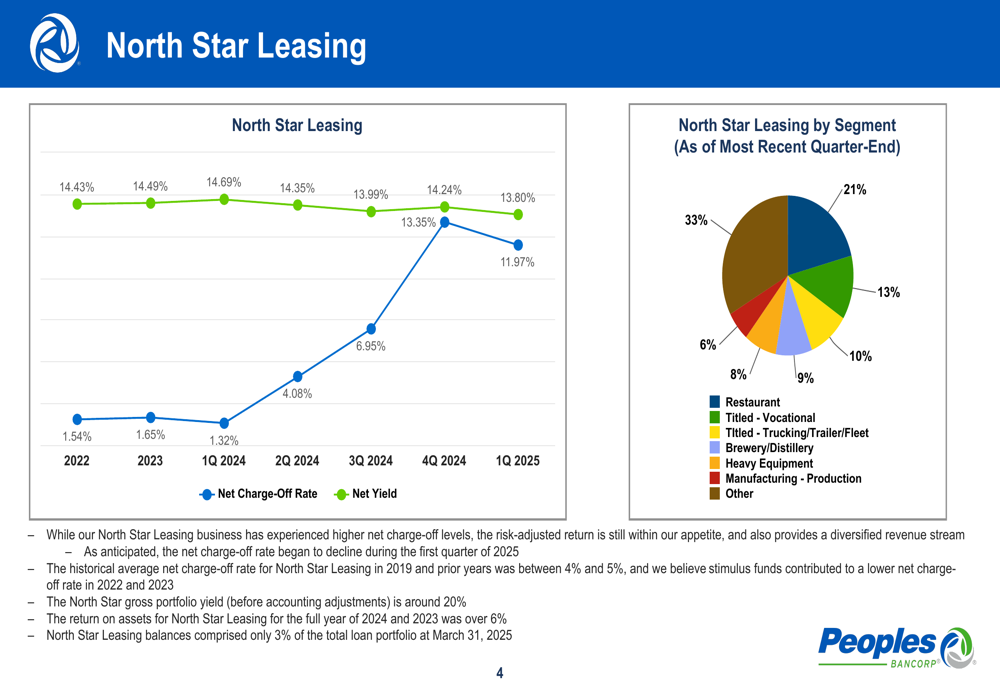
A notable improvement was seen in the North Star Leasing business, which had experienced elevated charge-off levels in previous quarters. As anticipated by management in their Q4 2024 earnings call, the net charge-off rate began to decline during the first quarter of 2025.
The company noted that while this segment has experienced higher net charge-offs, the risk-adjusted return remains within their appetite and provides a diversified revenue stream. The historical average net charge-off rate for North Star Leasing prior to 2019 was between 4% and 5%, with management attributing the lower rates in 2022 and 2023 to stimulus funds.
The North Star portfolio represents only 3% of the total loan portfolio as of March 31, 2025, limiting its overall impact on the bank’s performance. The gross portfolio yield remains strong at approximately 20%, with a return on assets exceeding 6% for both 2023 and 2024.
Net Interest Income and Margin
Net interest income declined 1% compared to the linked quarter, totaling $85.3 million. This decline was primarily attributed to lower accretion income, which fell from $4.9 million in Q4 2024 to $3.5 million in Q1 2025.
The quarterly net interest margin was 4.12%, with accretion income adding 17 basis points compared to 23 basis points in the previous quarter. Excluding accretion income, the core net interest margin expanded by 3 basis points, demonstrating underlying strength in the bank’s core earning assets.
Deposit Growth and Composition
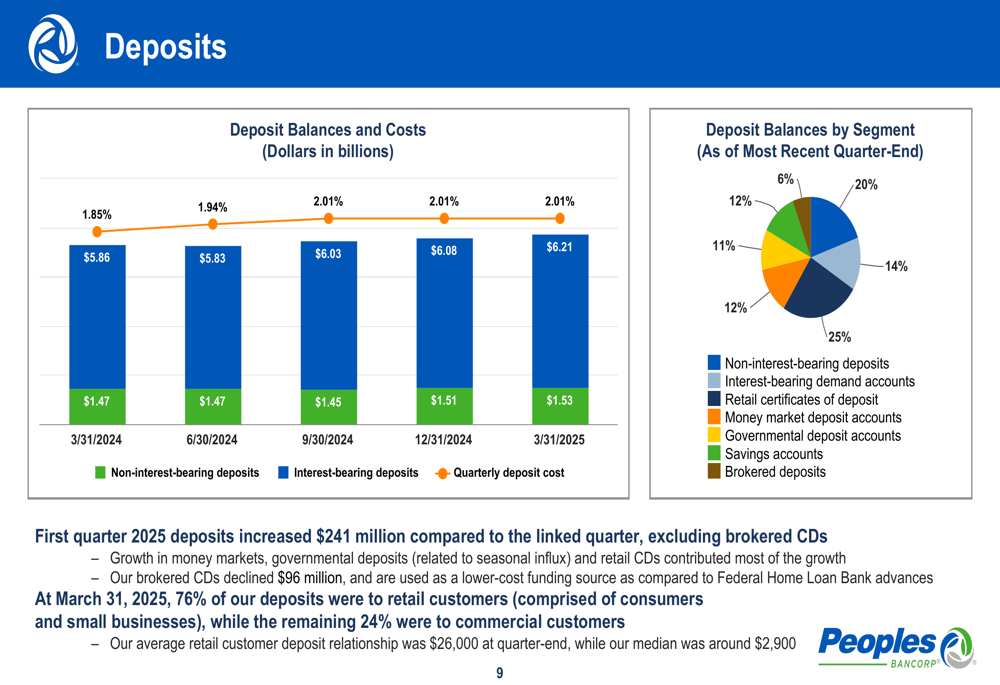
Peoples Bancorp reported strong deposit growth in the first quarter, with total deposits increasing by $241 million compared to the linked quarter (excluding brokered CDs). This growth was primarily driven by increases in money markets, governmental deposits, and retail CDs.
The bank also reduced its reliance on brokered CDs, which declined by $96 million during the quarter. Management noted that these are used as a lower-cost funding source compared to Federal Home Loan Bank advances.
As of March 31, 2025, 76% of deposits were from retail customers (consumers and small businesses), with the remaining 24% from commercial customers. The average retail customer deposit relationship was $26,000, while the median was approximately $2,900.
Capital Position
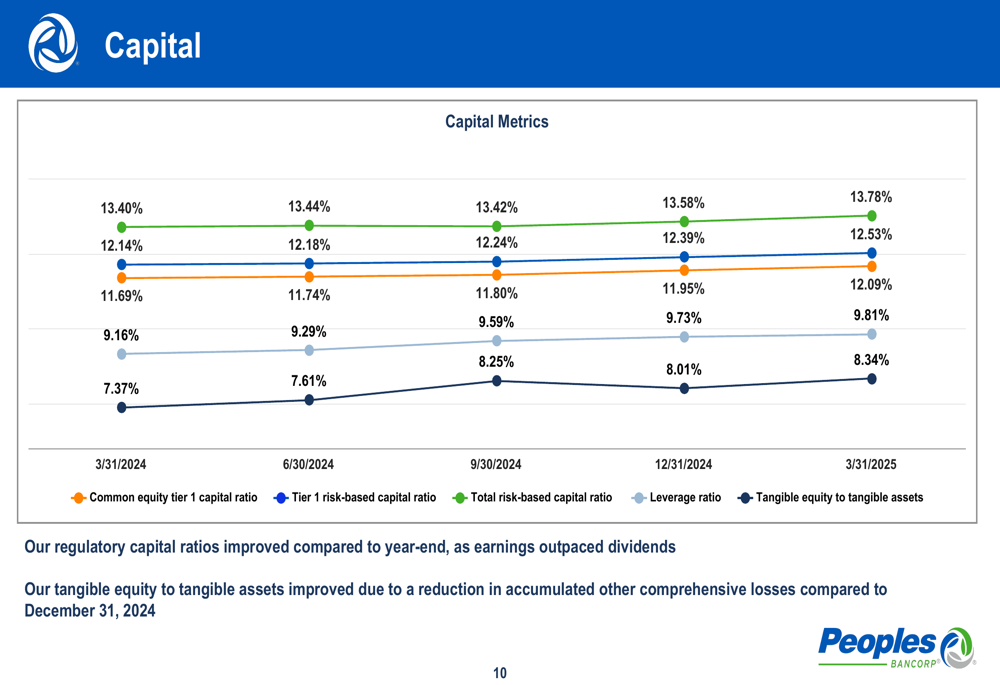
The company’s regulatory capital ratios improved compared to year-end, as earnings outpaced dividends. The common equity tier 1 capital ratio increased to 12.09% from 11.95% at year-end 2024, while the leverage ratio improved to 9.81% from 9.73%.
The tangible equity to tangible assets ratio improved to 8.34% from 8.01% at the end of 2024, primarily due to a reduction in accumulated other comprehensive losses.
2025 Outlook & Guidance
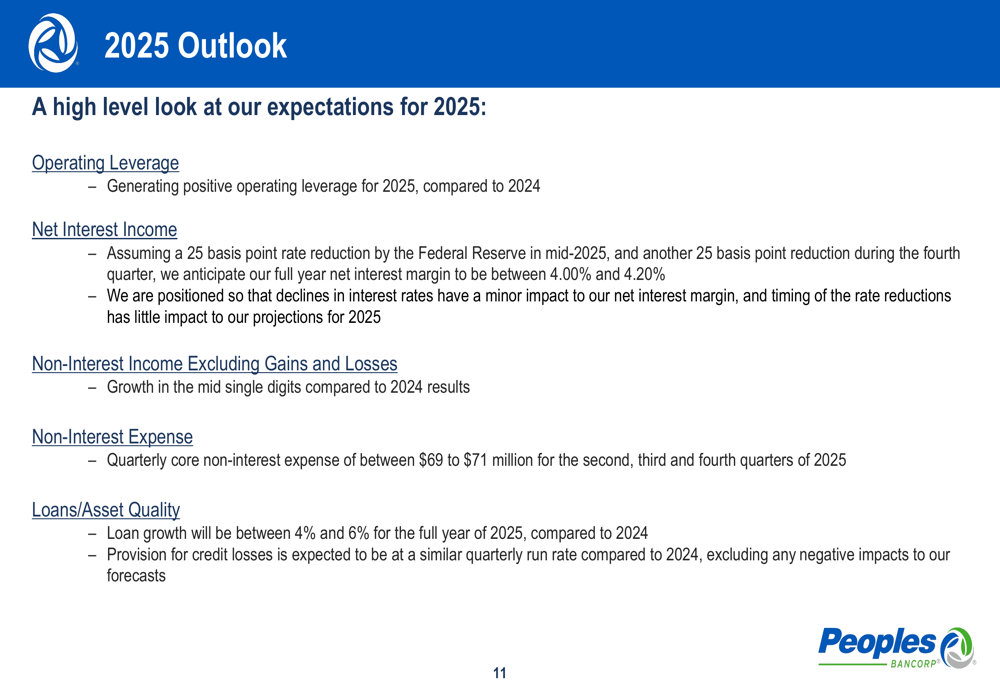
Looking ahead, management provided a positive outlook for 2025, expecting to generate positive operating leverage compared to 2024. The company anticipates its full-year net interest margin to be between 4.00% and 4.20%, assuming two 25 basis point rate reductions by the Federal Reserve in 2025.
Management noted that the bank is positioned so that declines in interest rates would have minimal impact on net interest margin, and the timing of rate reductions would have little effect on their 2025 projections.
Additional guidance includes:
- Non-interest income growth in the mid-single digits compared to 2024
- Quarterly core non-interest expense between $69-71 million for Q2-Q4 2025
- Loan growth between 4-6% for the full year
- Provision for credit losses expected to remain at a similar quarterly run rate compared to 2024
This outlook aligns with comments made by management during their Q4 2024 earnings call, where they expressed cautious optimism about business conditions and emphasized their asset-neutral positioning relative to interest rates.
The Q1 2025 results demonstrate Peoples Bancorp’s continued execution of its strategy, with improving credit metrics, stable margins, and controlled expense growth positioning the bank well for the anticipated changing rate environment in the remainder of 2025.
Full presentation:
This article was generated with the support of AI and reviewed by an editor. For more information see our T&C.