Stock market today: Stocks fall as investors rotate out of tech into Jackson Hole

Perimeter Solutions (NASDAQ:PRM) reported strong financial results for the second quarter of 2025, with significant growth in both revenue and adjusted profitability metrics. The company’s presentation, delivered on August 7, 2025, highlighted robust performance across its Fire Safety and Specialty Products segments, though a notable gap persists between GAAP and adjusted earnings figures.
Quarterly Performance Highlights
Perimeter Solutions delivered consolidated revenue of $162.6 million in Q2 2025, representing a 28% increase from $127.3 million in the same period last year. Adjusted EBITDA grew even more impressively, rising 41% to $91.3 million, with adjusted EBITDA margin expanding from 51% to 56%.
However, GAAP earnings per share turned negative at -$0.22 compared to positive $0.14 in Q2 2024, while adjusted earnings per share increased from $0.25 to $0.39. This divergence primarily stems from founders advisory fees and other non-recurring expenses.
As shown in the following comprehensive financial summary:
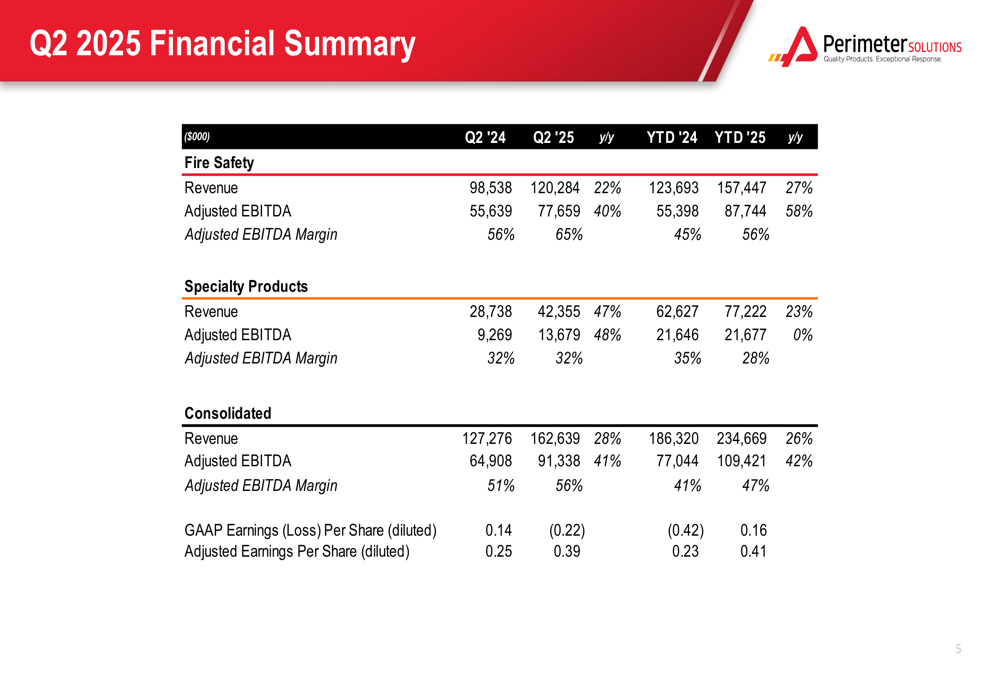
The company’s year-to-date performance through June 30, 2025, showed similar strength, with consolidated revenue up 26% to $234.7 million and adjusted EBITDA growing 42% to $109.4 million. Year-to-date GAAP EPS was positive at $0.16, compared to -$0.42 in the first half of 2024.
Segment Analysis
Both of Perimeter Solutions’ business segments contributed to the strong quarterly performance, though with different growth profiles.
The Fire Safety segment, which includes the company’s fire retardant products, saw revenue increase 22% to $120.2 million, while adjusted EBITDA grew 40% to $77.7 million. The segment’s adjusted EBITDA margin improved significantly from 56% to 65%.
Even more impressive was the Specialty Products segment, which experienced 47% revenue growth to $42.3 million and 48% adjusted EBITDA growth to $13.7 million. This segment maintained a consistent adjusted EBITDA margin of 32%.
This performance builds on the momentum seen in Q1 2025, when the company reported a 22% year-over-year revenue increase to $72 million, beating analyst expectations with an EPS of $0.03 against a forecasted -$0.11.
Capital Allocation Strategy
Perimeter Solutions outlined its capital allocation priorities, demonstrating a balanced approach to reinvestment and shareholder returns. The company allocated $9.7 million to capital expenditures in Q2 2025, supporting customer needs and driving productivity improvements.
The presentation highlighted significant M&A activity with $20.0 million allocated during the quarter, while also returning capital to shareholders through substantial share buybacks totaling $32.2 million.
As illustrated in the company’s capital allocation framework:
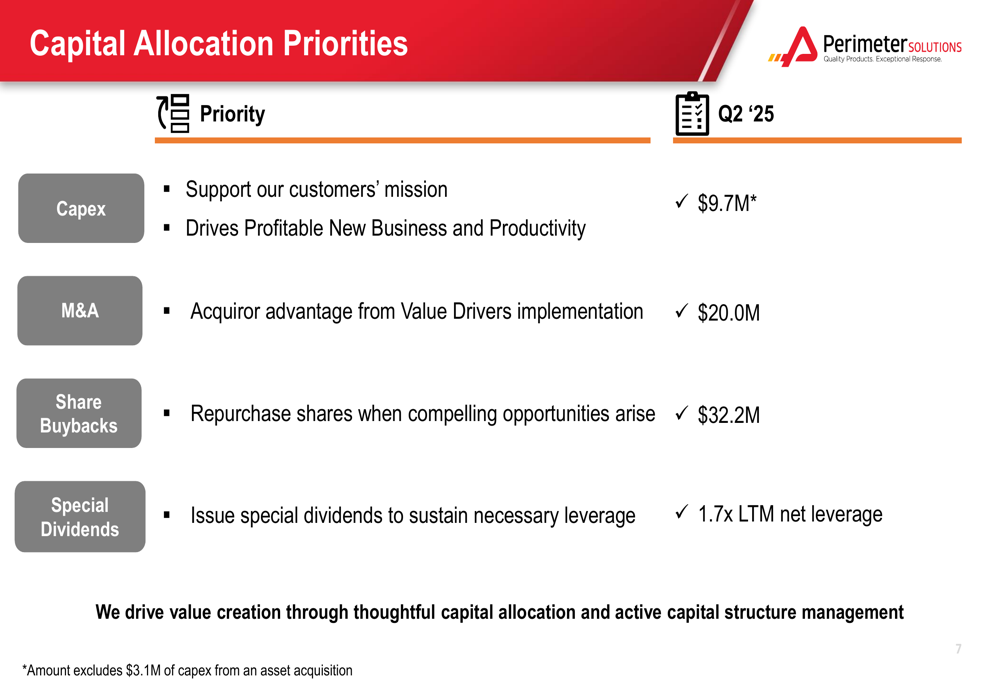
The company’s approach to capital allocation emphasizes maintaining a target leverage ratio of 1.7x LTM net leverage, with special dividends considered as a mechanism to sustain this level when appropriate.
Debt Profile and Liquidity
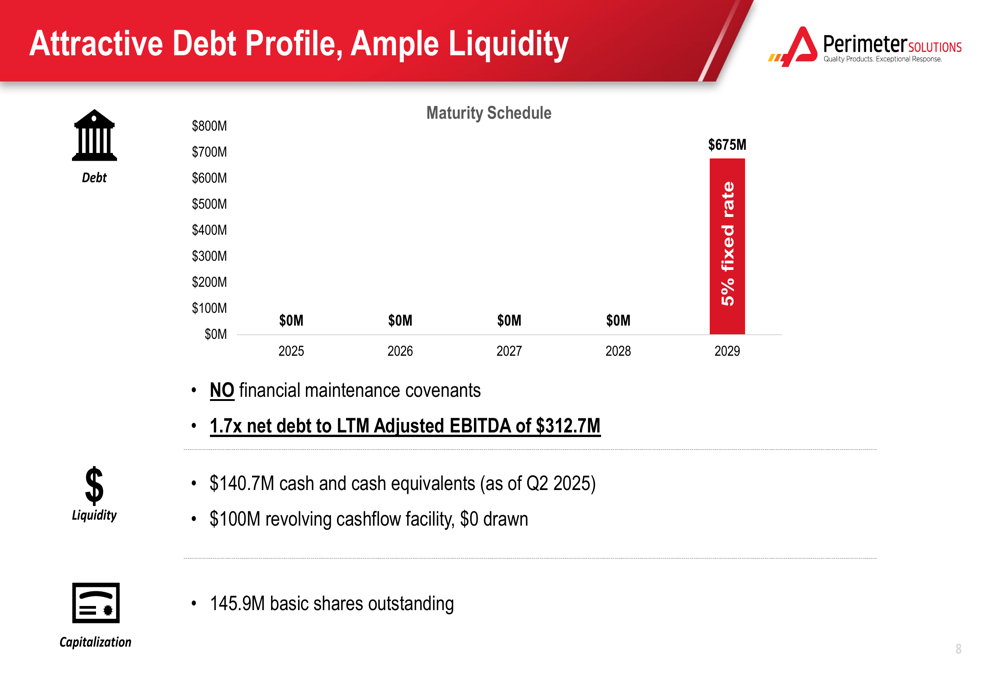
Perimeter Solutions maintains a straightforward debt structure with $675 million in senior notes due in 2029 at a 5% fixed rate. With $140.7 million in cash and cash equivalents as of Q2 2025, the company’s net debt stands at $534.3 million.
This results in a net debt to LTM adjusted EBITDA ratio of 1.7x, in line with the company’s target. The debt contains no financial maintenance covenants, providing operational flexibility. Additionally, the company has a $100 million revolving credit facility that remains undrawn, further enhancing its liquidity position.
The following chart illustrates the company’s debt maturity profile and liquidity position:
GAAP vs. Adjusted Earnings Analysis
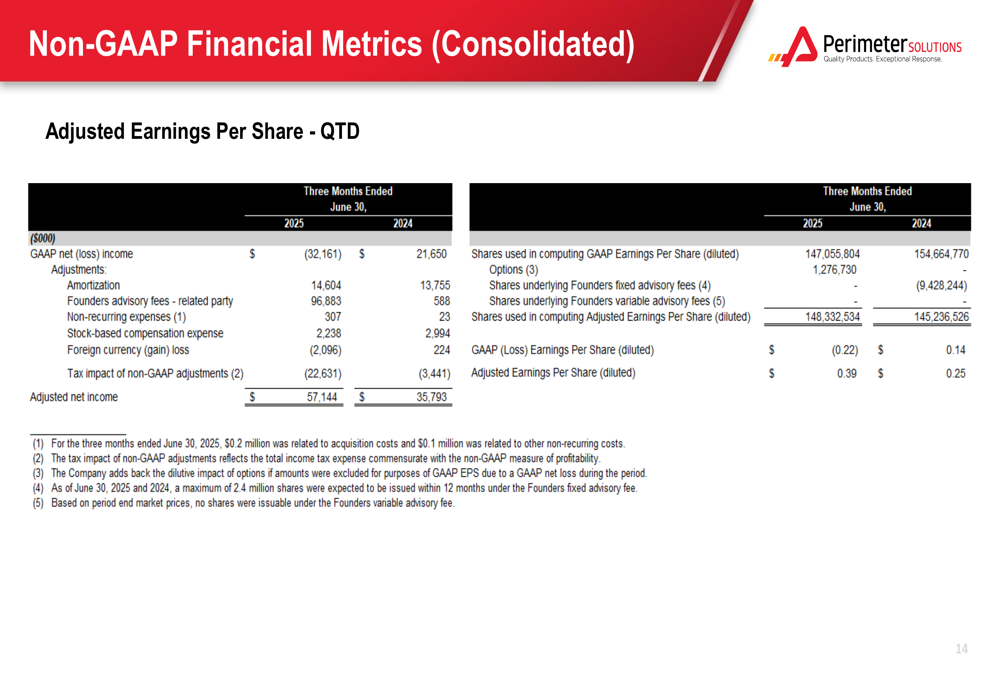
The significant difference between GAAP and adjusted earnings metrics warrants closer examination. For Q2 2025, the company reported a GAAP net loss of $32.2 million but adjusted net income of $57.1 million.
The primary adjustments include $13.6 million in amortization expenses, $76.9 million in founders advisory fees, and smaller adjustments for non-recurring expenses, stock-based compensation, and foreign currency effects.
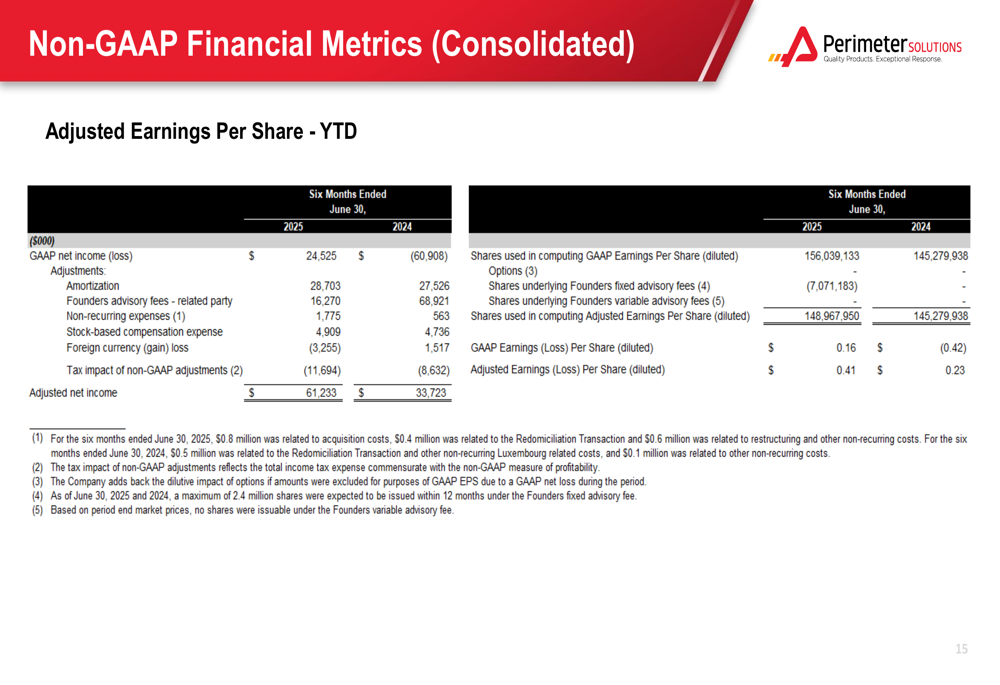
The detailed reconciliation of GAAP to adjusted earnings per share is shown below:
Year-to-date figures show a similar pattern, with GAAP net income of $24.5 million adjusted to $61.2 million in adjusted net income, as illustrated here:
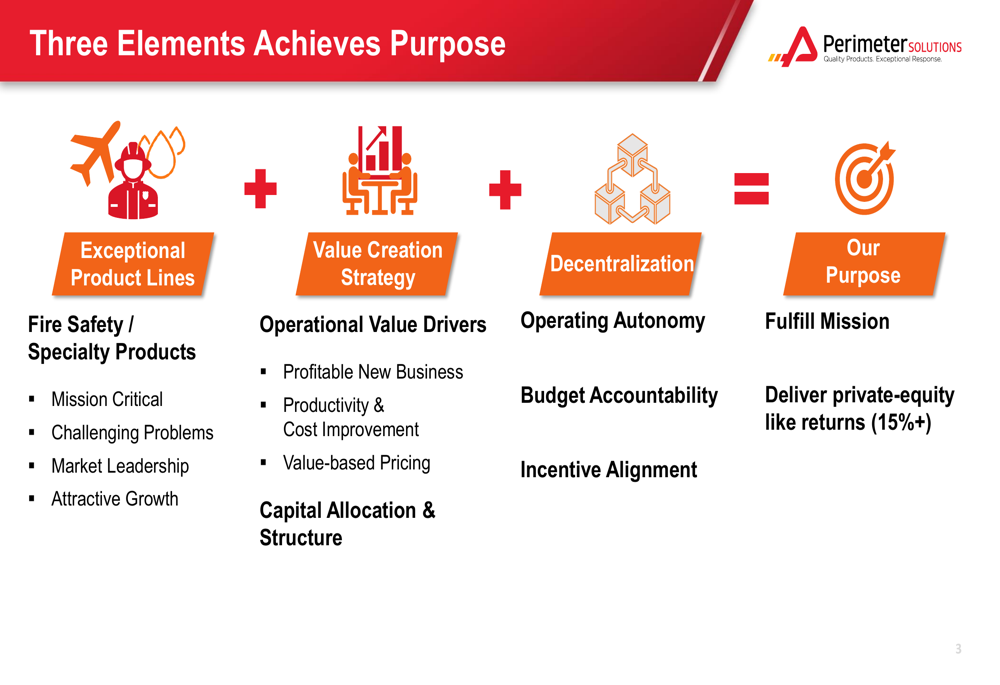
Strategic Framework
Perimeter Solutions frames its business strategy around three core elements: Exceptional Product Lines, Value Creation Strategy, and Decentralization. The company aims to deliver "private-equity like returns (15%+)" through this approach.
The Fire Safety and Specialty Products segments are positioned as mission-critical offerings addressing challenging problems with market leadership and attractive growth potential. The value creation strategy focuses on profitable new business, productivity improvements, and value-based pricing.
This strategic framework is visualized in the following slide:
Forward-Looking Statements
Looking ahead, Perimeter Solutions provided long-term financial assumptions to guide investor expectations. These include approximately $40 million in annual interest expense, $20-25 million in tax-deductible depreciation and amortization, a cash tax rate of 20-25%, and capital expenditures of $15-30 million annually.
The company also expects annual working capital changes to represent approximately 10% of revenue growth, providing insight into future cash flow dynamics.
While the Q2 presentation showed strong results, investors should note that in the Q1 2025 earnings call, management mentioned manufacturing issues that could impact full-year 2025 EBITDA, with expectations for normalized earnings by 2026. The Q2 presentation did not specifically address whether these issues have been resolved.
With shares closing at $15.82 on August 6, 2025, down 0.88% for the day, Perimeter Solutions trades well above its 52-week low of $8.76 but below its 52-week high of $17.40, suggesting investors remain cautiously optimistic about the company’s growth trajectory despite the gap between GAAP and adjusted earnings.
Full presentation:
This article was generated with the support of AI and reviewed by an editor. For more information see our T&C.