Asia FX cautious amid US govt shutdown; yen tumbles after Takaichi’s LDP win
Introduction & Market Context
Procter & Gamble (NYSE:PG) presented its fourth quarter and full fiscal year 2025 results on July 29, 2025, highlighting modest but steady growth in a challenging market environment. The consumer goods giant reported Q4 earnings per share of $1.48, exceeding analyst expectations of $1.42 by 4.23%. Following the earnings announcement, P&G shares edged up 0.15% in pre-market trading to $157.35.
The company maintained its position as a stable performer in the consumer staples sector, with a focus on returning value to shareholders while navigating headwinds including increased commodity costs and tariff impacts. P&G’s presentation revealed a strategic approach to growth through innovation, productivity, and market share protection across its diverse portfolio of household brands.
Quarterly Performance Highlights
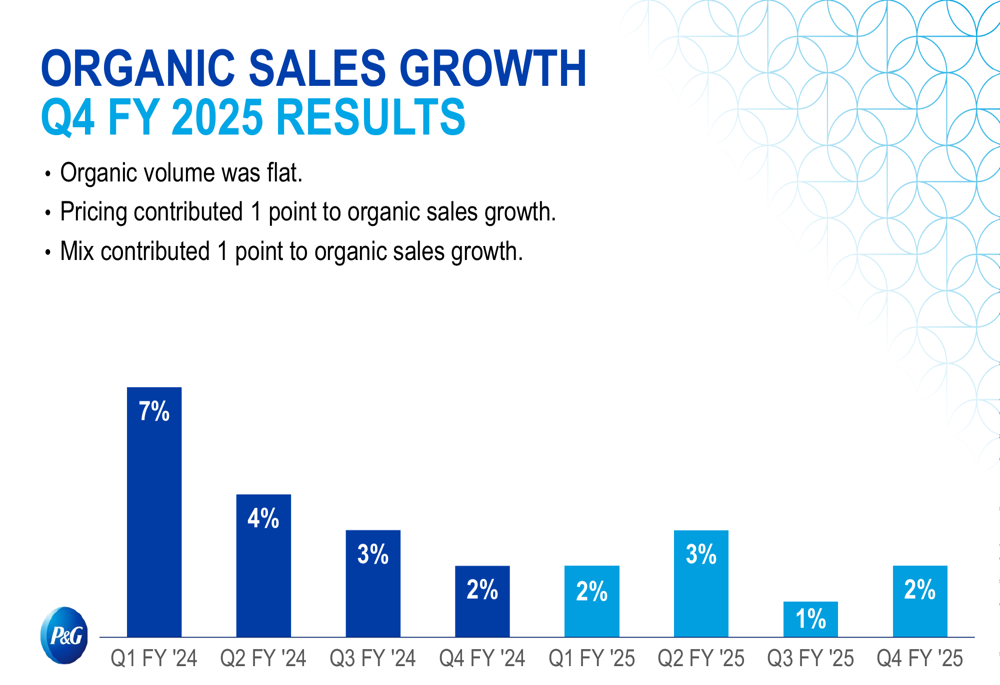
P&G’s fourth quarter results showed signs of stabilization with organic sales growth of 2%, driven by a 1% contribution from pricing and a 1% contribution from mix, while volume remained flat. Core EPS grew by 6% year-over-year, outpacing the full-year growth rate and demonstrating momentum heading into fiscal 2026.
As shown in the following chart of quarterly organic sales growth, P&G has maintained consistent, if modest, growth over the past eight quarters:
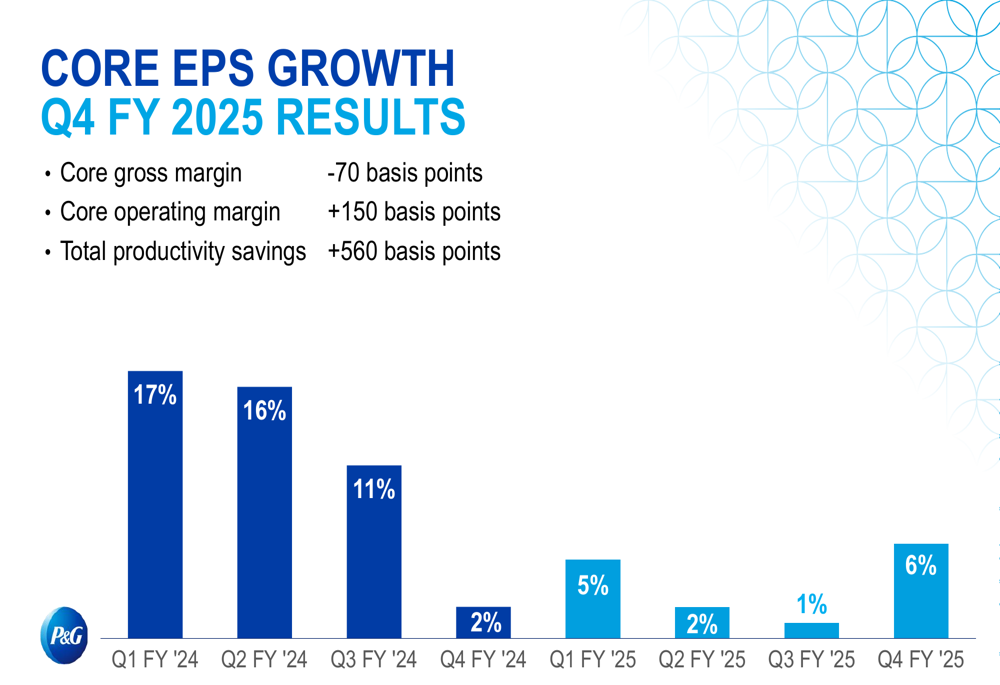
The company’s core EPS growth for Q4 FY 2025 reached 6%, representing a recovery from the previous quarter’s 1% growth. This improvement was supported by productivity savings of 560 basis points, which helped offset a 70 basis point decline in core gross margin.
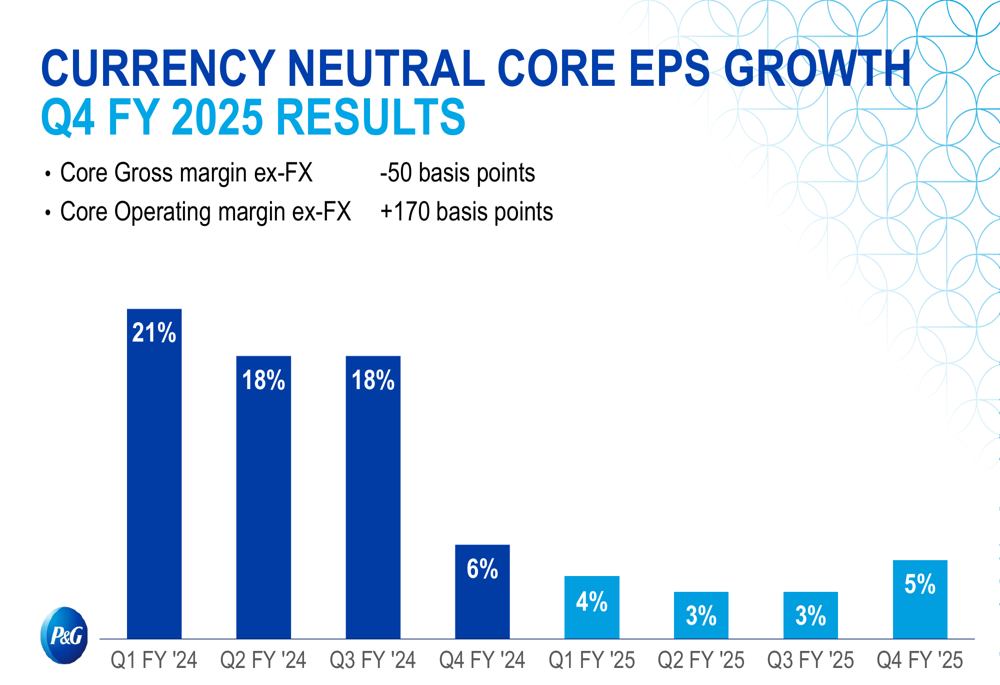
On a currency-neutral basis, Q4 core EPS growth was 5%, with core operating margin expanding by 170 basis points, demonstrating P&G’s ability to drive efficiency despite challenging market conditions.
Detailed Financial Analysis
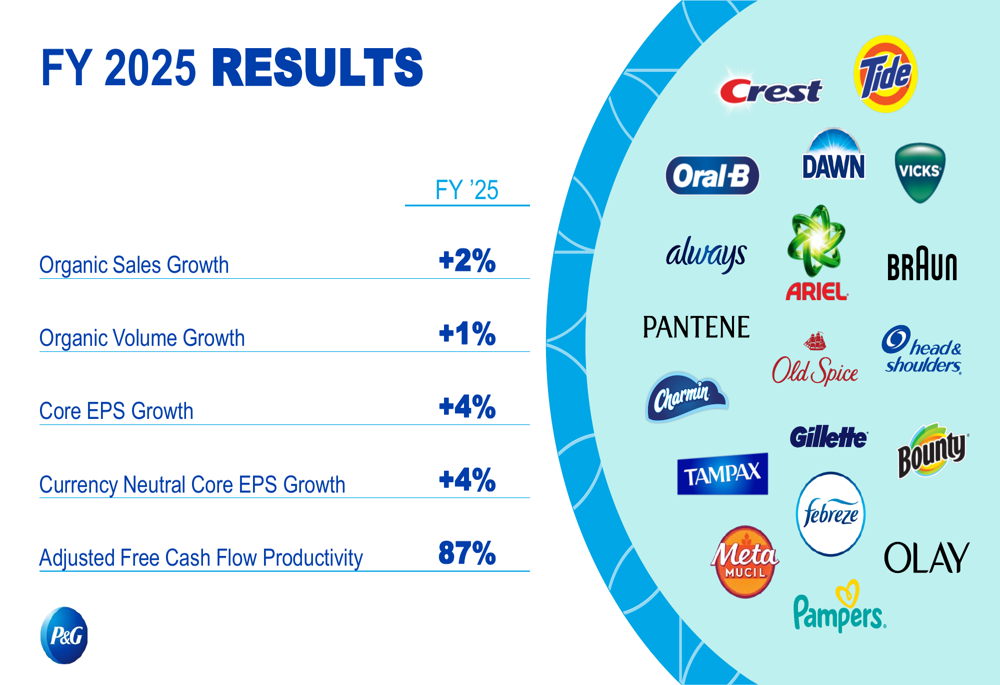
For the full fiscal year 2025, P&G delivered organic sales growth of 2%, with volume contributing 1% and pricing contributing another 1%. Core EPS for the year increased by 4% to $6.83, matching the currency-neutral core EPS growth rate.
The company’s fiscal year performance is illustrated in the following summary:
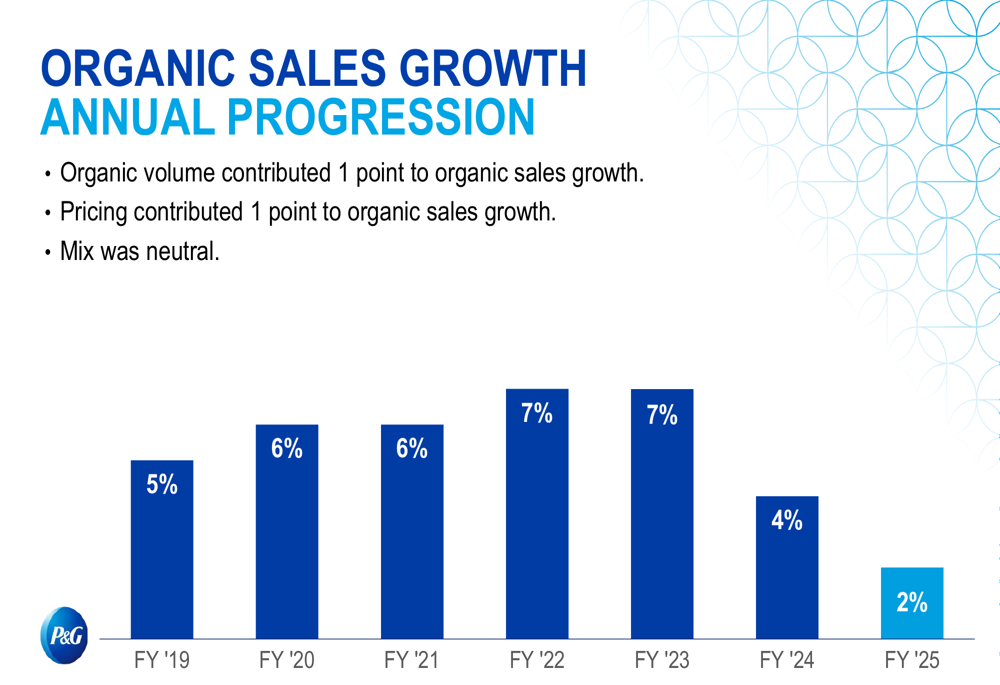
P&G’s organic sales growth has moderated in recent years, as shown in the annual progression chart:
Looking at segment performance for Q4 FY 2025, all five business segments delivered positive organic sales growth:
1. Beauty: 1% organic sales growth with 4% net earnings growth
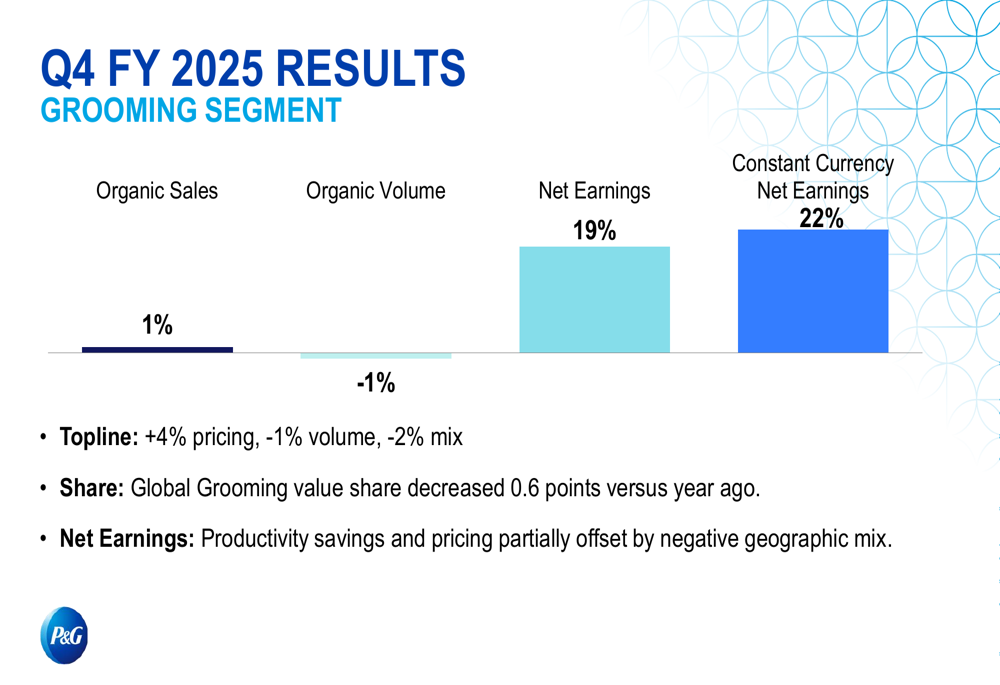
2. Grooming: 1% organic sales growth with impressive 19% net earnings growth
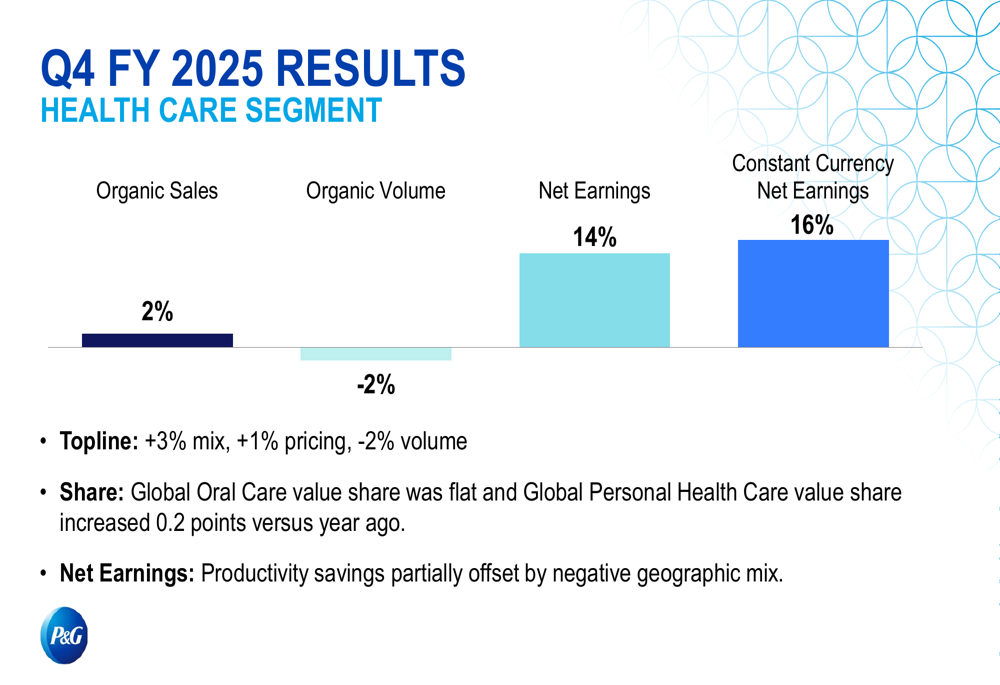
3. Health Care: 2% organic sales growth with 14% net earnings growth
4. Fabric & Home Care: 1% organic sales growth with 11% net earnings growth
5. Baby, Feminine & Family Care: 1% organic sales growth with 12% net earnings growth
The Health Care segment demonstrated particular strength with 2% organic sales growth despite a 2% volume decline, as pricing and favorable mix contributed positively. Global Personal Health Care value share increased by 0.2 points versus the prior year.
In the Grooming segment, strong net earnings growth of 19% (22% on a constant currency basis) was driven by productivity savings and pricing, which more than offset negative geographic mix impacts.
Strategic Initiatives
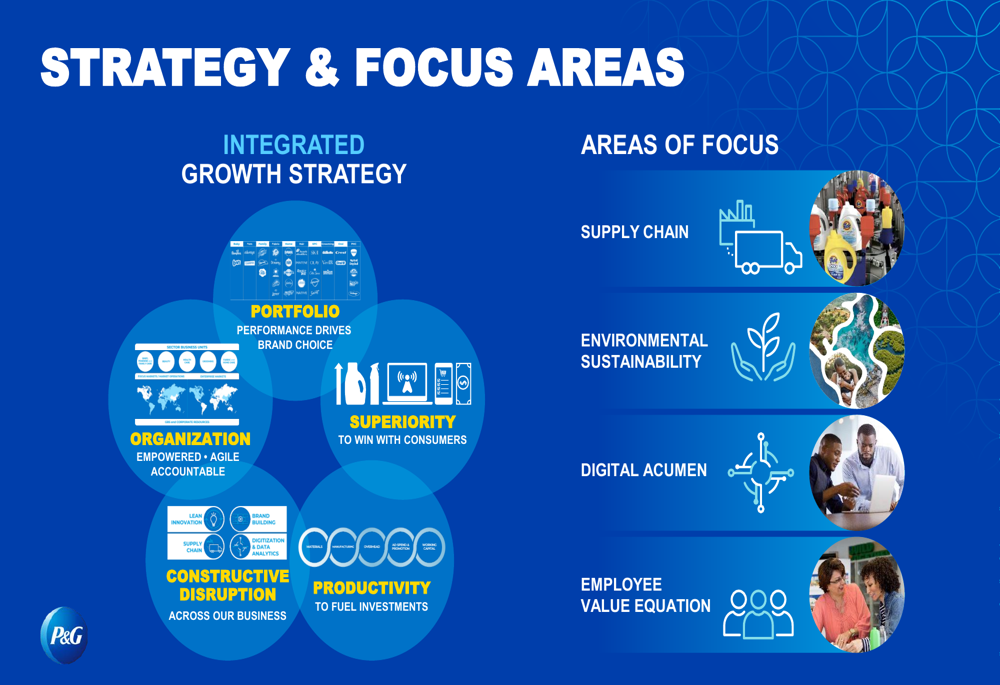
P&G’s presentation highlighted its integrated growth strategy focused on five interconnected areas: portfolio management, organizational structure, product superiority, productivity, and constructive disruption. This strategic framework guides the company’s approach to competing in key market sectors and addressing focus areas including supply chain optimization, environmental sustainability, digital acumen, and employee value.
The following illustration outlines P&G’s strategic approach:
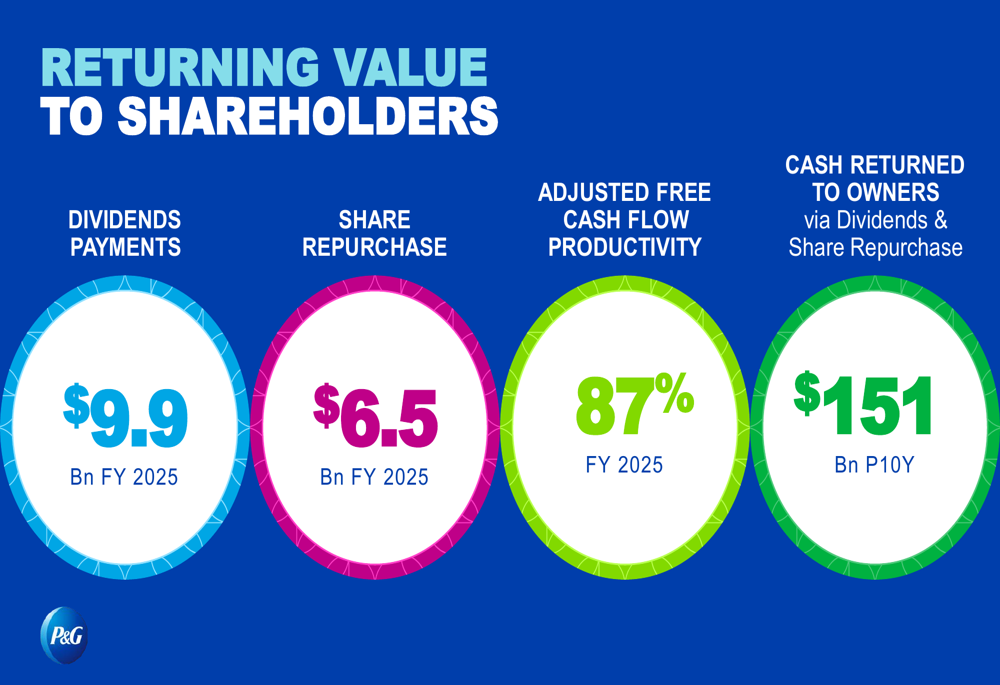
A key component of P&G’s strategy involves returning value to shareholders. In FY 2025, the company paid $9.9 billion in dividends and repurchased $6.5 billion in shares, with a total of $151 billion returned to owners via dividends and share repurchases over the past decade. The earnings article confirmed a 5% increase in the company’s dividend, further demonstrating P&G’s commitment to shareholder returns.
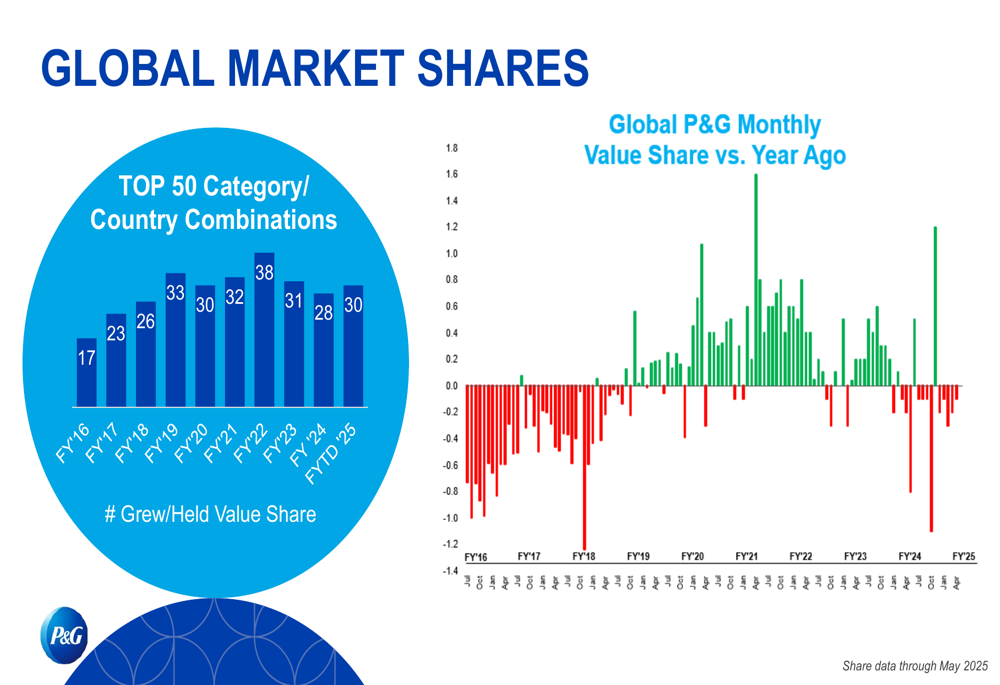
P&G has maintained a strong position in global markets, with 30 of the top 50 category/country combinations holding or growing value share in FY 2025. This represents an improvement from FY 2016, when only 17 combinations held or grew share.
Forward-Looking Statements
Looking ahead to fiscal 2026, P&G provided guidance reflecting cautious optimism amid continued market challenges. The company expects organic sales growth of 0% to 4%, with net sales growth of 1% to 5% including a 1% positive impact from foreign exchange, acquisitions, and divestitures.
Core EPS growth is projected at 0% to 4%, with all-in EPS growth of 3% to 9%. The guidance accounts for several significant headwinds, including:
- $0.2 billion after-tax headwind from commodities
- $0.8 billion after-tax headwind from tariffs
- $0.10 EPS headwind from a higher tax rate
The comprehensive FY 2026 guidance is summarized below:
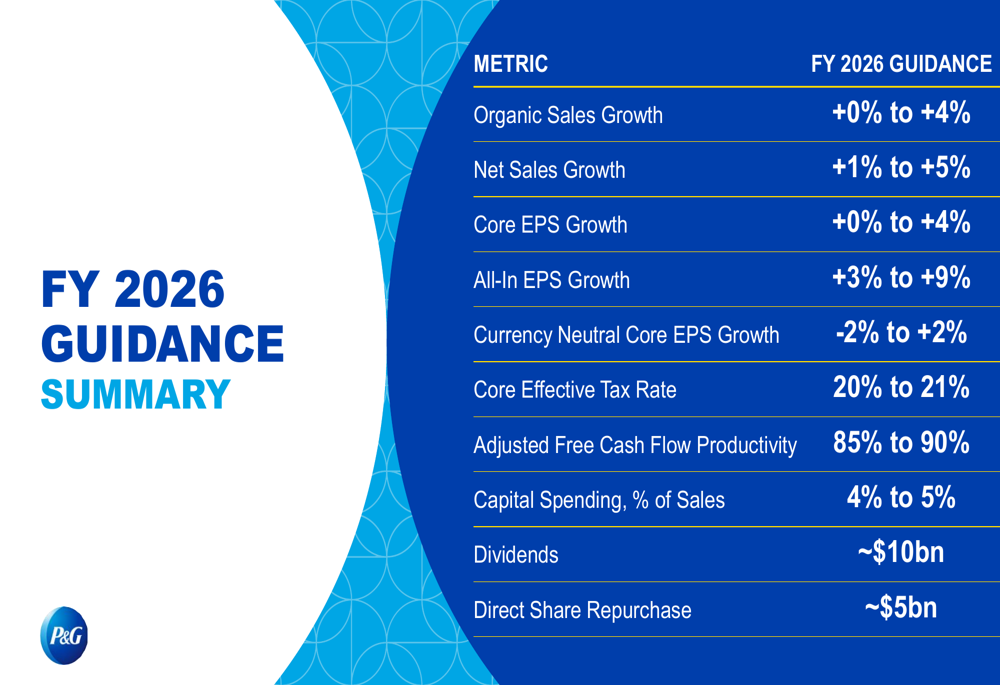
P&G plans to continue its shareholder return strategy in FY 2026, with approximately $10 billion in dividend payments and $5 billion in direct share repurchases. Capital spending is expected to be 4% to 5% of sales, and adjusted free cash flow productivity is projected at 85% to 90%.
The company also identified potential headwinds not included in the guidance, such as significant deceleration of market growth rates, currency weakness, additional commodity cost increases, geopolitical disruptions, major supply chain disruptions, and significant tariff changes.
According to the earnings call transcript, CFO Andre Schulten emphasized the company’s proactive approach, stating, "Our job is to create our own tailwinds." CEO John Moeller acknowledged the balance of challenges and opportunities, noting, "We have never faced more challenges than we currently do. The good news is we’ve never had more opportunities than we currently do."
The presentation and earnings call also referenced a significant restructuring plan targeting $1.5 billion in savings, which includes a planned reduction of 7,000 non-manufacturing roles. This initiative, along with the company’s focus on innovation and productivity, will be crucial as P&G navigates the complex market environment in fiscal 2026.
Full presentation:
This article was generated with the support of AI and reviewed by an editor. For more information see our T&C.