Joby Aviation closes $591 million stock offering with full underwriter option

Raymond James Financial Inc (NYSE:RJF) reported its fiscal third-quarter 2025 results on July 23, showing revenue growth but declining profitability as expenses outpaced revenue gains. The financial services firm continues to return significant capital to shareholders despite facing margin pressure.
Quarterly Performance Highlights
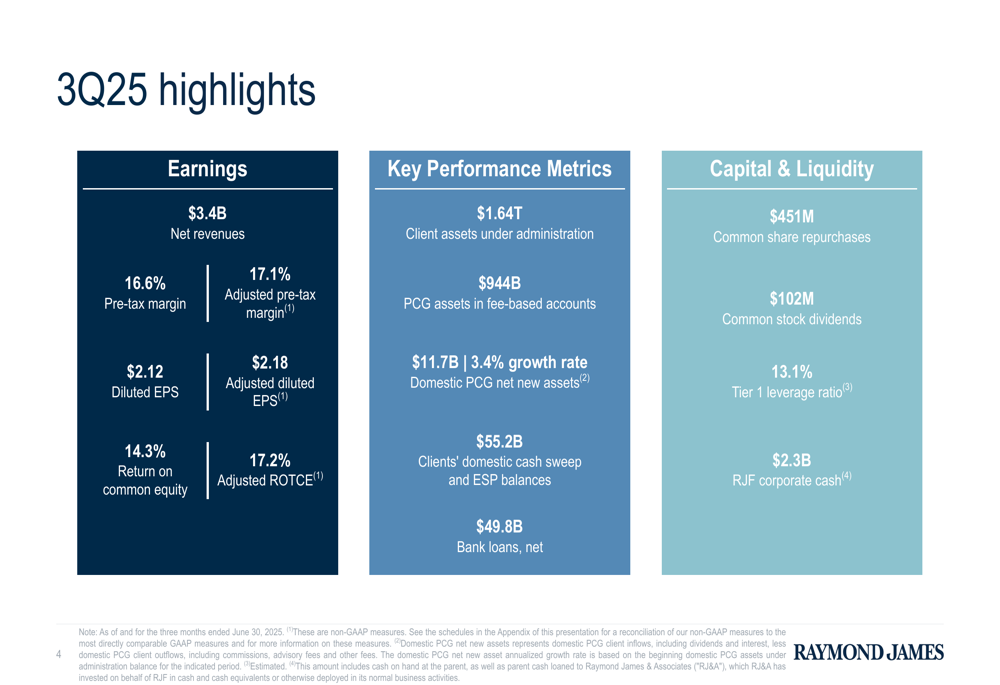
Raymond (NSE:RYMD) James reported net revenues of $3.4 billion for Q3 2025, representing a 5% increase compared to the same quarter last year. However, pre-tax income declined 13% year-over-year to $563 million, while diluted earnings per share fell 8% to $2.12.
The company’s client assets under administration reached $1.64 trillion, with $944 billion in fee-based accounts. Domestic Private Client Group net new assets totaled $11.7 billion, representing a 3.4% annualized growth rate.
As shown in the following quarterly highlights, Raymond James maintained strong capital and liquidity positions with a Tier 1 leverage ratio of 13.1% and corporate cash of $2.3 billion:
Detailed Financial Analysis
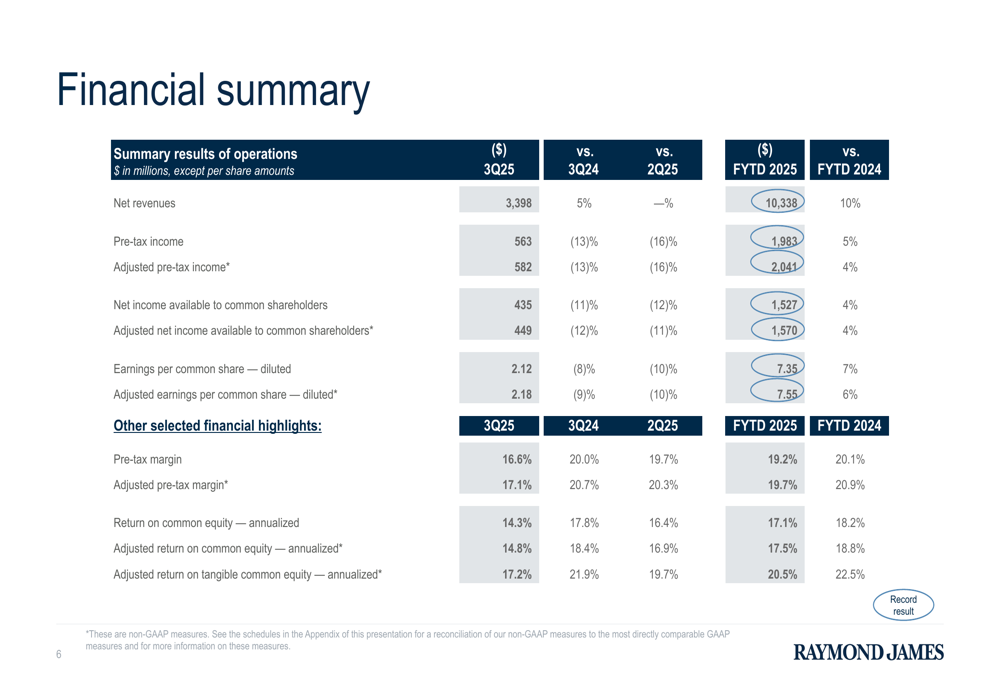
The financial summary reveals the extent of Raymond James’ profitability challenges despite revenue growth. While net revenues increased 5% year-over-year for the quarter and 10% for the fiscal year to date, pre-tax income declined 13% for the quarter. The company’s pre-tax margin contracted significantly to 16.6% from 20.0% in the same quarter last year.
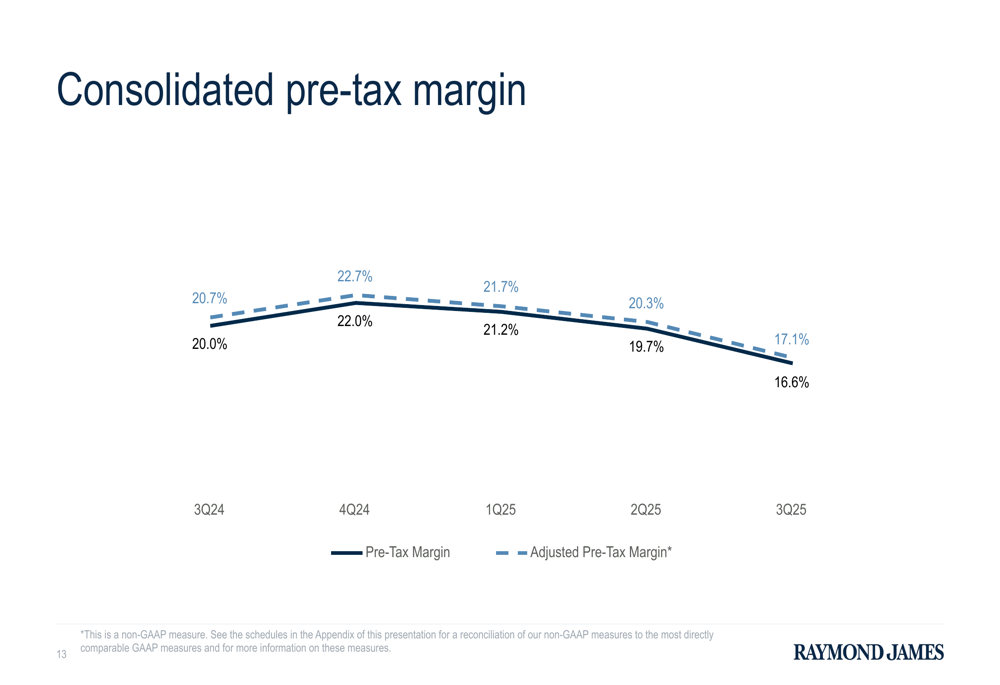
This margin compression is clearly illustrated in the following chart showing the downward trend in both reported and adjusted pre-tax margins over the past five quarters:
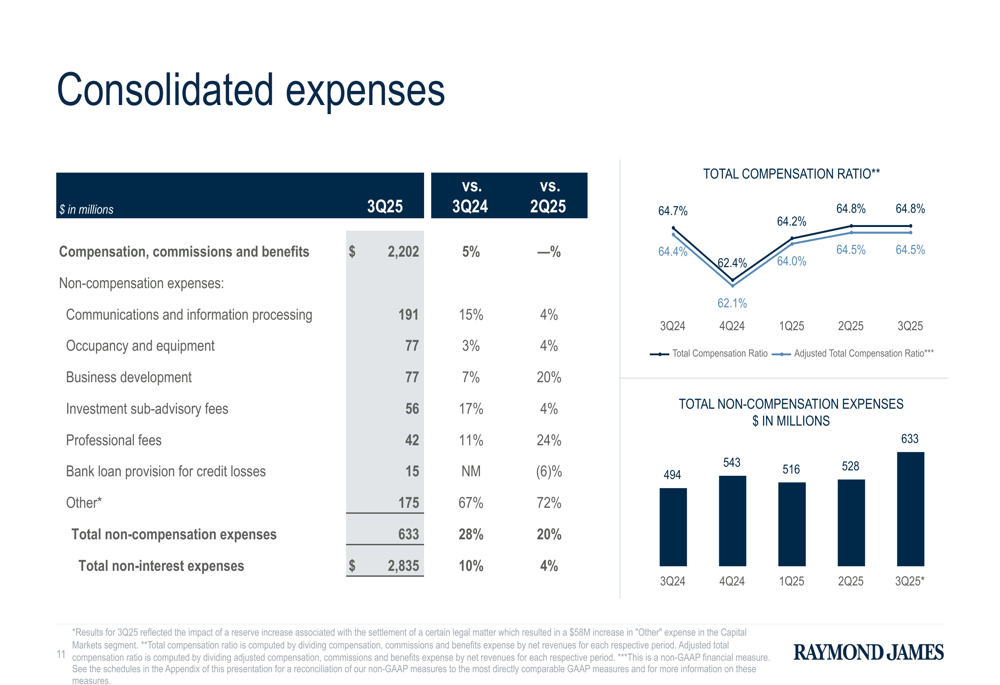
The primary driver of margin pressure appears to be expense growth, particularly in non-compensation expenses, which increased 28% year-over-year. Total (EPA:TTEF) non-interest expenses rose 10% to $2.8 billion, outpacing the 5% revenue growth.
Segment Performance
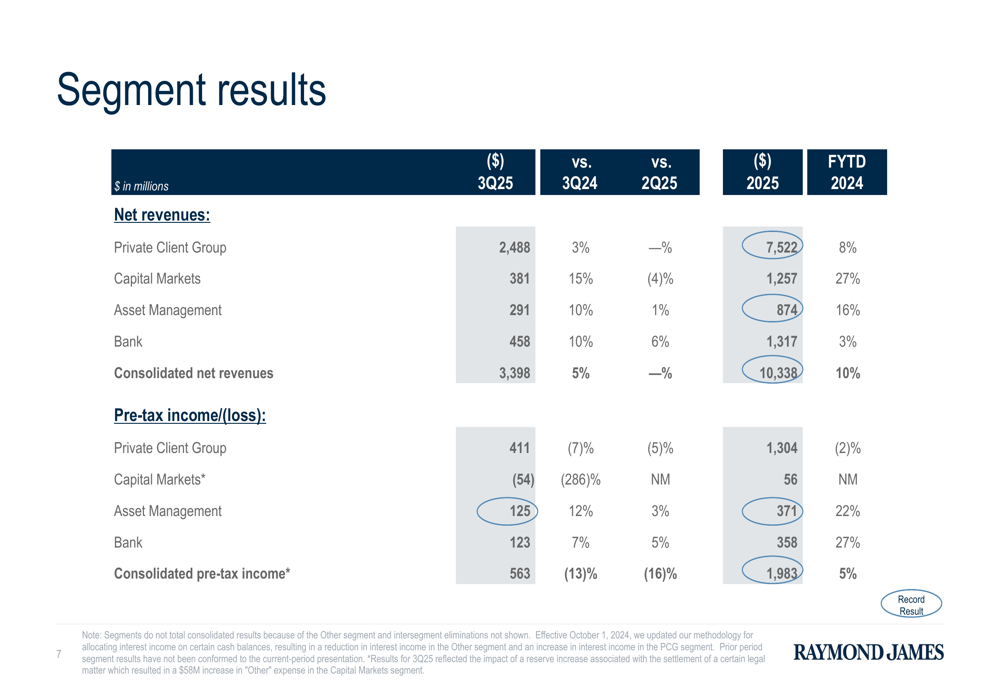
Raymond James’ business segments showed mixed results in the quarter. The Private Client Group, which represents the largest portion of the company’s business, saw net revenues increase 3% year-over-year to $2.5 billion, but pre-tax income declined 7% to $411 million.
The Capital Markets segment experienced significant challenges, reporting a pre-tax loss of $54 million compared to a profit in the same quarter last year, despite a 15% increase in revenues to $381 million.
The Asset Management and Bank segments performed better, with both showing growth in both revenues and pre-tax income. Asset Management revenues increased 10% to $291 million with pre-tax income up 12%, while Bank revenues rose 10% to $458 million with pre-tax income up 7%.
Revenue Drivers and Banking Performance
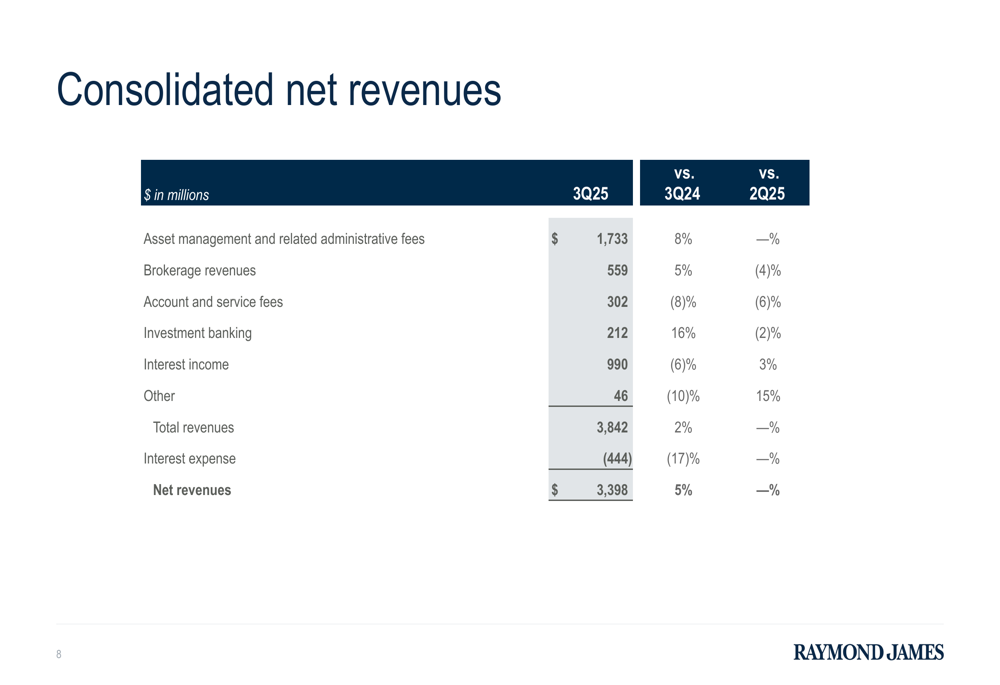
The company’s consolidated net revenues were primarily driven by asset management and related administrative fees, which increased 8% year-over-year to $1.7 billion. Brokerage revenues rose 5% to $559 million, while investment banking revenues increased 16% to $212 million.
Interest income declined 6% to $990 million, while interest expense increased 17% to $444 million, reflecting the challenging interest rate environment.
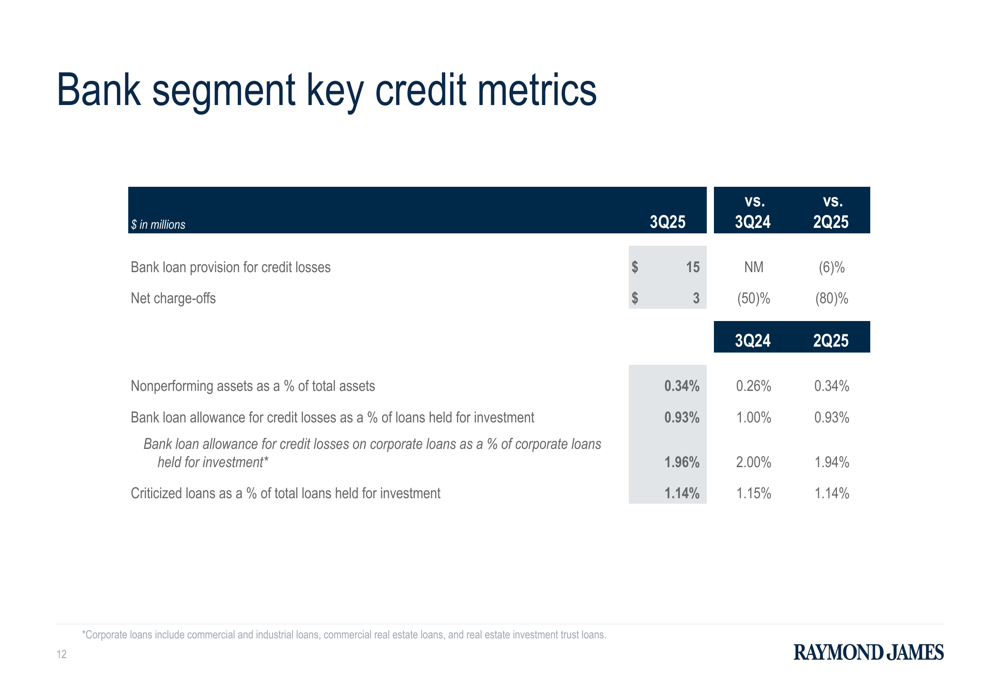
The bank segment maintained solid credit metrics with nonperforming assets at 0.34% of total assets and an allowance for credit losses at 0.93% of loans held for investment. The bank loan provision for credit losses was $15 million for the quarter.
Capital Management
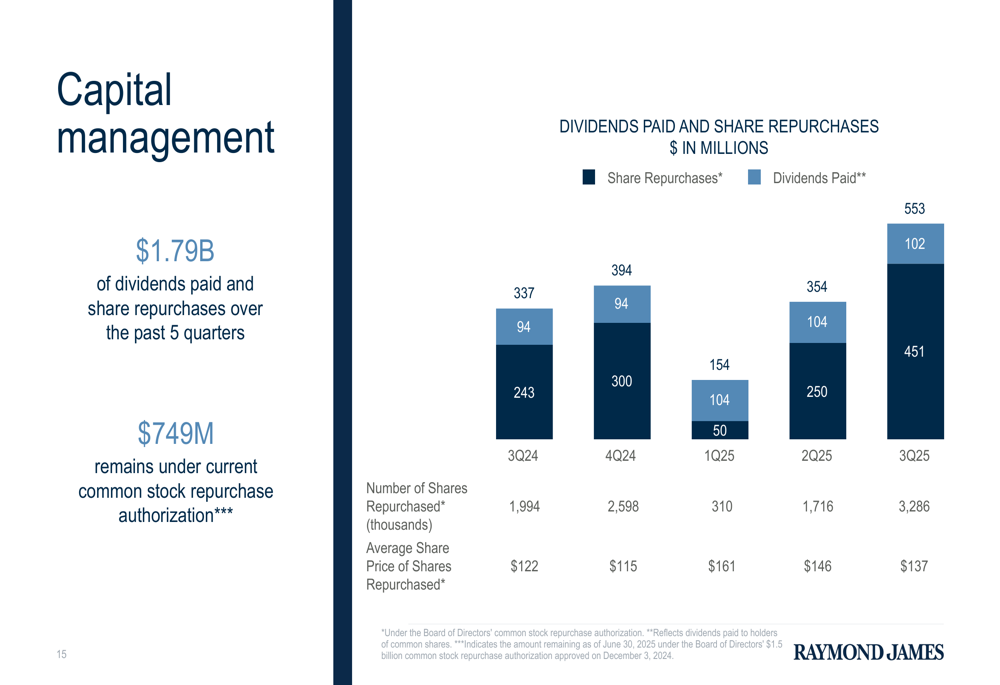
Despite the decline in profitability, Raymond James continued its aggressive capital return strategy, repurchasing $451 million of common shares during the quarter at an average price of $137 per share. This represents a significant increase from the $243 million repurchased in the same quarter last year.
The company also paid $102 million in common stock dividends during the quarter. In total, Raymond James has returned $1.79 billion to shareholders through dividends and share repurchases over the past five quarters, with $749 million remaining under the current repurchase authorization.
Market Context and Outlook
Raymond James’ stock closed at $160.61 on July 23, 2025, up 0.16% for the day. The stock has traded between $104.24 and $174.32 over the past 52 weeks.
The Q3 results show a continuation of the trend observed in Q2, where the company missed analyst expectations. The previous earnings report for Q2 2025 showed an EPS of $2.42, which fell short of the forecasted $2.50, suggesting a sequential decline in performance from Q2 to Q3 as EPS dropped to $2.12.
While Raymond James continues to grow its client assets and maintain a strong capital position, the significant margin compression and declining profitability may concern investors. The company’s aggressive share repurchase program could help support the stock price in the near term, but sustained profitability improvements will likely be necessary for long-term share price appreciation.
The company’s ability to manage expenses while continuing to grow revenues will be crucial for improving margins in future quarters. Investors will also be watching the performance of the Capital Markets segment, which showed a substantial loss this quarter despite revenue growth.
Full presentation:
This article was generated with the support of AI and reviewed by an editor. For more information see our T&C.