These are top 10 stocks traded on the Robinhood UK platform in July

Introduction & Market Context
Realty Income Corporation (NYSE:O), a leading global net lease real estate investment trust, presented its Q1 2025 results on May 5, revealing a mixed performance with revenue exceeding expectations despite an earnings per share miss. The company’s stock saw a slight decline of 0.16% in aftermarket trading, closing at $56.85, as investors digested the results.
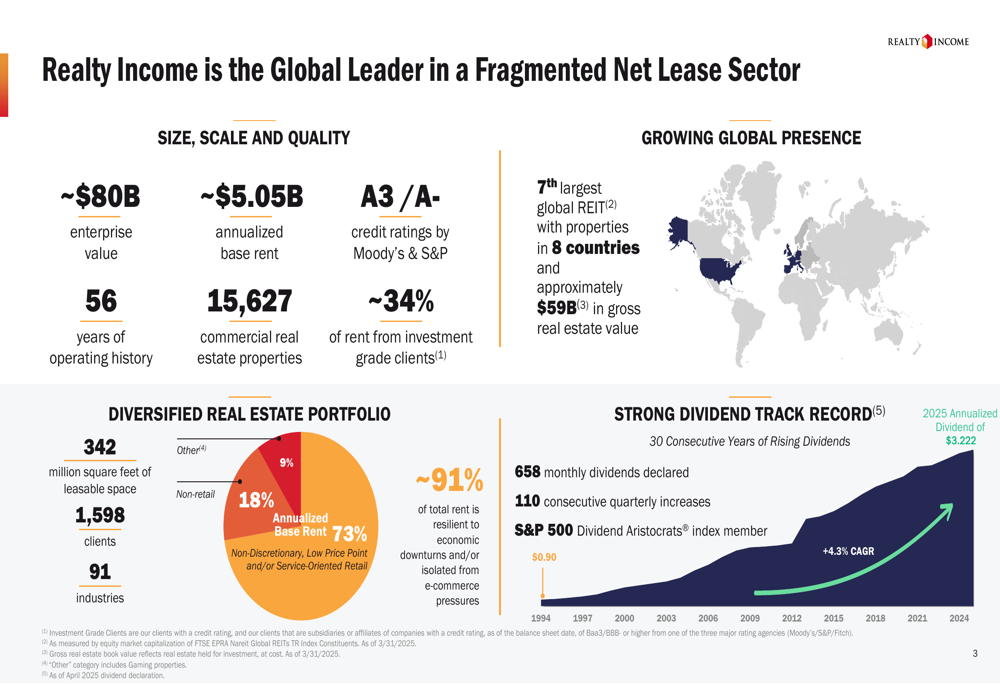
With a market capitalization of $50.9 billion, Realty Income continues to position itself as a global leader in the fragmented net lease sector, leveraging its scale and diversification to navigate varying interest rate environments. The company’s presentation emphasized its 56-year operating history and extensive portfolio of 15,627 commercial properties across eight countries.
As shown in the following comprehensive overview of the company’s scale and global positioning:
Quarterly Performance Highlights
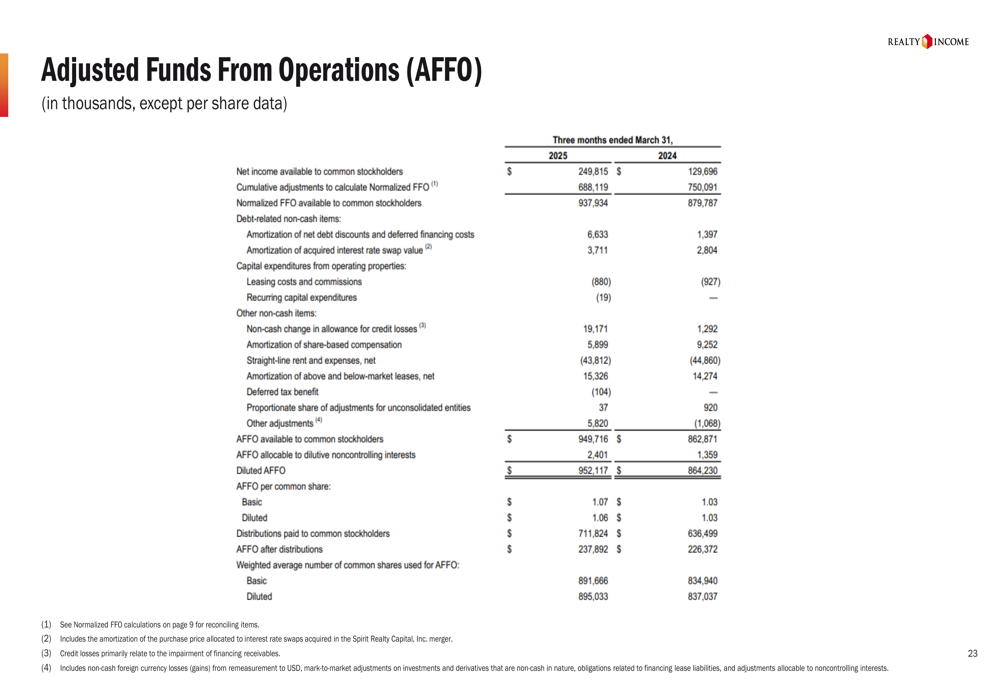
Realty Income reported Q1 2025 revenue of $1.38 billion, exceeding the forecast of $1.27 billion by $110 million. However, earnings per share came in at $0.28, missing the expected $0.35 by $0.07. The company instead emphasized its Adjusted Funds From Operations (AFFO) per share of $1.06, representing 2.9% growth compared to the same period last year.
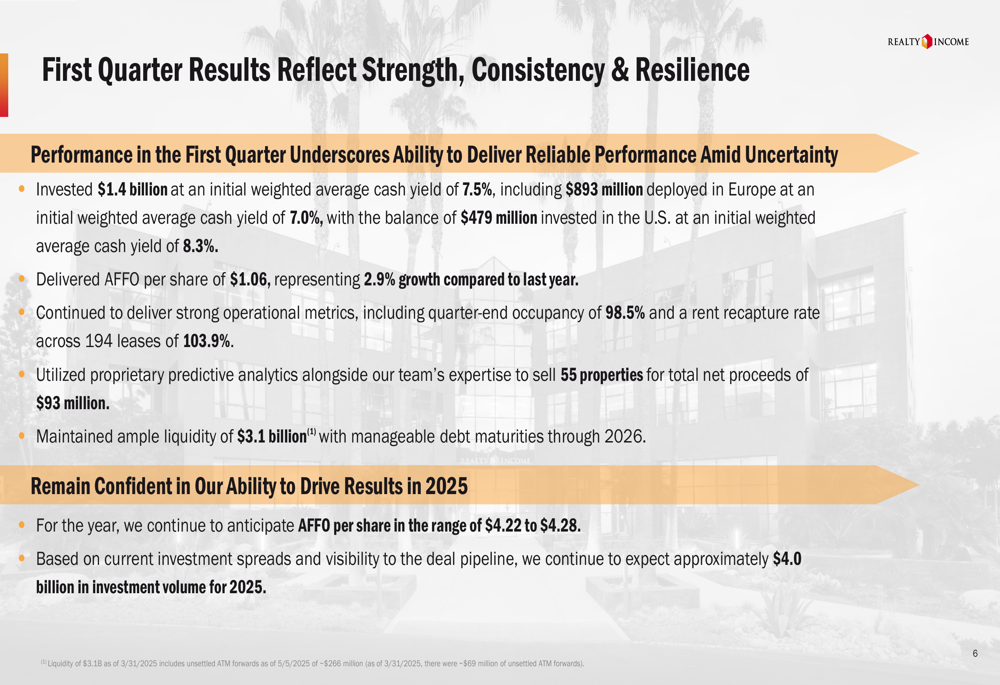
During the quarter, Realty Income invested $1.4 billion at an initial weighted average cash yield of 7.5%, with $893 million deployed in Europe at a 7.0% yield and $479 million in the U.S. at an 8.3% yield. The company maintained strong operational metrics with quarter-end occupancy of 98.5% and a rent recapture rate of 103.9% across 194 leases.
The following slide details the company’s first quarter performance:
Realty Income’s AFFO calculation provides a clearer picture of its operational performance, as shown in this detailed breakdown:
Portfolio Strategy & Diversification
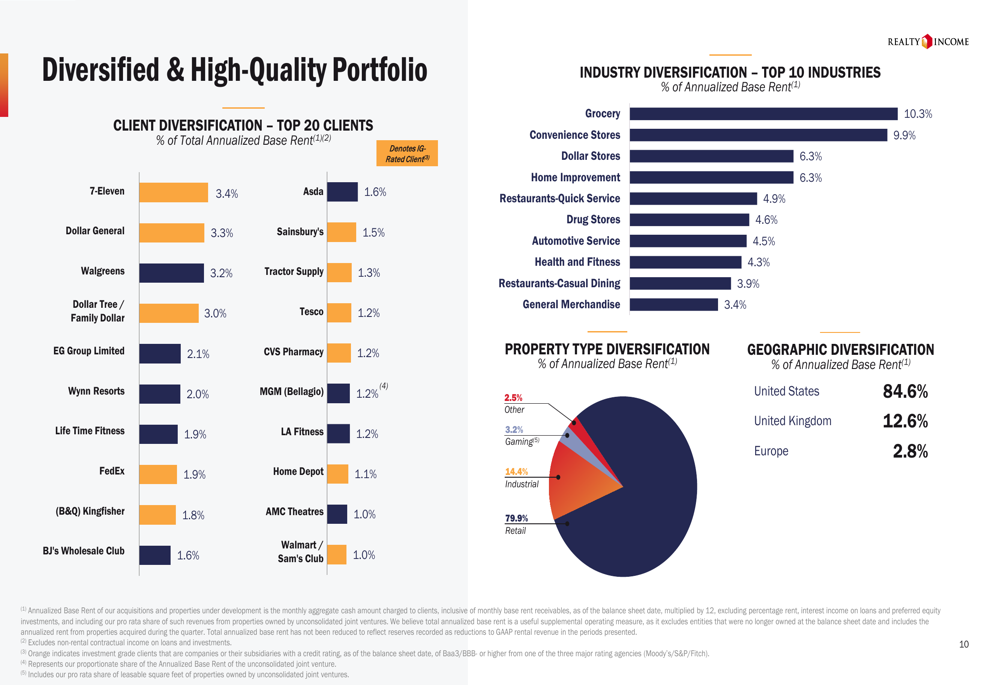
Realty Income continues to emphasize portfolio diversification as a key strength, with its properties spread across retail (79.9%), industrial (14.4%), gaming (3.2%), and other sectors (2.5%). Geographically, 84.6% of annualized base rent comes from the United States, 12.6% from the United Kingdom (TADAWUL:4280), and 2.8% from continental Europe.
The company’s portfolio is designed to be resilient to economic downturns, with 73% of properties in non-discretionary, low price point, and service-oriented retail categories that are less vulnerable to e-commerce disruption. Top industries include grocery (10.3%), convenience stores (9.9%), dollar stores (6.3%), and home improvement (6.3%).
This diversification strategy is illustrated in the following portfolio breakdown:
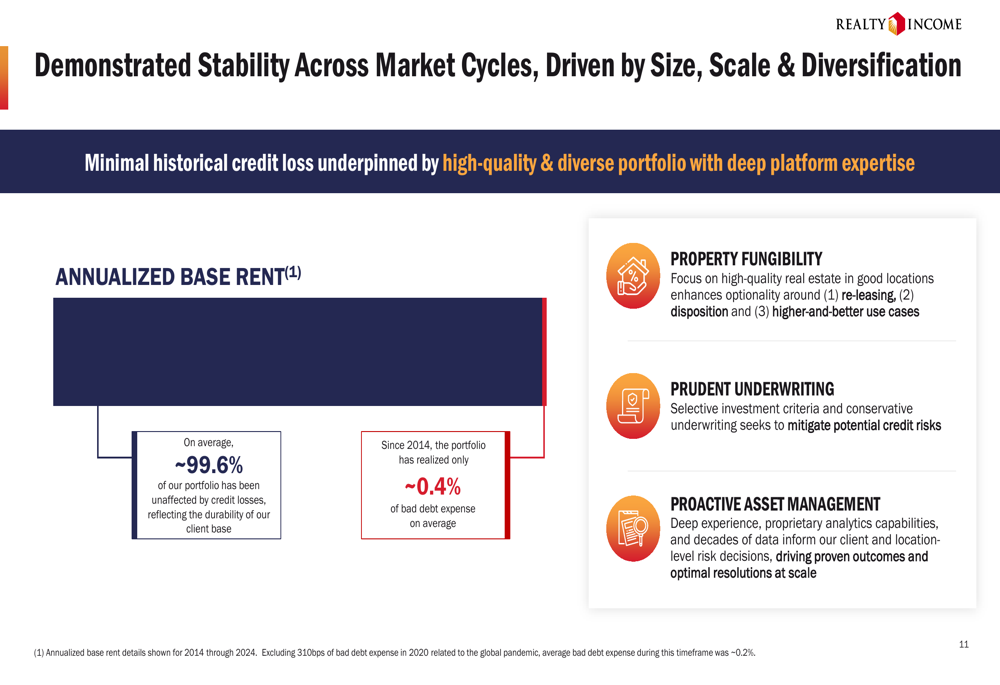
Realty Income has demonstrated remarkable stability across market cycles, with approximately 99.6% of its portfolio historically unaffected by credit losses. Since 2014, the company has realized only about 0.4% of bad debt expense on average, reflecting the durability of its client base and prudent underwriting standards.
The company’s historical stability is highlighted in this chart:
Financial Outlook & Guidance
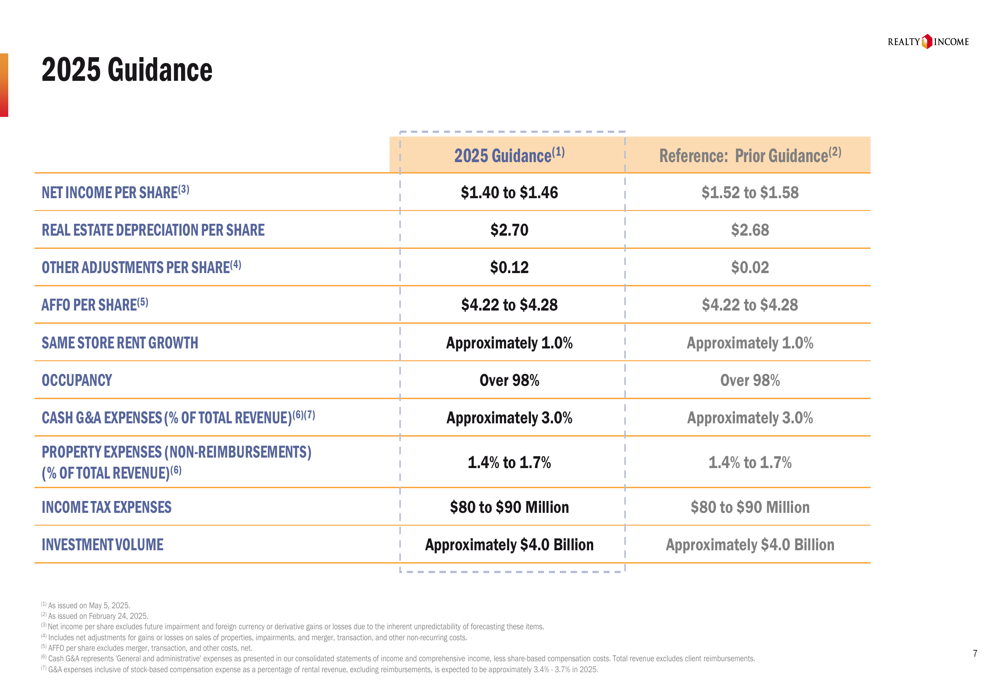
For 2025, Realty Income maintained its AFFO per share guidance in the range of $4.22 to $4.28, despite reducing its net income per share guidance from $1.52-$1.58 to $1.40-$1.46. The company continues to expect approximately $4.0 billion in investment volume for the year, with same-store rent growth of approximately 1.0% and occupancy over 98%.
The following slide compares current guidance with prior projections:
Realty Income has demonstrated stable growth across various interest rate environments, with average AFFO per share growth of 5.2% from 1996-2008 (when 10-year Treasury yields averaged 5.0%) and 5.4% from 2009-2022 (when yields averaged 2.3%). This historical performance supports management’s confidence in maintaining consistent returns despite changing economic conditions.
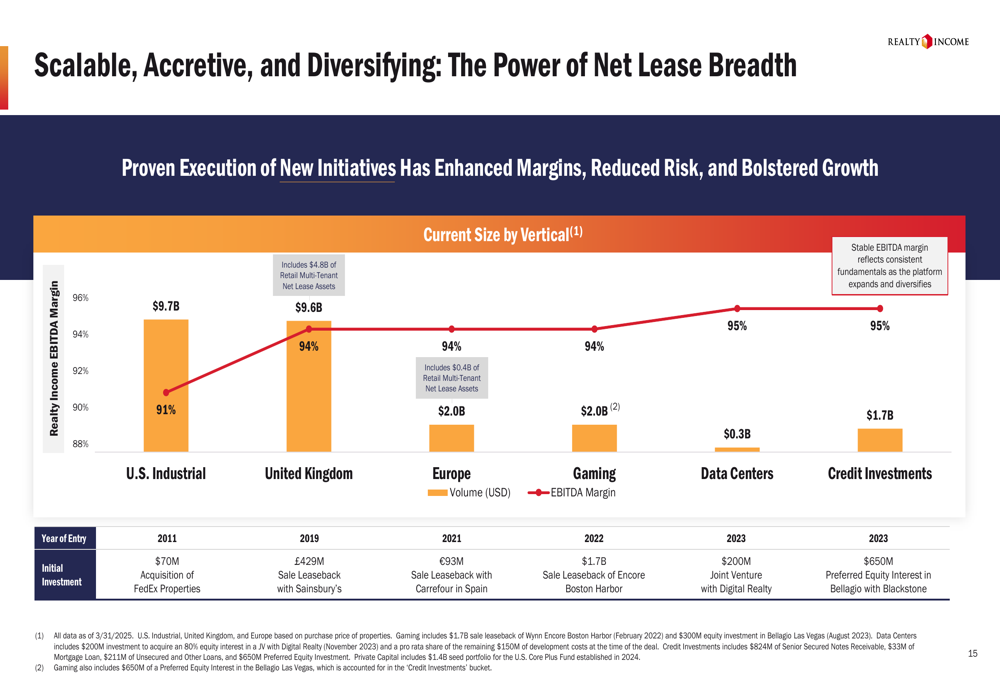
The company’s growth strategy now includes expanding into new verticals, with current investments in U.S. industrial ($9.7B), United Kingdom ($9.6B), Europe ($2.0B), gaming ($2.0B), data centers ($0.3B), and credit investments ($1.7B) as of March 31, 2025.
This strategic expansion across multiple verticals is illustrated in the following slide:
Balance Sheet & Liquidity Position
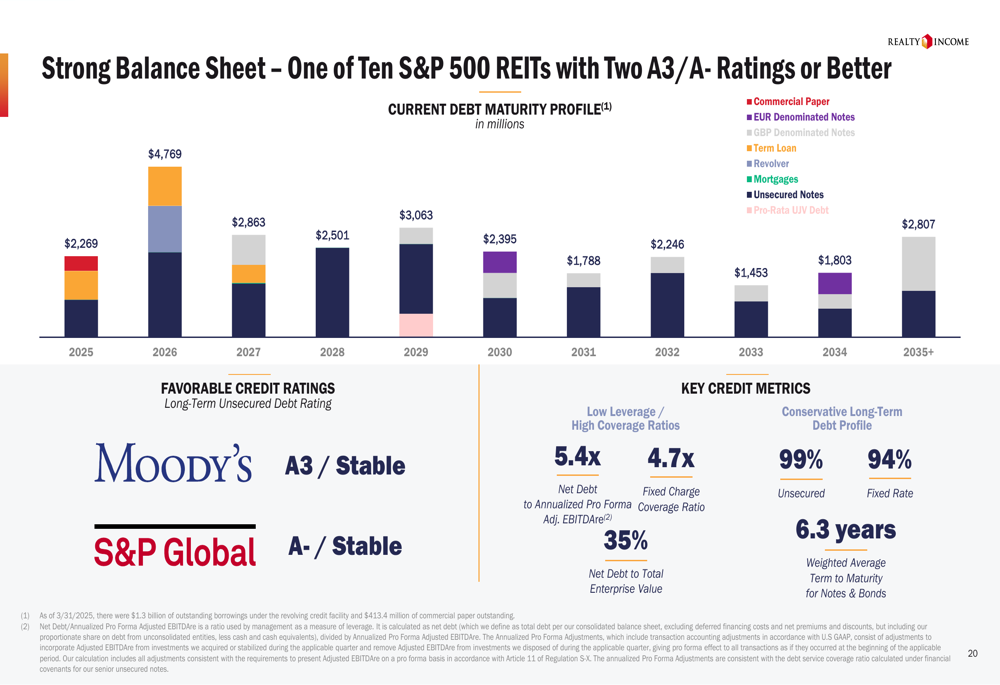
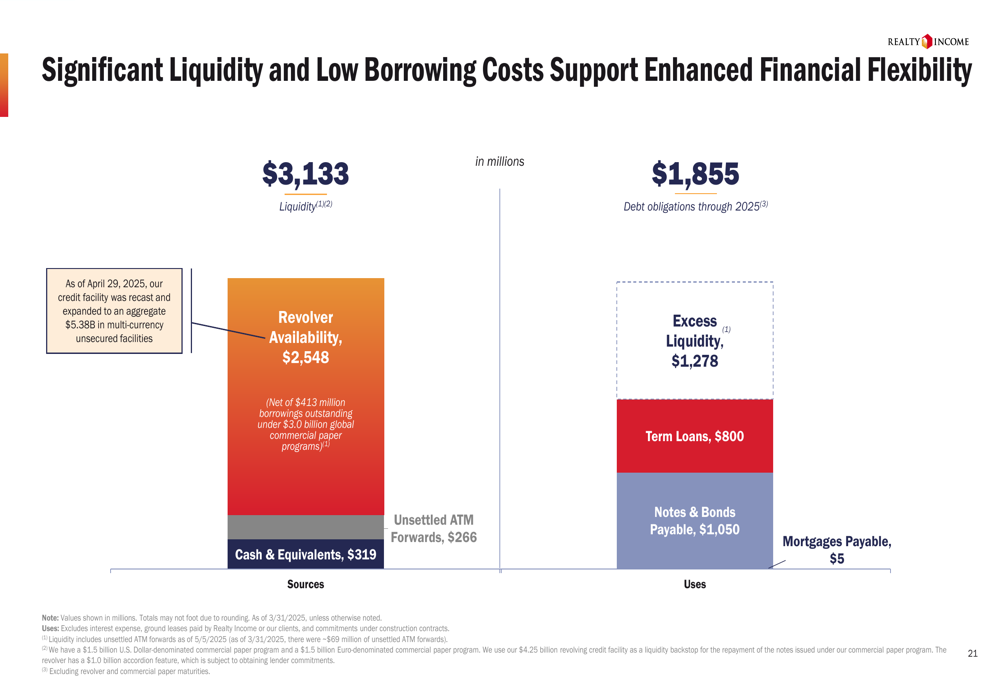
Realty Income maintains a strong balance sheet as one of only ten S&P 500 REITs with two A3/A- ratings or better from major credit agencies. The company reported ample liquidity of $3.1 billion with manageable debt maturities through 2026, providing financial flexibility for future investments.
The company’s debt maturity profile and credit metrics are detailed in this slide:
Realty Income’s liquidity position of $3.13 billion consists of $2.55 billion in revolver availability, $319 million in cash and equivalents, and $266 million in unsettled ATM forwards. This liquidity significantly exceeds the company’s debt obligations through 2025 of $1.86 billion, providing a comfortable cushion for operations and investments.
The following chart illustrates the company’s strong liquidity position:
CEO Sumit Roy emphasized the company’s resilience during the earnings call, stating, "Our ability to deliver reliable performance through varying market conditions remains a hallmark of our platform." He expressed confidence in Realty Income’s return profile and the complementary role of private capital in the company’s strategy.
Despite the EPS miss, Realty Income’s Q1 2025 presentation highlights the company’s continued focus on global expansion, portfolio diversification, and maintaining its 30-year track record of dividend growth. With a current dividend yield of 5.66% and a conservative balance sheet, Realty Income remains positioned to navigate the evolving real estate landscape while delivering consistent returns to shareholders.
Full presentation:
This article was generated with the support of AI and reviewed by an editor. For more information see our T&C.