Fubotv earnings beat by $0.10, revenue topped estimates

Introduction & Market Context
Realty Income Corporation (NYSE:O) released its second quarter 2025 investor presentation on August 6, highlighting the company’s continued expansion and strategic initiatives. The real estate investment trust, which specializes in single-tenant commercial properties, reported stable performance while increasing its investment volume guidance for the year and introducing a new private fund initiative.
With an enterprise value of approximately $81 billion and a portfolio of 15,606 commercial real estate properties across nine countries, Realty Income maintains its position as the sixth largest global REIT. The company’s presentation emphasized its resilience through varying market conditions, supported by A3/A- credit ratings from Moody’s and S&P.
Quarterly Performance Highlights
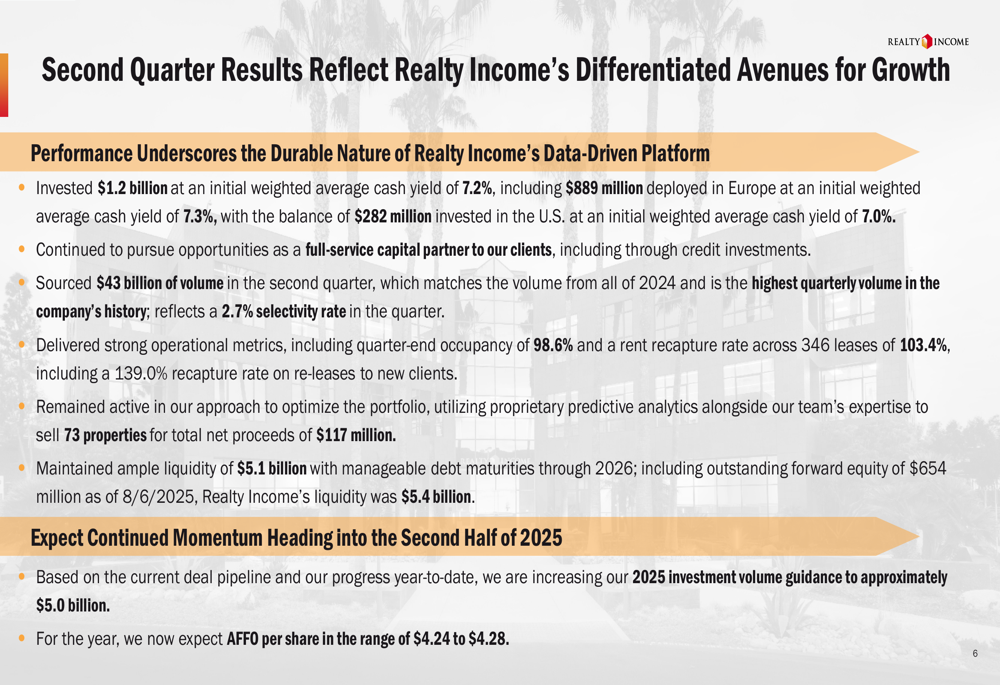
In the second quarter of 2025, Realty Income invested $1.2 billion at an initial weighted average cash yield of 7.2%. This investment was strategically allocated with $889 million deployed in Europe at a 7.3% yield and $282 million in the U.S. at a 7.0% yield, demonstrating the company’s continued focus on international expansion.
The company maintained strong operational metrics with a 98.6% occupancy rate and a 103.4% rent recapture rate across 346 leases. Additionally, Realty Income sold 73 properties for $117 million in net proceeds as part of its portfolio optimization strategy.
As shown in the following chart of second quarter results:
Updated 2025 Guidance
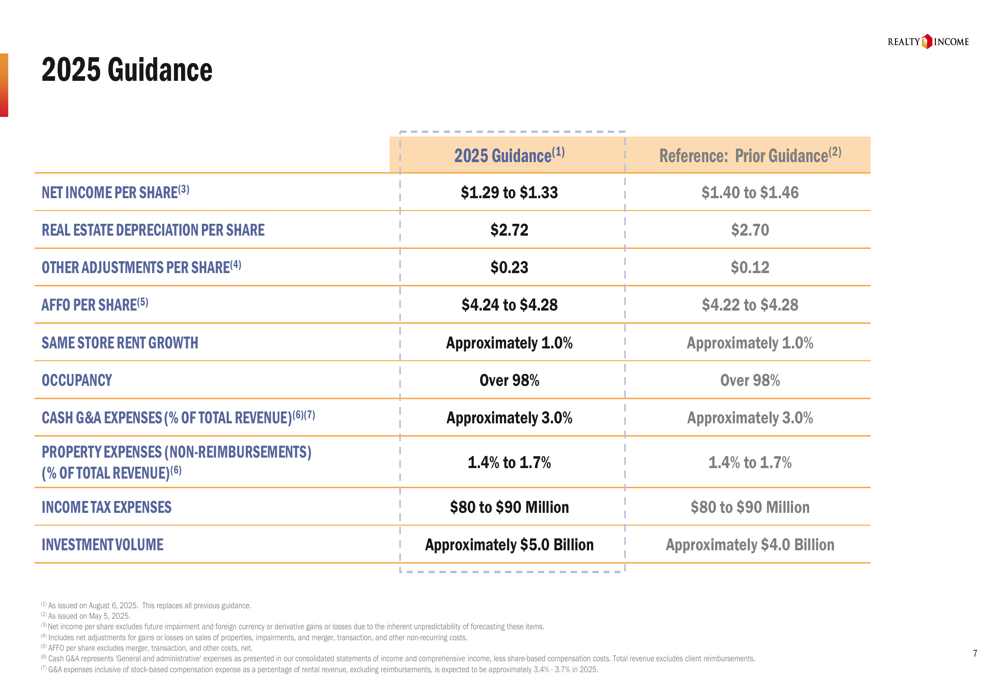
Realty Income has increased its 2025 investment volume guidance to approximately $5.0 billion, up from the previous guidance of $4.0 billion announced during Q1 earnings. Despite this increase in investment activity, the company narrowed its AFFO per share guidance to $4.24-$4.28, maintaining the upper end of its previous range of $4.22-$4.28.
However, the company reduced its Net Income per Share guidance to $1.29-$1.33, down from the previous $1.40-$1.46, while maintaining its same-store rent growth projection of approximately 1.0% and occupancy forecast of over 98%.
The full guidance update is illustrated in this comprehensive table:
Strategic Initiatives
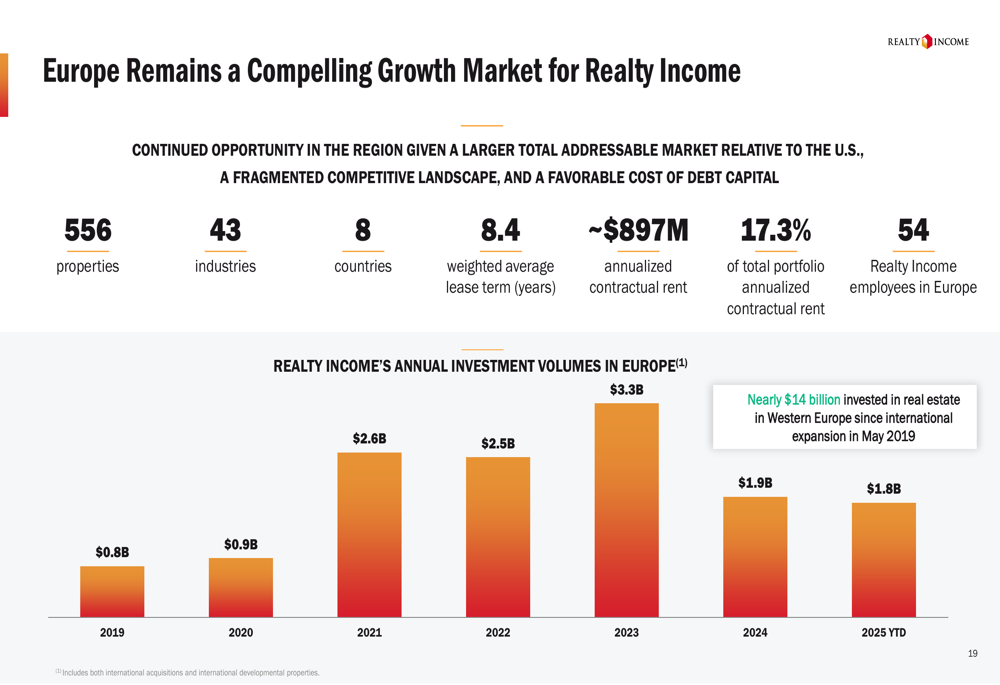
A significant focus of the presentation was Realty Income’s expansion in Europe, which now represents 17.3% of the company’s portfolio. Since beginning its international expansion in May 2019, Realty Income has invested nearly $14 billion in Western European real estate, with $1.8 billion invested in 2025 year-to-date. The European portfolio now spans 8 countries with 556 properties across 43 industries, generating approximately $897 million in annualized contractual rent.
As shown in the following chart of European investment growth:
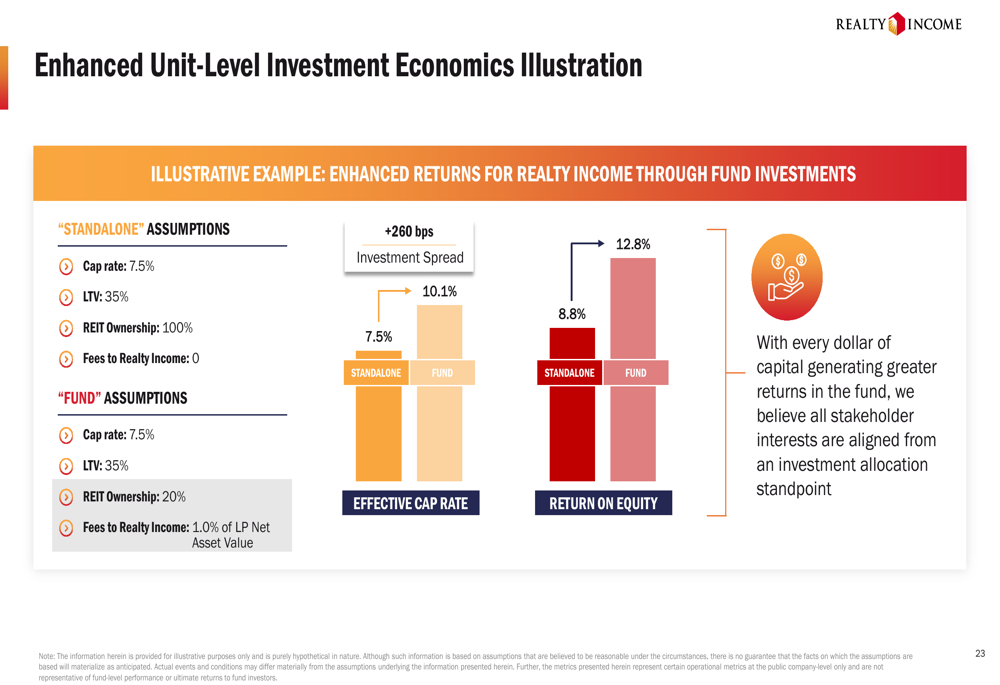
The company also announced a new private fund initiative, which represents a natural evolution of its business model. This fund will leverage Realty Income’s core strengths in sourcing and underwriting while providing an additional source of equity capital. Management highlighted that the private real estate market is approximately 10 times larger than the public market, presenting significant growth opportunities.
The private fund is designed to generate high-multiple, recurring fee revenue to support sustained earnings growth while widening the company’s investment aperture. The fund will operate as an infinite life, open-ended vehicle focused on net lease properties in the U.S., with Realty Income maintaining a meaningful co-investment.
The economic benefits of this structure are illustrated in this comparison:
Portfolio Diversification and Stability
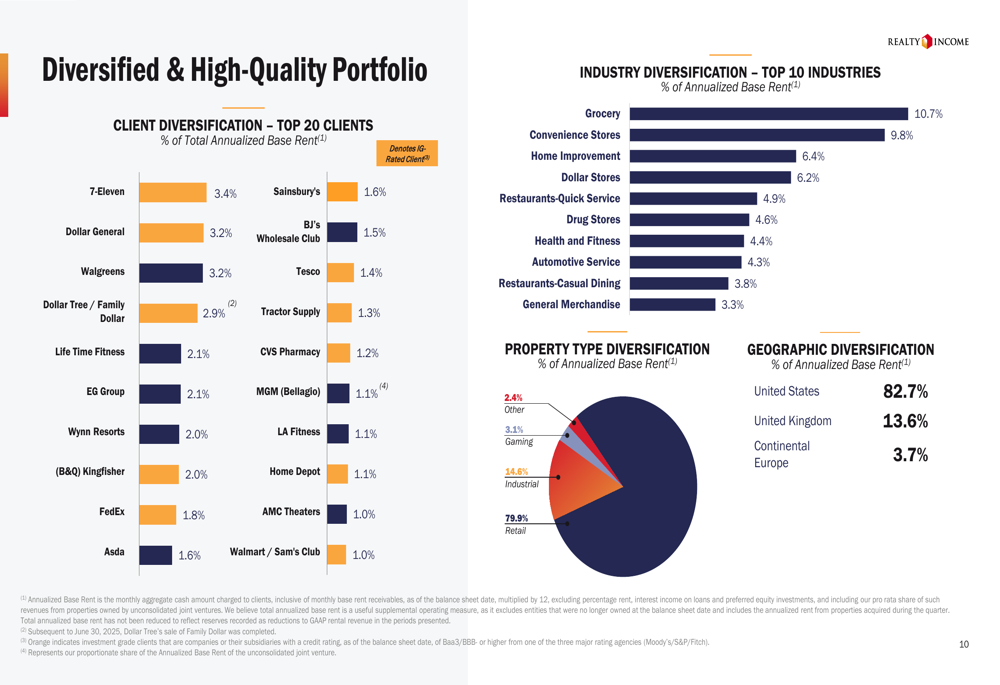
Realty Income’s portfolio remains well-diversified across clients, industries, and geographies. The top 20 clients represent 35.5% of annualized base rent, with 7-Eleven (3.4%), Dollar General (NYSE:DG) (3.2%), and Walgreens (3.2%) as the largest tenants. By industry, grocery (10.7%), convenience stores (9.8%), and home improvement (6.4%) lead the portfolio composition.
The company’s property type diversification shows retail at 79.9%, industrial at 14.6%, gaming at 3.1%, and other property types at 2.4%. Geographically, 82.7% of the portfolio is located in the United States, with 13.6% in the United Kingdom (TADAWUL:4280) and 3.7% in Continental Europe.
This diversification strategy is visualized in the following chart:
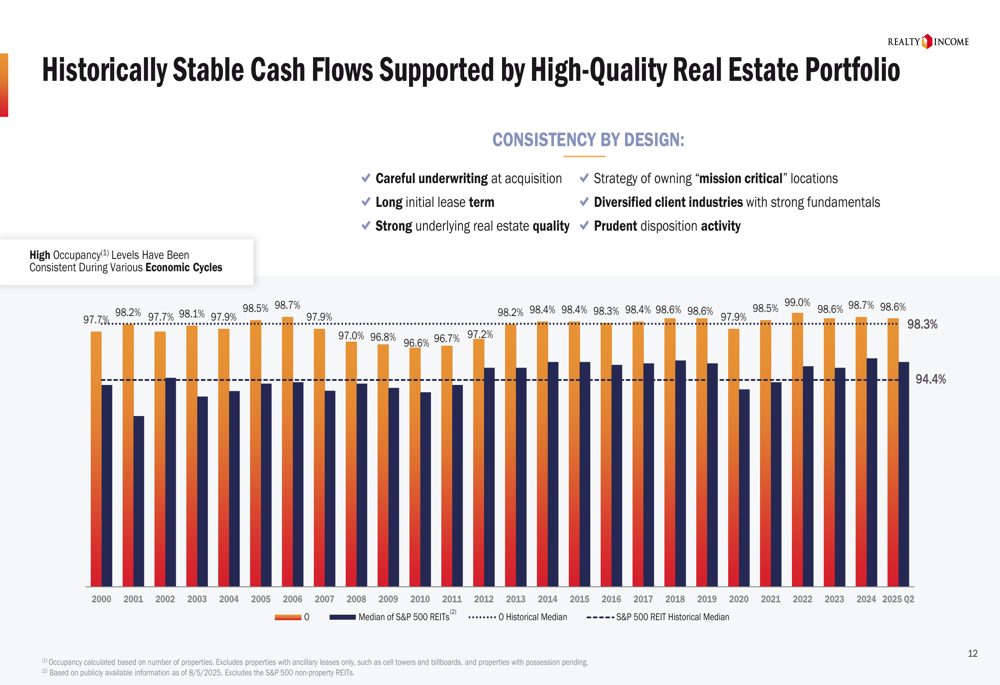
The presentation emphasized that approximately 73% of annualized base rent comes from non-discretionary, low price point, and/or service-oriented retail, with approximately 90% of total rent resilient to economic downturns and/or isolated from e-commerce pressures. This focus has contributed to the company’s historically stable cash flows and high occupancy rates.
The historical stability is demonstrated in this occupancy chart:
Financial Position
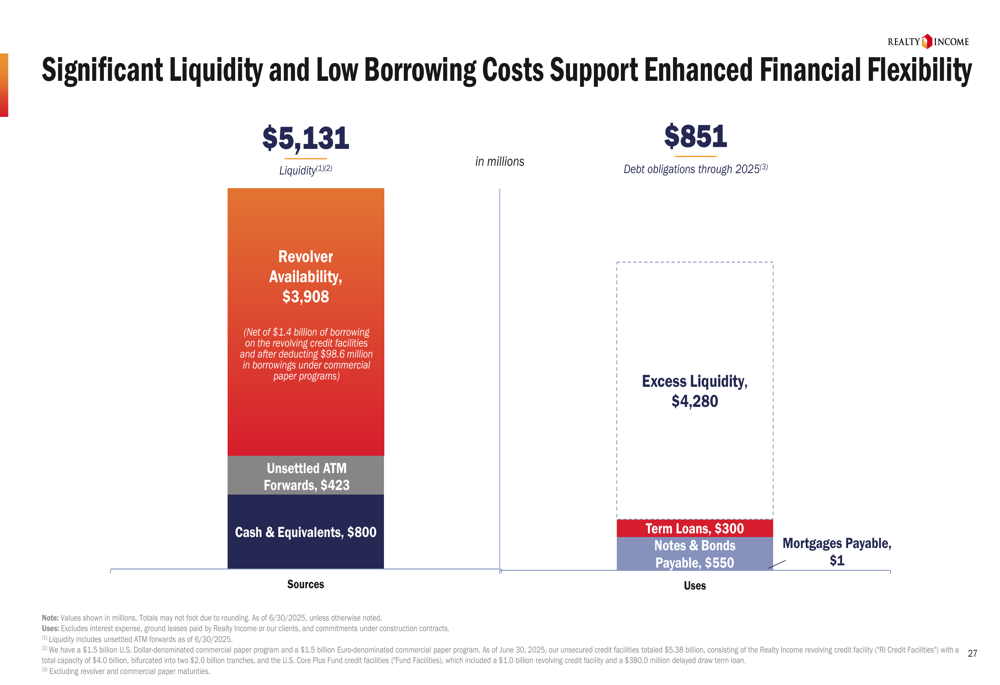
Realty Income maintains a strong balance sheet with $5.1 billion in liquidity as of Q2 2025, consisting of $3.9 billion in revolver availability, $423 million in unsettled ATM forwards, and $800 million in cash and equivalents. This liquidity significantly exceeds the company’s $851 million in debt obligations through the end of 2025.
The company’s debt profile remains conservative with 99.9% unsecured debt and 95.0% fixed-rate debt, with a weighted average term to maturity of 6.4 years for notes and bonds. Leverage metrics include a 5.5x Net Debt to Annualized Pro Forma Adjusted EBITDAre ratio and a 4.5x Fixed Charge Coverage Ratio.
The following chart illustrates the company’s liquidity position:
Dividend Performance and Total (EPA:TTEF) Returns
As an S&P 500 Dividend Aristocrats® Index member, Realty Income continues its track record of dividend growth with a 2025 annualized dividend of $3.228, representing a 4.2% compound annual growth rate since its 1994 NYSE listing. The company has delivered a 13.5% compound annual total return since 1994, with a 0.5 beta relative to the S&P 500, indicating lower volatility than the broader market.
The presentation highlighted that Realty Income has averaged approximately 5% AFFO per share growth and approximately 11% total operational return since 1994, maintaining consistent performance through varying interest rate environments.
Forward Outlook
Looking ahead, Realty Income remains focused on capitalizing on its substantial pipeline of acquisition opportunities. The company sourced $43 billion in potential investments in Q2 2025 alone, matching the entire volume sourced in 2024, with a selective approach resulting in a 2.7% acquisition rate.
The increased investment volume guidance for 2025 suggests management’s confidence in executing its growth strategy despite the reduced Net Income per Share guidance. The new private fund initiative represents a strategic evolution that could provide additional growth avenues and recurring fee income.
Following the release of the Q2 presentation, Realty Income’s stock closed at $57.20 on August 6, 2025, down 0.37% for the day, with a slight increase of 0.09% in aftermarket trading. The stock remains within its 52-week range of $50.71 to $64.88, reflecting moderate investor confidence in the company’s strategy and performance.
Full presentation:
This article was generated with the support of AI and reviewed by an editor. For more information see our T&C.