Goldman Sachs chief credit strategist Lotfi Karoui departs after 18 years - Bloomberg

Introduction & Market Context
Reinsurance Group of America (NYSE:RGA) released its second quarter 2025 earnings presentation on July 31, revealing adjusted operating earnings per share of $4.72, a decline from $5.66 in the first quarter. Despite the earnings drop, the company reported robust traditional premium growth of 11.0% year-to-date on a constant currency basis. RGA’s stock closed at $190.51, up 1.02% on the day of the announcement.
The Q2 results come after a stronger first quarter when RGA beat analyst expectations with EPS of $5.66 against a forecast of $5.44. The sequential decline in earnings highlights some challenges in the company’s U.S. Traditional segment, though the company maintained its strong capital position and investment performance.
Quarterly Performance Highlights
RGA’s second quarter adjusted operating income was $4.72 per diluted share, excluding notable items, contributing to a trailing twelve-month adjusted operating ROE of 14.3%. This remains within the company’s target range of 13-15%, though it represents a decline from 15.0% in the previous quarter.
As shown in the following chart of adjusted operating EPS and ROE trends:
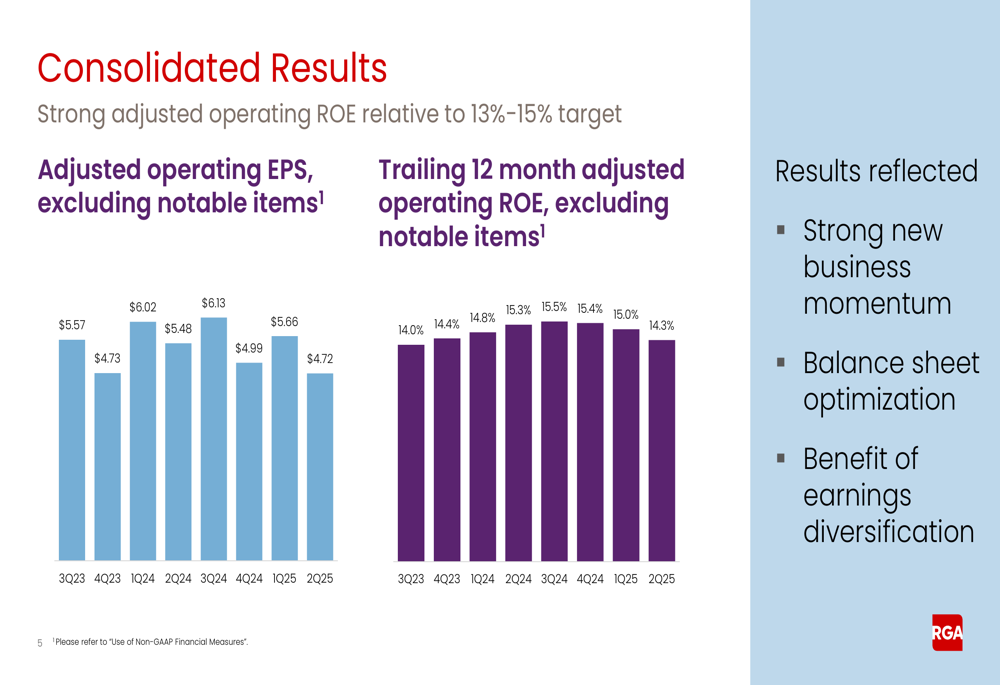
The company faced unfavorable claims experience in its U.S. Traditional segment, primarily driven by challenges in U.S. Individual Life and healthcare excess lines in U.S. Group. This negative experience was partially offset by favorable investment performance, including strong variable investment income, with a non-spread new money rate of 6.53%.
A key development during the quarter was the closing of a strategic transaction with subsidiaries of Equitable Holdings, Inc. (NYSE:EQH), though the financial impacts of this deal will not be reflected until Q3 results. Additionally, RGA deployed $276 million of capital during the quarter into in-force block transactions.
Segment Performance
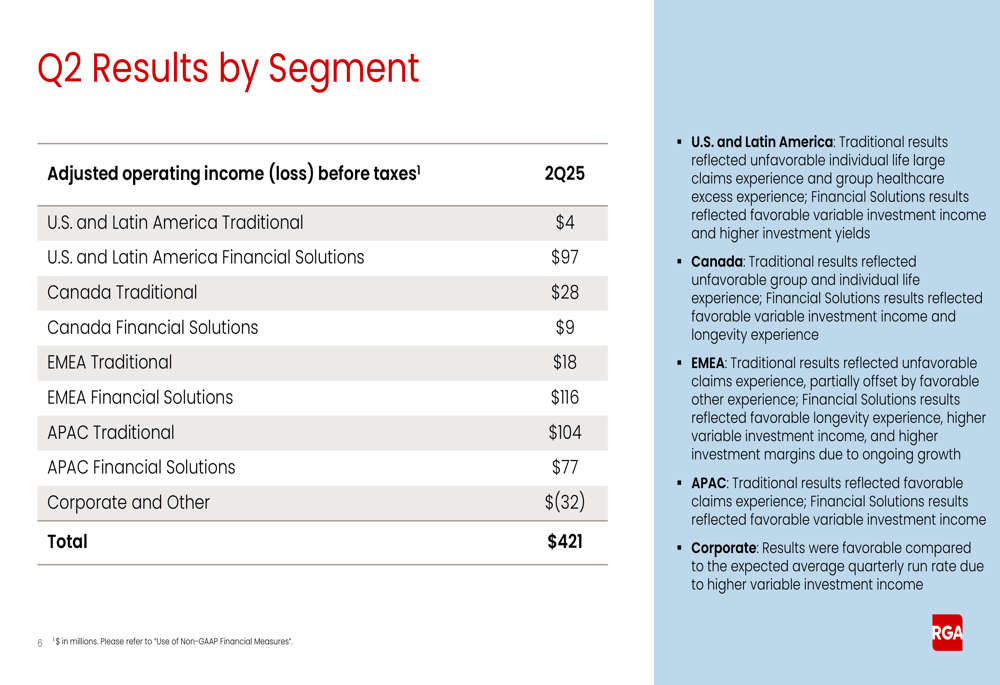
RGA’s Q2 results varied significantly across business segments, with the U.S. and Latin America Traditional segment showing particular weakness with just $4 million in adjusted operating income before taxes. In contrast, the EMEA Financial Solutions segment was the strongest performer with $116 million, followed by APAC Traditional at $104 million.
The following table breaks down the performance by segment:
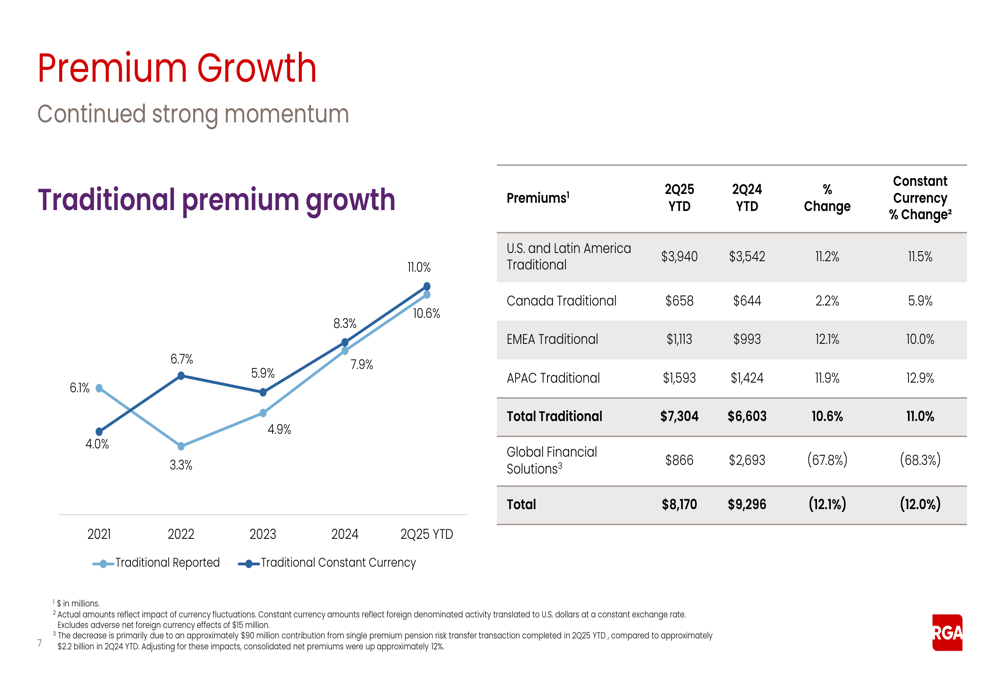
The company’s traditional premium growth remained strong across all regions, with U.S. and Latin America Traditional showing the highest growth at 11.5% on a constant currency basis. APAC Traditional followed closely with 12.9% growth, while EMEA Traditional grew by 10.0% and Canada Traditional by 5.9%.
The following chart illustrates the consistent growth in traditional premiums:
Investment Portfolio and Performance
RGA’s investment portfolio remains well-positioned with approximately $115 billion in assets under management. The company maintains a high-quality portfolio with over 94% of fixed maturity securities rated investment grade. The asset allocation is diversified, with 70% in investment-grade bonds, 8.7% in mortgage loans on real estate, and 6.2% in funds withheld at interest.
The following chart shows the breakdown of RGA’s investment portfolio:

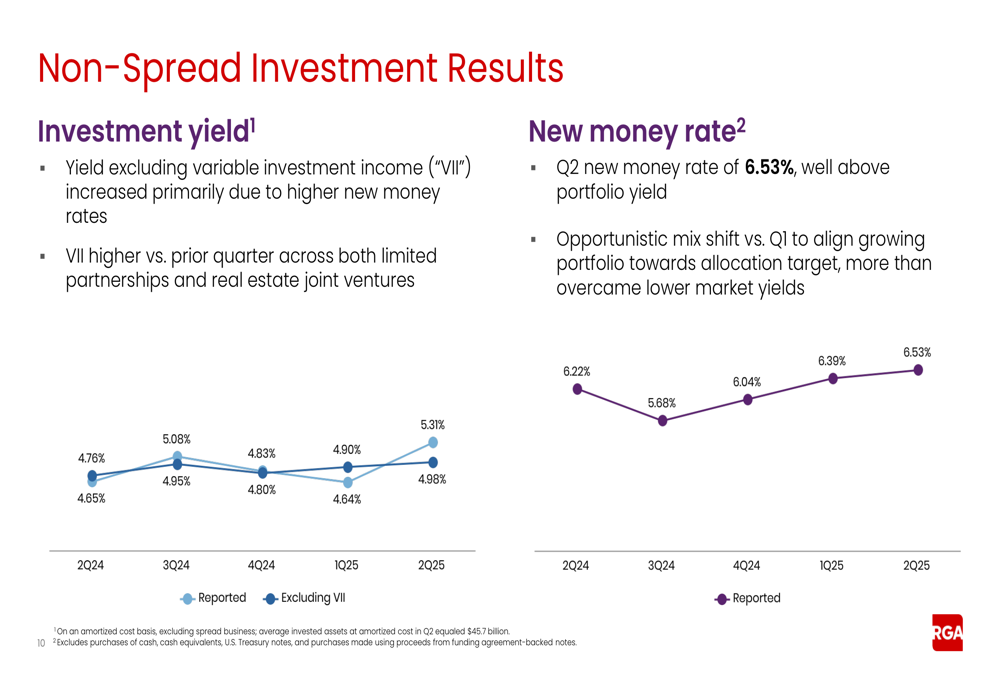
Investment performance was a bright spot in the quarter, with the non-spread investment yield increasing to 4.84% from 4.64% in Q1 2025. Excluding variable investment income, the yield rose to 5.31% from 4.92%. The new money rate also improved to 6.53% from 6.39% in the previous quarter.
As illustrated in the following chart of investment yields and new money rates:
Variable investment income continues to be supported by a diversified alternative equity strategy, with 56% in private equity, 36% in real estate joint ventures, and 8% in other investments. The company maintains a long-term annual return assumption of 10-12% for these investments, though 2025 targets are based on expected returns of approximately 6%.
Capital Position and Deployment
RGA significantly strengthened its capital position during the quarter, with estimated excess capital increasing from $1.9 billion in Q1 to $3.8 billion in Q2, largely due to the recognition of additional credit for a portion of the value of in-force business. After accounting for the $1.5 billion EQH transaction, pro forma excess capital stands at $2.3 billion, with total estimated deployable capital of $3.4 billion.
The following table details the calculation of RGA’s excess and deployable capital:
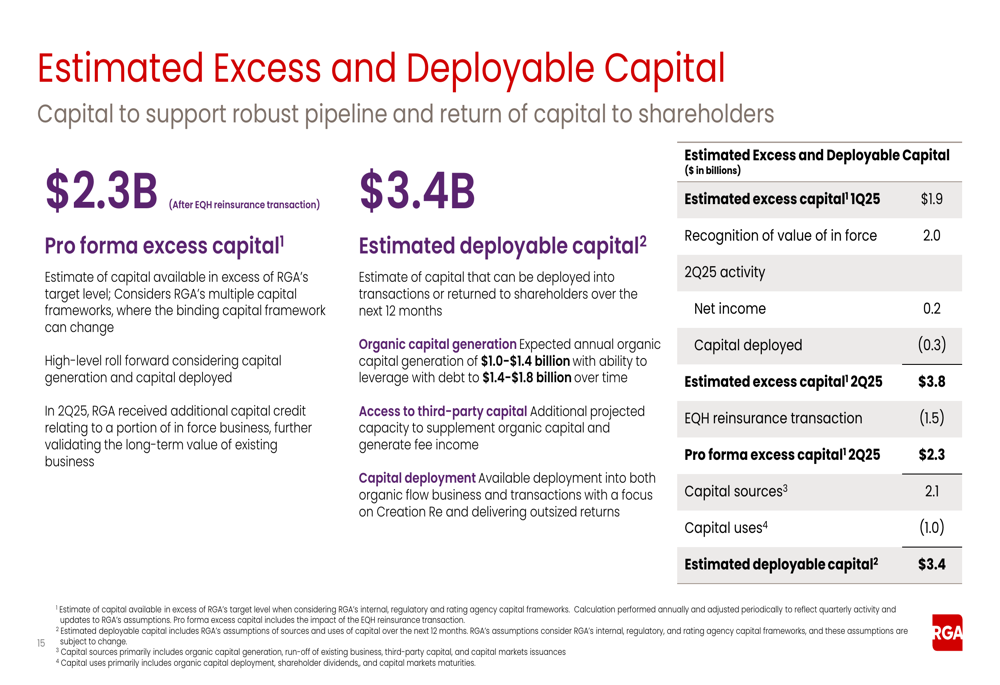
The company’s equity excluding AOCI increased to $16.1 billion in Q2 2025 from $15.1 billion at year-end 2024. Cash and cash equivalents rose significantly to $5.4 billion from $3.3 billion, partly due to timing of portfolio repositioning.
RGA has continued its capital deployment strategy across all geographic regions, with a focus on in-force and other transactions. The company also increased its quarterly dividend to $0.93 per share, reflecting confidence in its financial position and commitment to returning capital to shareholders.
Forward-Looking Statements
Looking ahead, RGA emphasized its strong position to support future growth and capital returns through dividends and share repurchases. The company highlighted its robust new business pipeline across key geographies and the benefits of earnings diversification by product and geography.
RGA’s book value per share (excluding AOCI) has grown at a 10% CAGR from 2007 to 2022, demonstrating the company’s long-term value creation. The company aims to continue this trajectory with its target of 9.7% CAGR.
As shown in the following chart of book value per share growth:
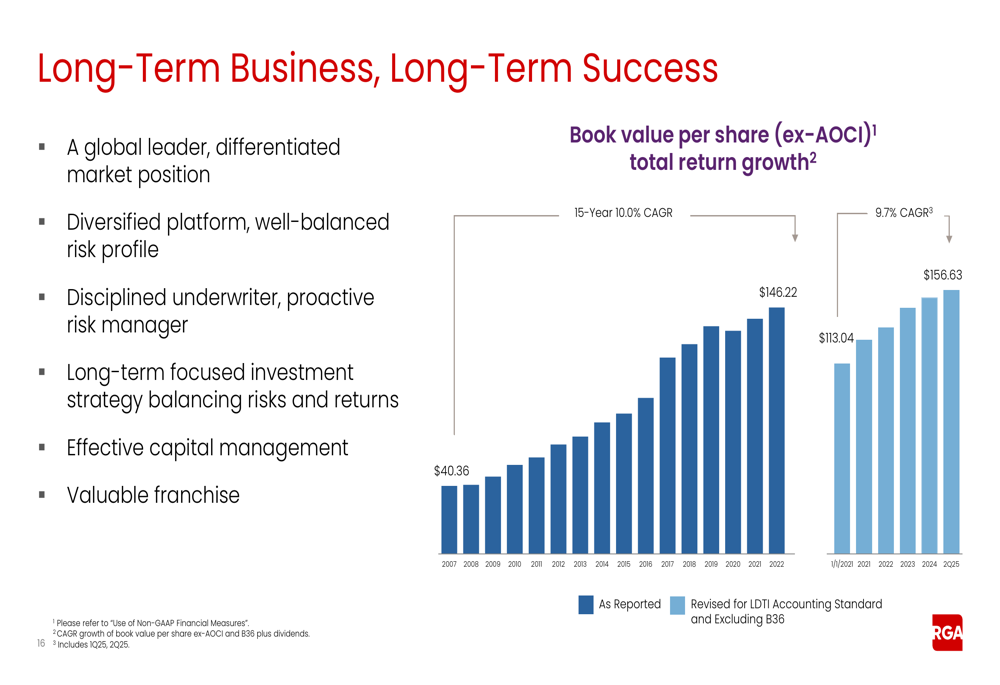
Management emphasized RGA’s position as a global leader with a differentiated market position, disciplined underwriting approach, and proactive risk management. The company’s integrated asset management capabilities and biometric risk expertise are expected to continue driving long-term success.
While Q2 results showed some challenges in claims experience, RGA’s strong capital position, investment performance, and premium growth provide a solid foundation for future performance as the company continues to execute on its strategic initiatives, including the integration of the EQH transaction in the coming quarter.
Full presentation:
This article was generated with the support of AI and reviewed by an editor. For more information see our T&C.