Hansen, Mueller Industries director, sells $105,710 in stock

Introduction & Market Context
Rogers Communications Inc. (NYSE:RCI) presented its third-quarter 2025 results on October 23, showcasing a 4% increase in total service revenue despite a slight decline in adjusted EBITDA. The Canadian telecommunications giant demonstrated resilience across its business segments, with particularly strong performance in its media division.
The company, currently trading at $34.52 per share, continues to focus on efficiency and financial discipline while maintaining industry-leading margins in its core wireless and cable businesses. Rogers also highlighted progress on its third strategic growth pillar – sports and media – which has become an increasingly important component of its business portfolio.
Quarterly Performance Highlights
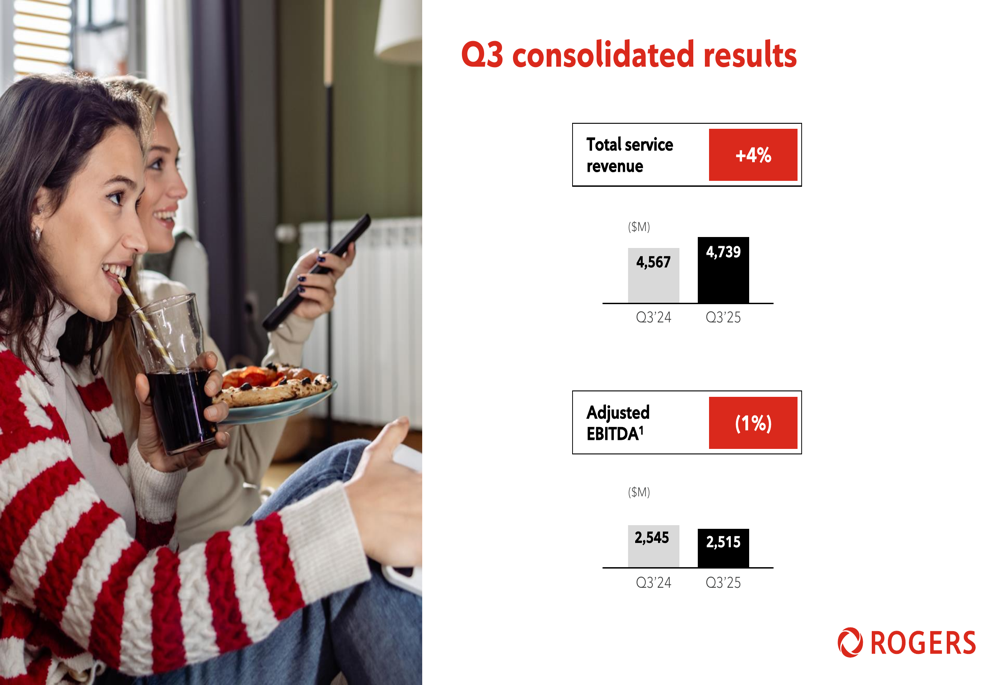
Rogers reported total service revenue of $4,739 million in Q3 2025, representing a 4% increase from $4,567 million in the same period last year. However, adjusted EBITDA decreased slightly by 1% to $2,515 million, compared to $2,545 million in Q3 2024.
As shown in the following consolidated results chart:
The company added 111,000 mobile phone subscribers and 29,000 retail Internet subscribers during the quarter. Customer loyalty improved significantly, with postpaid mobile phone churn reaching 0.99%, representing the best performance in over two years and a 13 basis point improvement from 1.12% in Q3 2024.
Rogers’ detailed consolidated results provide a comprehensive view of its financial performance:
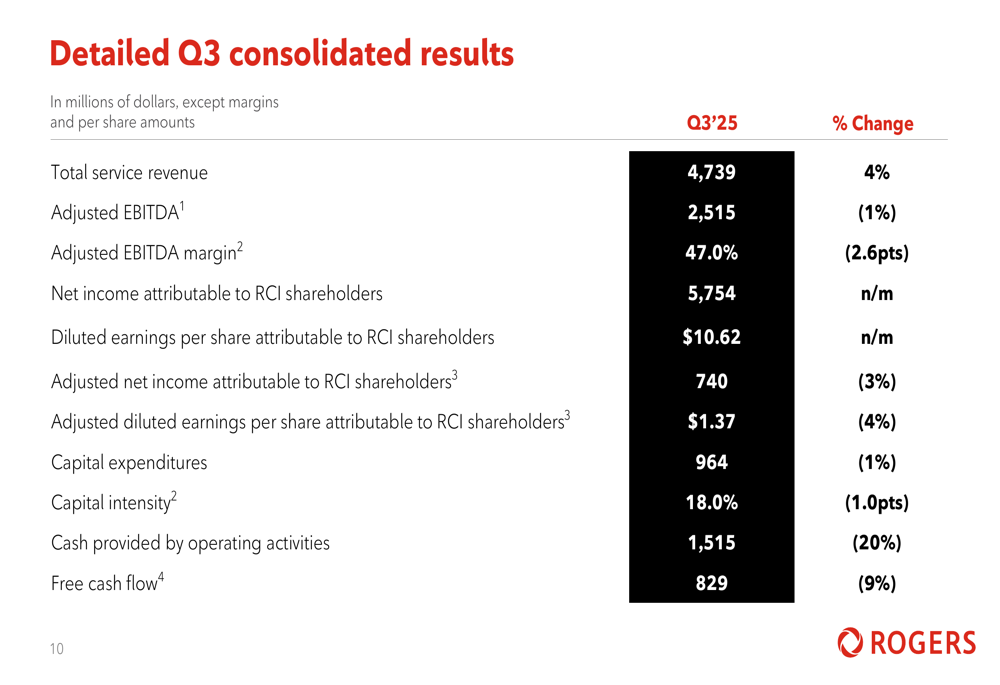
Free cash flow decreased by 9% to $829 million, while capital expenditures remained relatively stable at $964 million, representing a 1% decrease from the previous year. The company’s capital intensity improved to 18.0%, down from 19.0% in Q3 2024.
Segment Analysis
Wireless Segment
Rogers’ wireless segment maintained steady performance with service revenue of $2,059 million, essentially flat compared to $2,066 million in Q3 2024. Adjusted EBITDA increased by 1% to $1,374 million, resulting in an industry-leading margin of 66.7%, a 60 basis point improvement year-over-year.
The following chart illustrates the wireless segment’s key metrics:
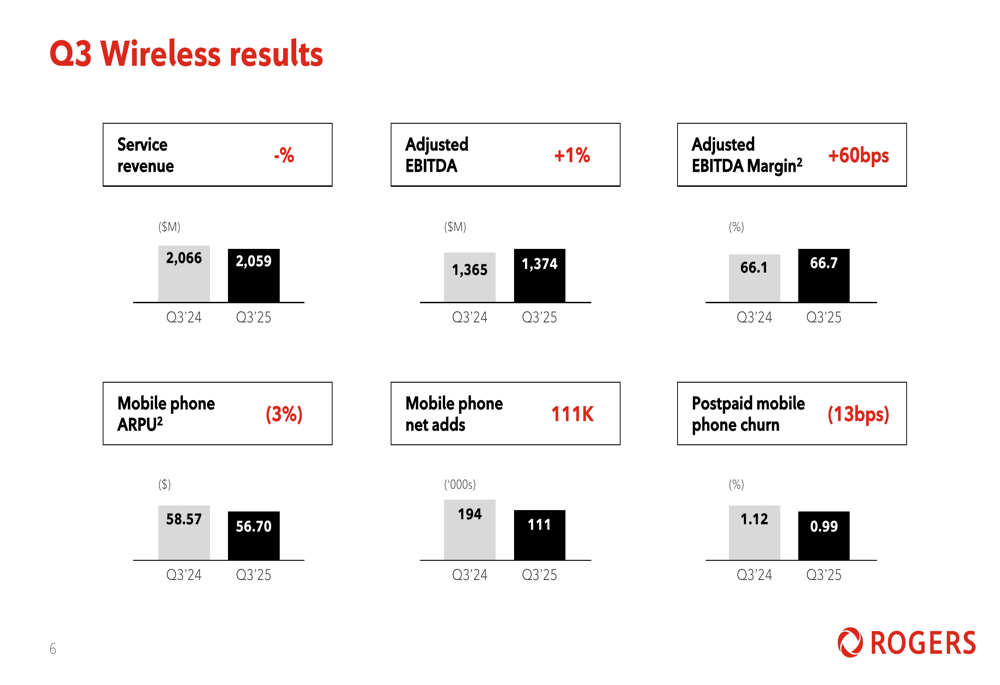
Mobile phone ARPU (average revenue per user) declined by 3% to $56.70, while net additions of mobile phone subscribers reached 111,000, down from 194,000 in the same period last year. Despite the decrease in subscriber additions, the improvement in churn rate demonstrates the company’s focus on customer retention.
Cable Segment
The cable segment showed modest growth with service revenue increasing by 1% to $1,974 million. Adjusted EBITDA rose by 2% to $1,153 million, resulting in a margin of 58.2%, up 70 basis points from 57.5% in Q3 2024.
The cable segment’s performance is illustrated in the following chart:
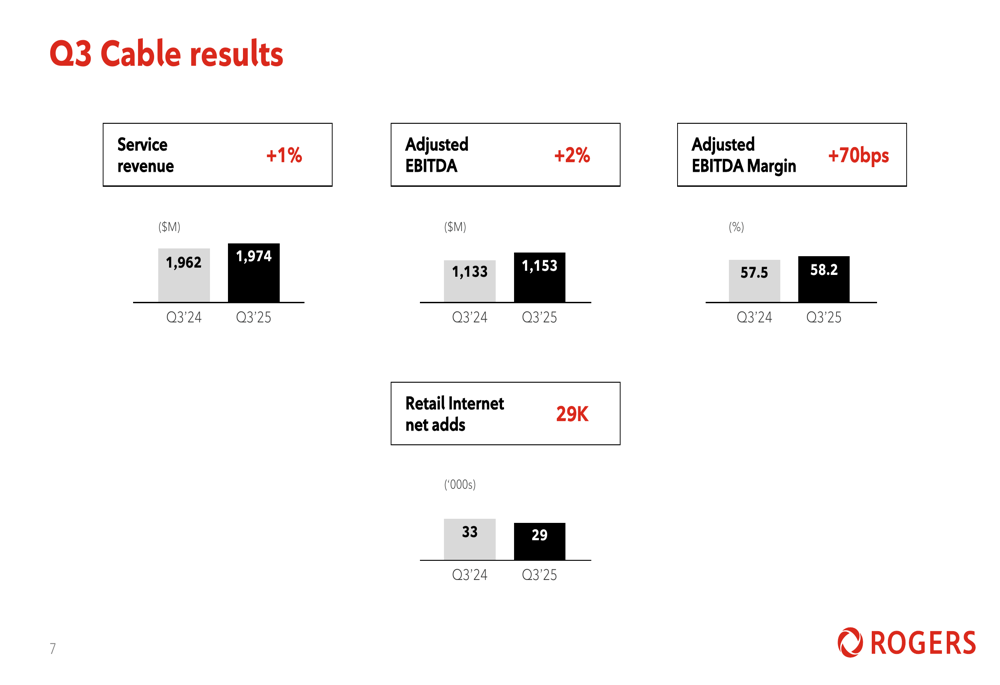
Retail Internet net additions totaled 29,000, slightly down from 33,000 in Q3 2024, reflecting the competitive nature of the broadband market.
Media Segment
The media segment was the standout performer for Rogers in Q3 2025, with revenue surging 26% to $753 million, compared to $597 million in the same period last year. This growth was primarily driven by the strong performance of the Toronto Blue Jays regular season and the consolidation of MLSE (Maple Leaf Sports & Entertainment) results.
The following chart shows the media segment’s performance:
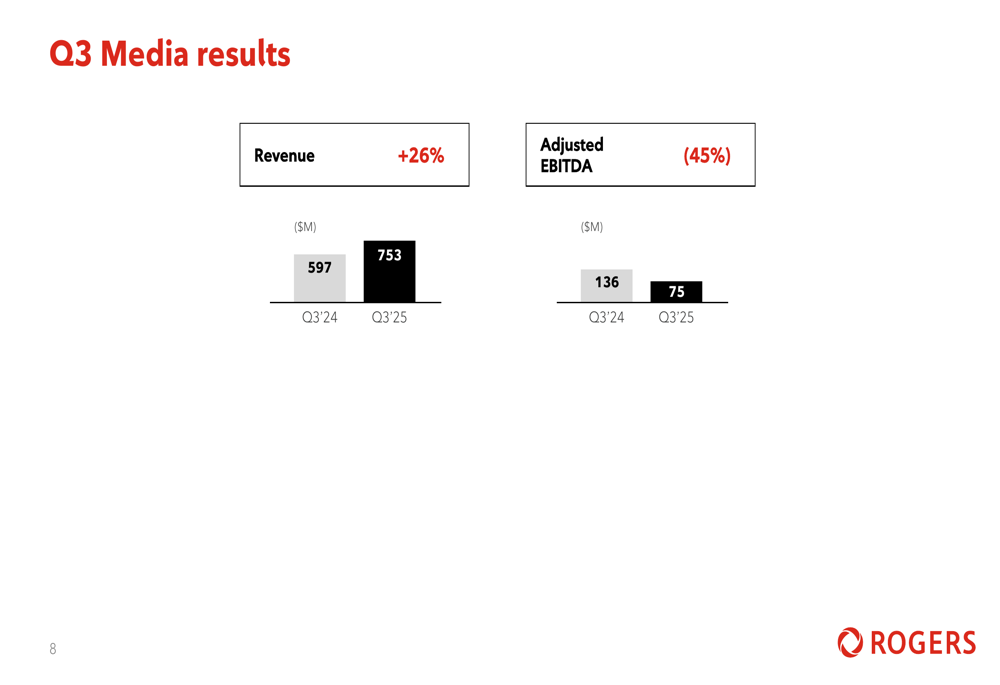
Despite the significant revenue growth, adjusted EBITDA for the media segment decreased by 45% to $75 million. This decline suggests increased costs associated with sports content and operations, potentially including player salaries and production expenses.
Financial Position and Outlook
Rogers maintained a strong financial position with available liquidity of $6.4 billion and a debt leverage ratio of 3.9x. The company’s weighted average interest rate stood at 4.80% with an average term to maturity of 8.7 years.
For the full year 2025, Rogers reaffirmed its guidance:
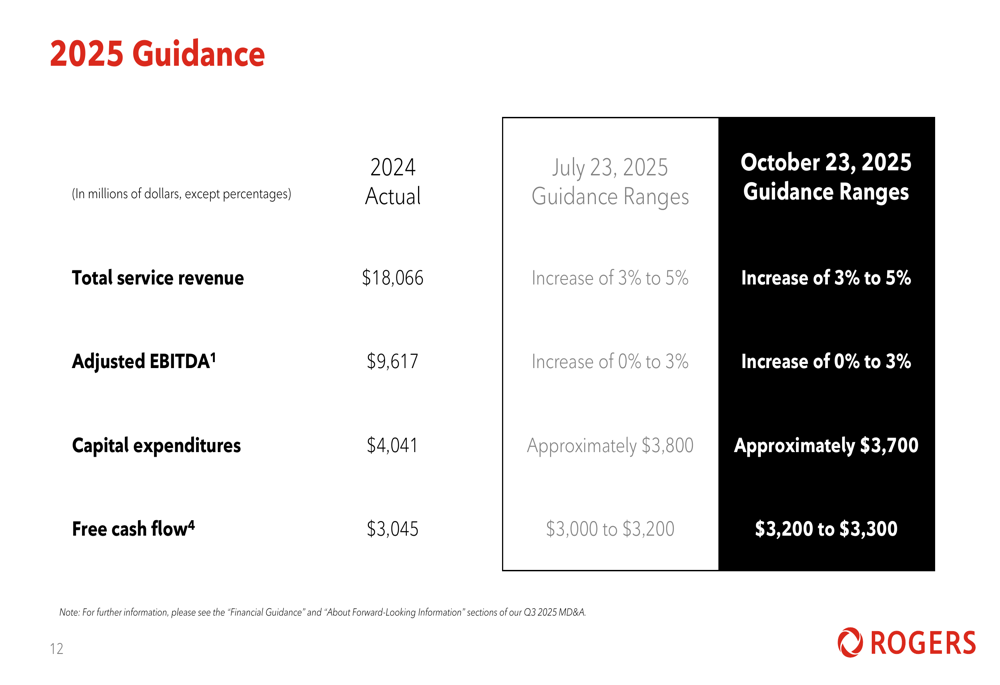
The company expects total service revenue to increase by 3% to 5% from $18,066 million in 2024, and adjusted EBITDA to grow between 0% and 3% from $9,617 million. Capital expenditures are projected to be approximately $3,700 million, down from $4,041 million in 2024, while free cash flow is expected to reach $3,200 to $3,300 million, up from $3,045 million.
Forward-Looking Statements
Rogers continues to execute its strategy focused on three pillars: wireless, cable, and sports and media. The company’s emphasis on efficiency and financial discipline has resulted in industry-leading margins in its core businesses.
The Q3 results highlight Rogers’ ability to generate steady growth in a competitive telecommunications landscape while investing in its sports and media assets. The significant growth in the media segment underscores the increasing importance of this business unit to Rogers’ overall portfolio.
As the company moves forward, maintaining wireless and cable margins while managing the costs associated with its expanding media business will be crucial for sustained profitability and cash flow generation. The improved customer loyalty metrics suggest that Rogers’ investments in network quality and customer service are yielding positive results, which could support long-term subscriber growth and revenue stability.
Full presentation:
This article was generated with the support of AI and reviewed by an editor. For more information see our T&C.