Tonix Pharmaceuticals stock halted ahead of FDA approval news

Introduction & Market Context
RXO Inc (NYSE:RXO) released its first-quarter 2025 results on May 7, showing significant revenue growth following the Coyote Logistics acquisition while navigating a challenging freight market. The logistics provider’s stock has been under pressure, trading down 4.18% at the previous close and falling further in pre-market trading, suggesting investor concerns despite the company’s progress on integration milestones.
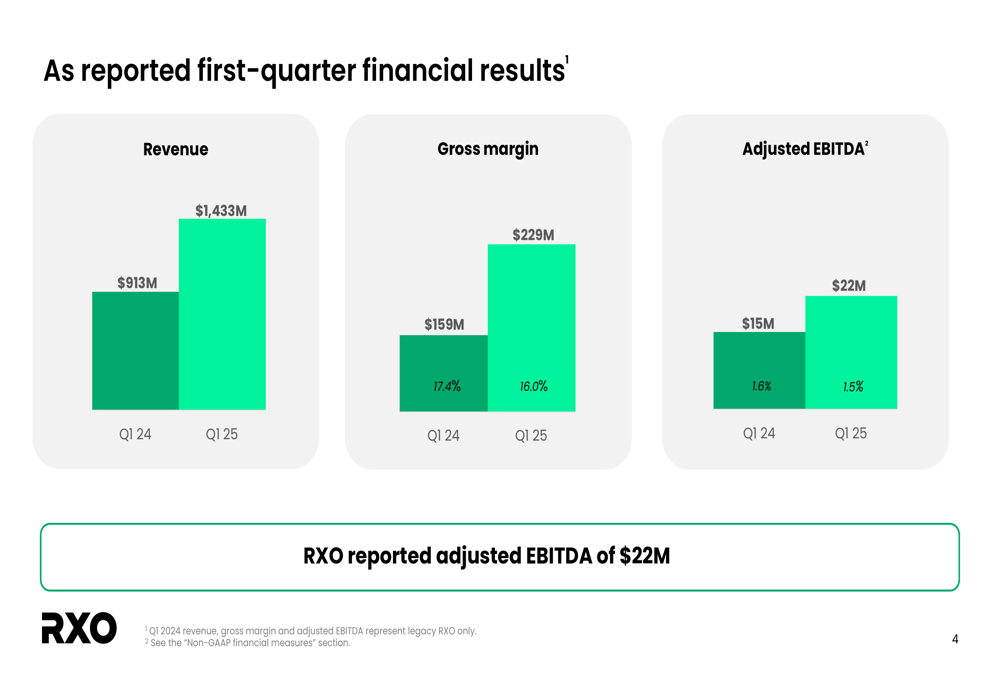
The company reported $1.43 billion in revenue for Q1 2025, a 57% increase from the $913 million reported in the same period last year, primarily driven by the Coyote acquisition. However, adjusted EBITDA margins compressed slightly to 1.5% from 1.6% a year ago, reflecting ongoing market challenges and integration costs.
Quarterly Performance Highlights
RXO’s first quarter showed mixed financial results with substantial revenue growth but modest profitability. The company reported adjusted EBITDA of $22 million, up from $15 million in Q1 2024, while adjusted diluted EPS remained flat at $(0.03) year-over-year.
Gross margin reached $229 million (16.0% of revenue) compared to $159 million (17.4%) in the prior year, indicating some margin compression despite the larger scale of operations.
As shown in the following financial results chart:
The company highlighted several operational achievements during the quarter, including the completion of Coyote carrier and coverage migration to RXO Connect, double-digit LTL brokerage volume growth, and accelerated growth in Last Mile services.
Integration Progress & Synergies
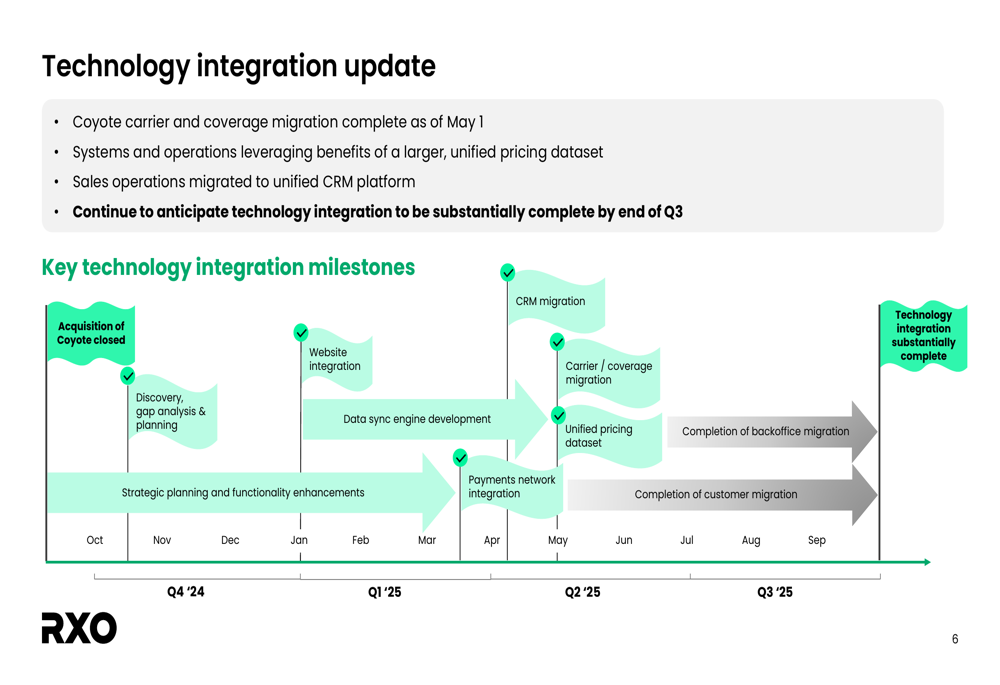
A significant milestone in RXO’s integration of Coyote Logistics was achieved with the completion of carrier and coverage migration to the RXO platform on May 1. This integration enables improved capacity management and more effective transportation procurement across the combined network.
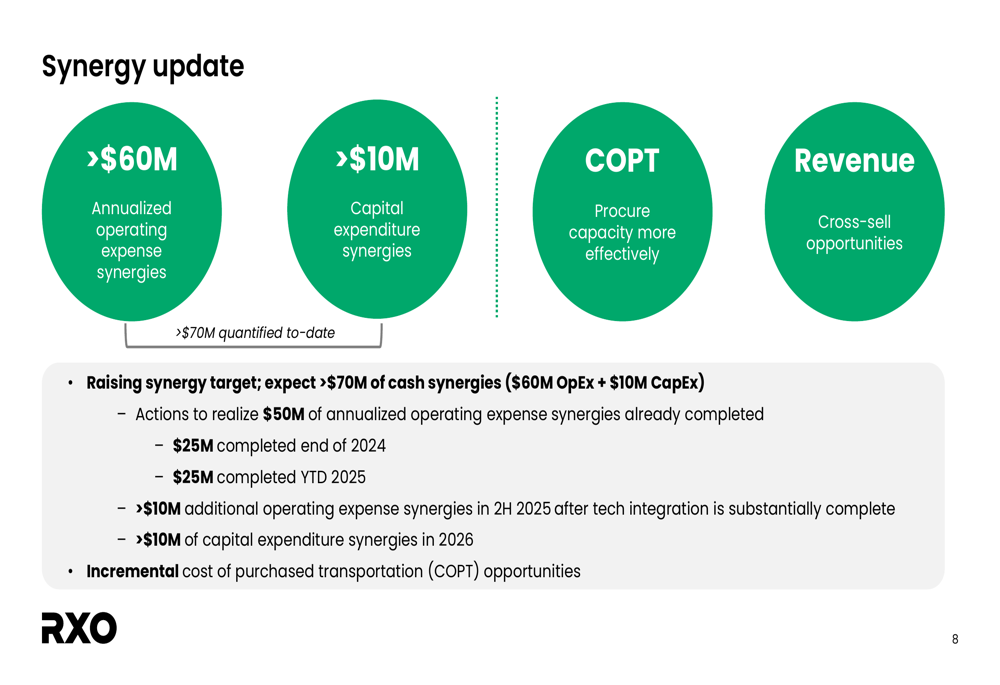
The company has raised its synergy targets, now expecting more than $70 million in cash synergies ($60 million in operating expenses and $10 million in capital expenditures). Management noted that actions to realize $50 million of annualized operating expense synergies have already been completed.
The synergy update is illustrated in the following slide:
RXO expects the technology integration to be substantially complete by the end of Q3 2025, with a detailed timeline of integration milestones outlined in its presentation:
Segment Performance
RXO’s business segments showed divergent performance in the first quarter. The company’s revenue mix demonstrates its diversified portfolio across truck brokerage, managed transportation, and last mile services:
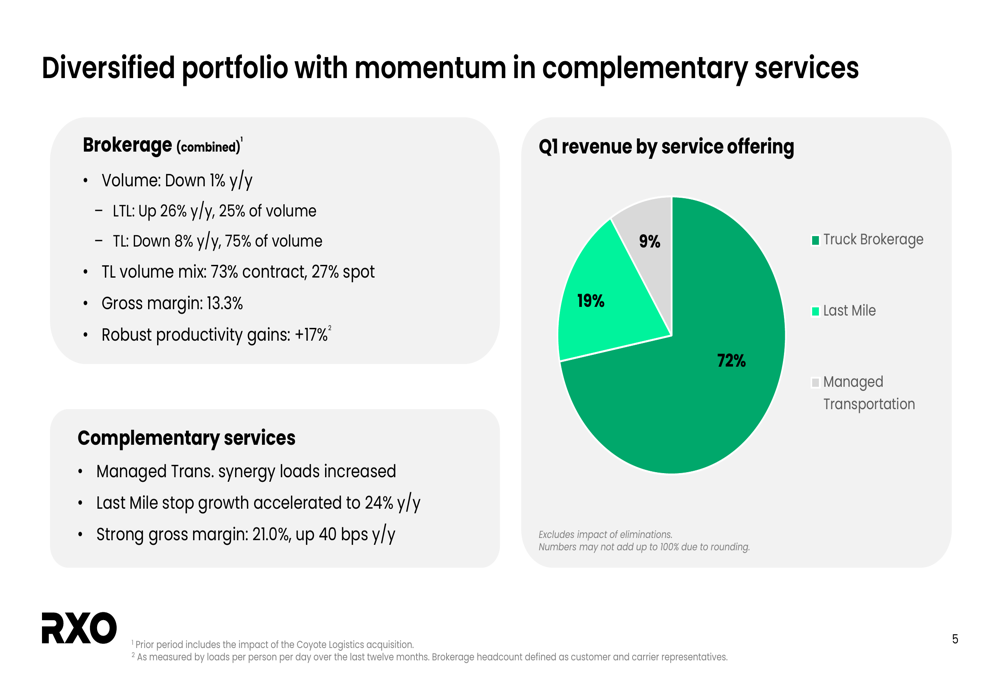
Brokerage volume declined 1% year-over-year overall, with a notable difference between truckload and less-than-truckload (LTL) performance. LTL volume grew impressively at 26% year-over-year, now representing 25% of total brokerage volume. In contrast, truckload volume declined 8%, accounting for 75% of volume.
Last Mile services continued to gain market share with stop growth accelerating to 24% year-over-year, while maintaining strong gross margins of 21.0%, up 40 basis points from the previous year.
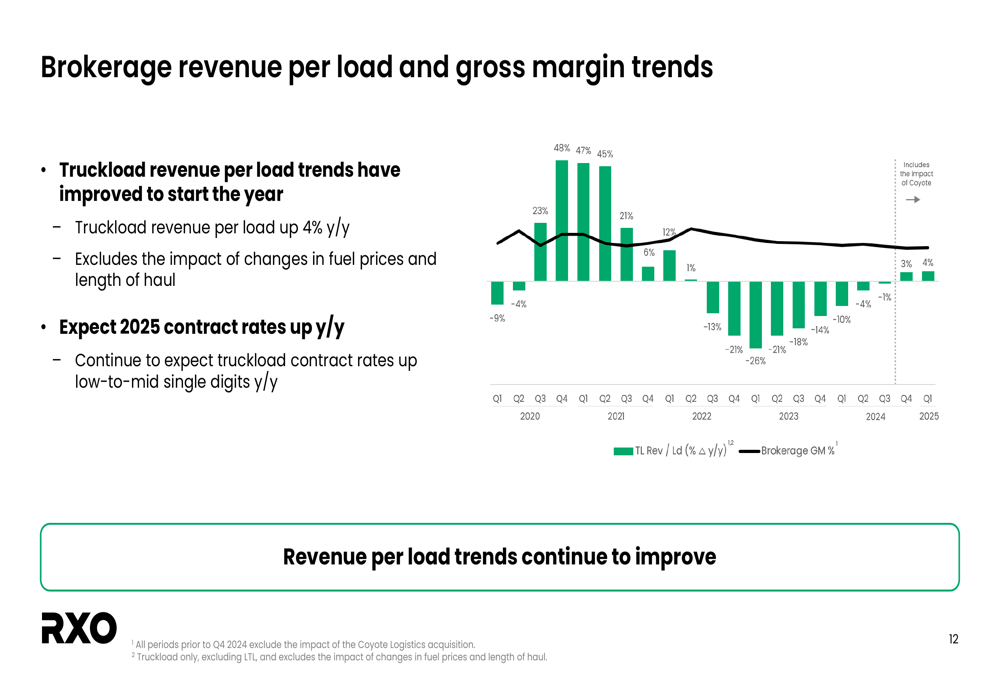
The company’s brokerage revenue per load and gross margin trends show improvement in early 2025:
Market Conditions & Outlook
RXO noted that market conditions loosened after January, creating uncertainty among shippers. The company is experiencing continued soft trends at the start of Q2, with April truckload volume down mid-single digits compared to March. Automotive weakness continues to impact volume, particularly in the Managed Transportation segment.
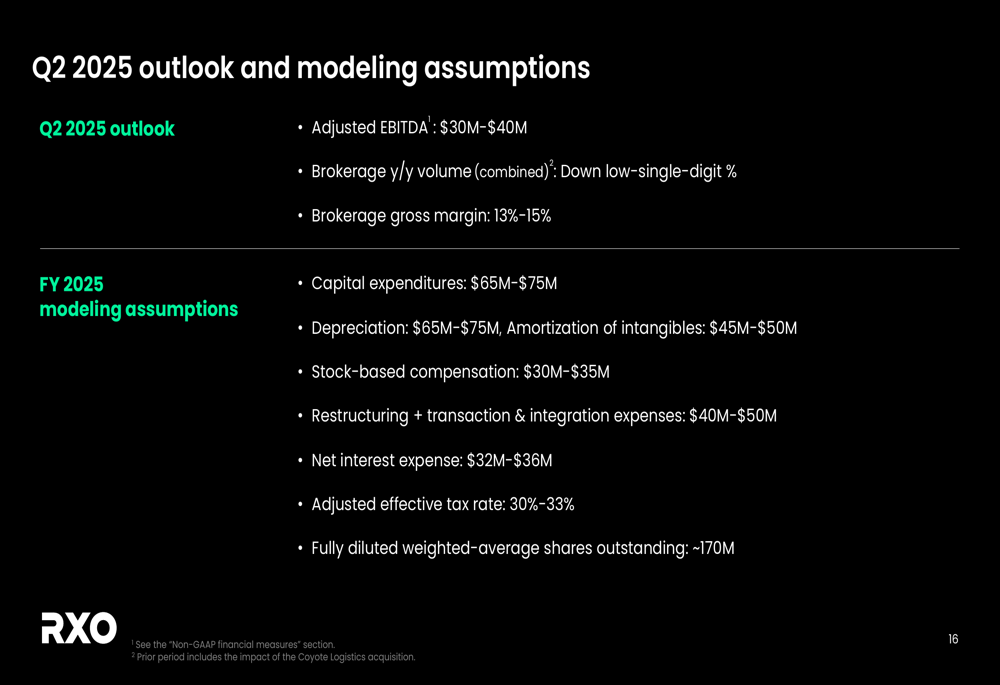
For Q2 2025, RXO provided the following outlook:
- Adjusted EBITDA of $30-40 million
- Brokerage volume expected to be down low-single-digit percentage year-over-year
- Brokerage gross margin projected at 13-15%
The company’s full-year modeling assumptions include capital expenditures of $65-75 million and net interest expense of $32-36 million.
Despite near-term challenges, management highlighted several idiosyncratic drivers expected to benefit RXO, including contract rate increases continuing to phase in and technology advancements driving increased productivity.
Financial Position
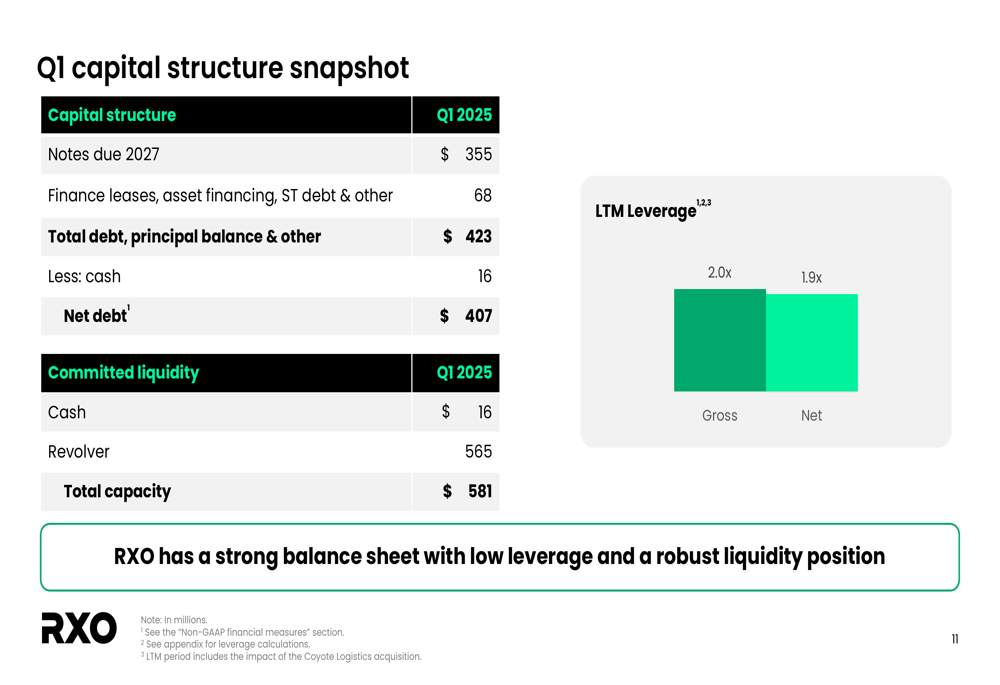
RXO maintained a relatively strong balance sheet with total debt of $423 million and net debt of $407 million as of Q1 2025. The company’s leverage ratios stood at 2.0x gross and 1.9x net, with committed liquidity of $581 million.
The capital structure is detailed in the following snapshot:
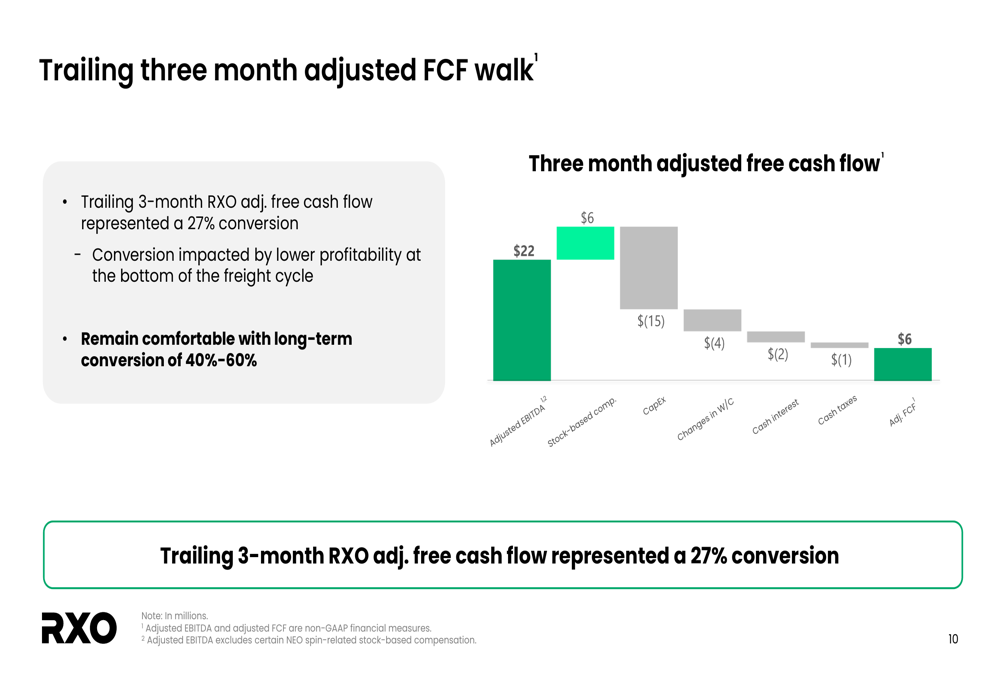
Free cash flow conversion for the trailing three months was 27%, below the company’s long-term target of 40-60%. Management attributed this to lower profitability at the bottom of the freight cycle but expressed confidence in achieving the long-term conversion target as market conditions improve.
RXO’s first quarter results demonstrate the company’s progress in integrating Coyote Logistics while navigating a challenging freight market. With the carrier migration complete and synergy targets raised, management is focusing on leveraging the combined company’s scale and technology to improve profitability as it progresses through 2025, despite persistent softness in certain market segments.
Full presentation:
This article was generated with the support of AI and reviewed by an editor. For more information see our T&C.