Moody’s downgrades Senegal to Caa1 amid rising debt concerns

Introduction & Market Context
Ryder System (NYSE:R), Inc. presented its second quarter 2025 earnings on July 24, 2025, highlighting the company’s continued progress in transforming its business model to deliver higher returns and greater resilience during freight market downturns. The transportation and logistics company reported an 11% increase in comparable earnings per share despite mixed segment performance, underscoring the effectiveness of its strategic initiatives.
The company emphasized that its structurally higher contractual earnings and strategic initiatives have enabled it to maintain strong performance even as the freight industry faces cyclical challenges. Ryder’s presentation highlighted how its business transformation has fundamentally changed its earnings and return profile compared to previous cycles.
Quarterly Performance Highlights
Ryder reported Q2 2025 operating revenue of $2.6 billion, representing a 2% increase compared to the same period last year. More impressively, comparable earnings per share rose 11% to $3.32, up from $3.00 in Q2 2024. The company attributed this growth to higher contractual earnings and the positive impact of share repurchases.
As shown in the following results overview chart, Ryder’s return on equity (ROE) improved to 17% on a trailing 12-month basis, up from 16% in the prior year period:
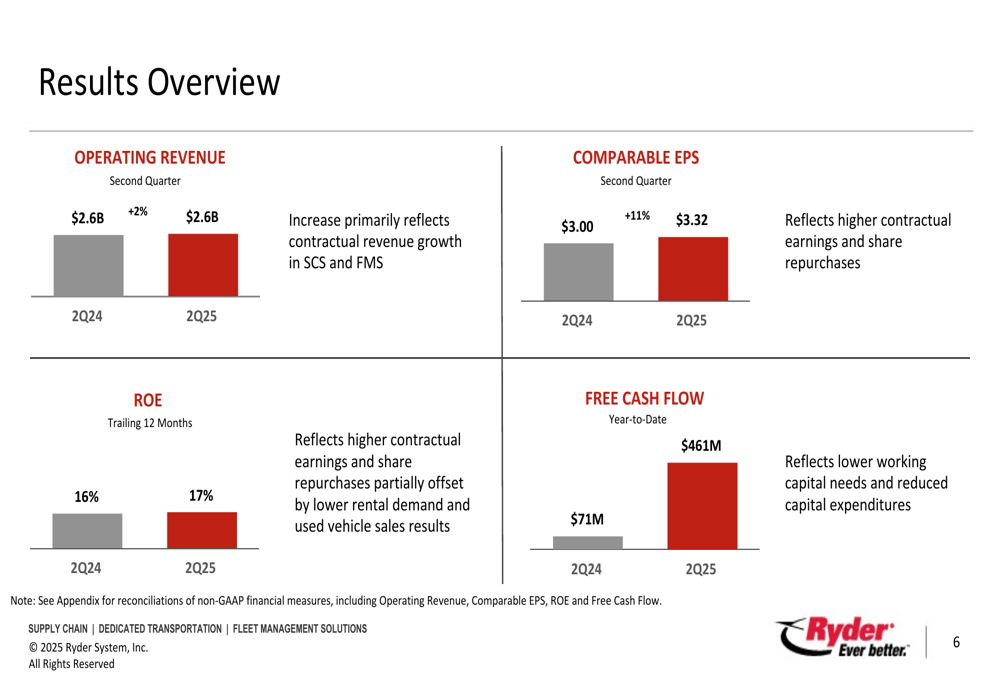
Free cash flow saw a dramatic improvement, reaching $461 million year-to-date, compared to just $71 million in the same period of 2024. This substantial increase reflects lower working capital needs and reduced capital expenditures, providing the company with greater financial flexibility.
Ryder’s CEO highlighted the company’s transformation journey, pointing to the significant changes in its revenue mix and profitability profile since 2018. The presentation illustrated how the company has shifted toward higher-margin businesses while improving returns:
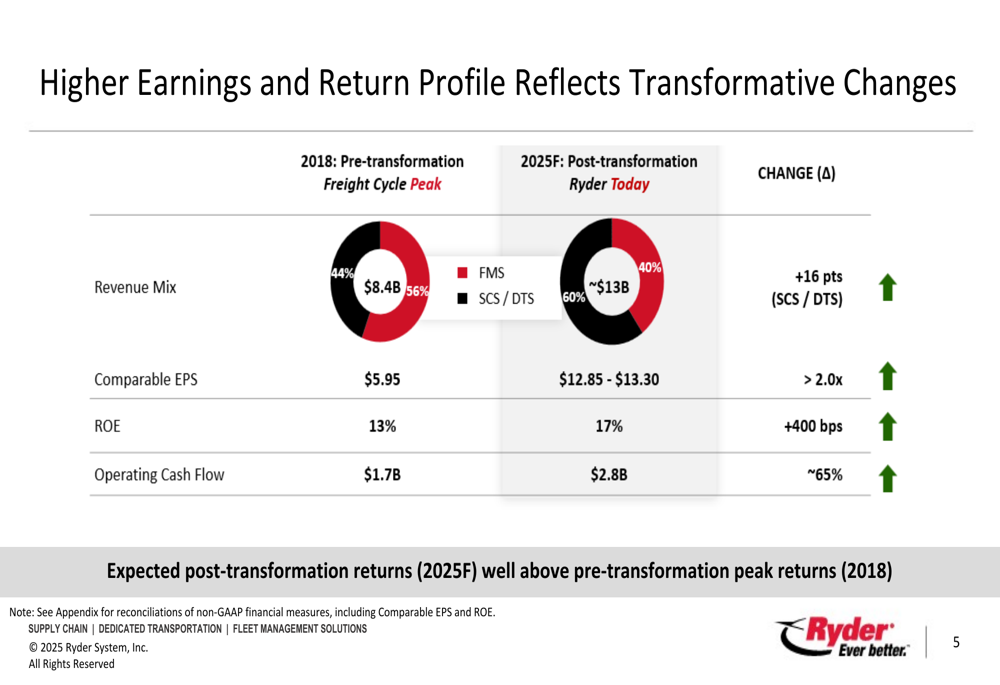
This transformation has resulted in comparable EPS more than doubling from $5.95 in 2018 to a projected $12.85-$13.30 in 2025, while ROE has improved by 400 basis points to 17%. Operating cash flow has also seen a substantial increase of approximately 65% over this period.
Segment Performance Analysis
Ryder’s performance across its three business segments revealed contrasting results, with Supply Chain Solutions (SCS) showing particular strength while Fleet Management Solutions (FMS) faced challenges in the used vehicle market.
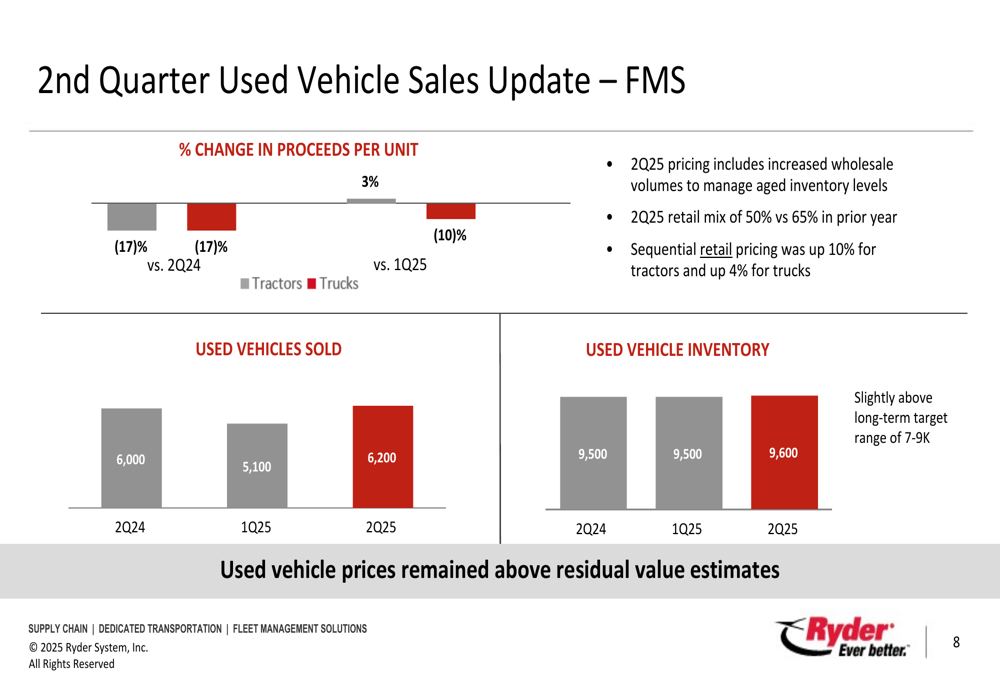
The Fleet Management Solutions segment reported a modest 1% increase in operating revenue to $1.3 billion, driven by higher ChoiceLease revenue. However, earnings before tax decreased by 6% to $126 million, with EBT margin declining from 10.4% to 9.7%. This decline was primarily attributed to weaker used vehicle sales results amid challenging market conditions.
The following chart illustrates the challenges in the used vehicle market, with proceeds per unit declining 17% year-over-year for both trucks and tractors:
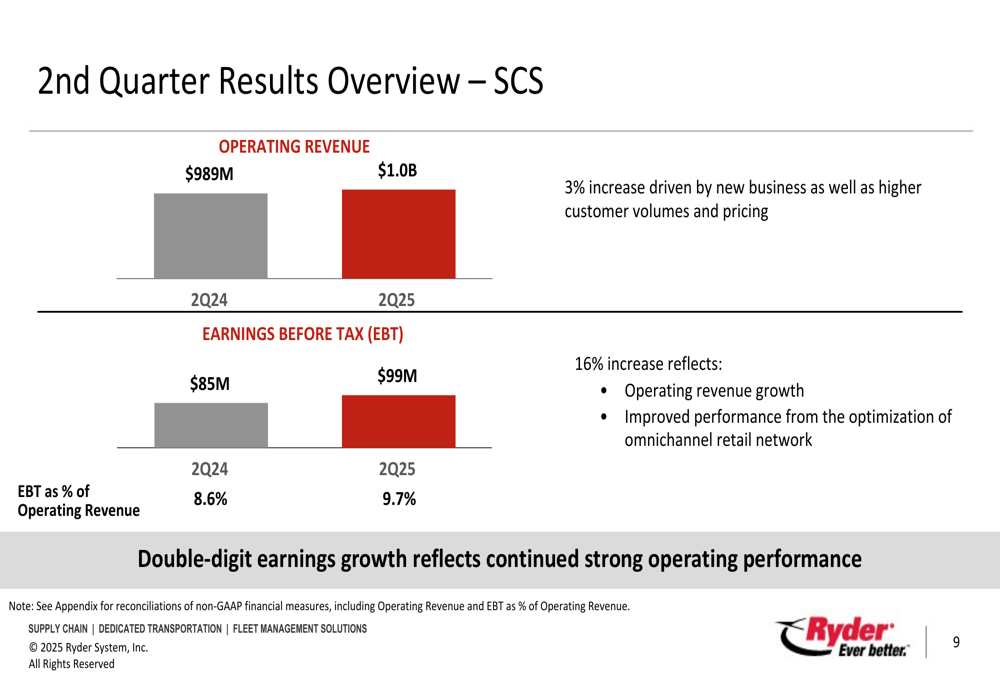
In contrast, the Supply Chain Solutions segment delivered strong results, with operating revenue increasing 3% to $1.0 billion and earnings before tax surging 16% to $99 million. This performance was driven by new business, higher customer volumes, improved pricing, and enhanced performance from the optimization of the omnichannel retail network.
As shown in the SCS results overview, the segment’s profitability improved significantly with EBT margin expanding from 8.6% to 9.7%:
The Dedicated Transportation Solutions segment experienced a 3% decrease in operating revenue to $470 million, reflecting lower fleet count due to the prolonged freight market downturn. Despite this, earnings before tax increased slightly by 1% to $37 million, with EBT margin improving from 7.6% to 7.9%, benefiting from acquisition synergies and the absence of prior year integration costs.
Strategic Transformation Progress
A key theme throughout Ryder’s presentation was the company’s strategic transformation and its impact on long-term resilience and profitability. The company highlighted how its business model has evolved to generate higher and more stable returns across economic cycles.
Ryder’s strategy focuses on profitable contractual growth across lease, dedicated, and supply chain services, complemented by initiatives to improve pricing, realize acquisition synergies, and optimize its omnichannel retail network. These strategic initiatives are expected to deliver approximately $150 million in pre-tax earnings plus an additional $70 million in incremental benefits in 2025.
The company’s transformed business model is expected to generate significant capital deployment capacity over the next three years, as illustrated in this capital allocation forecast:
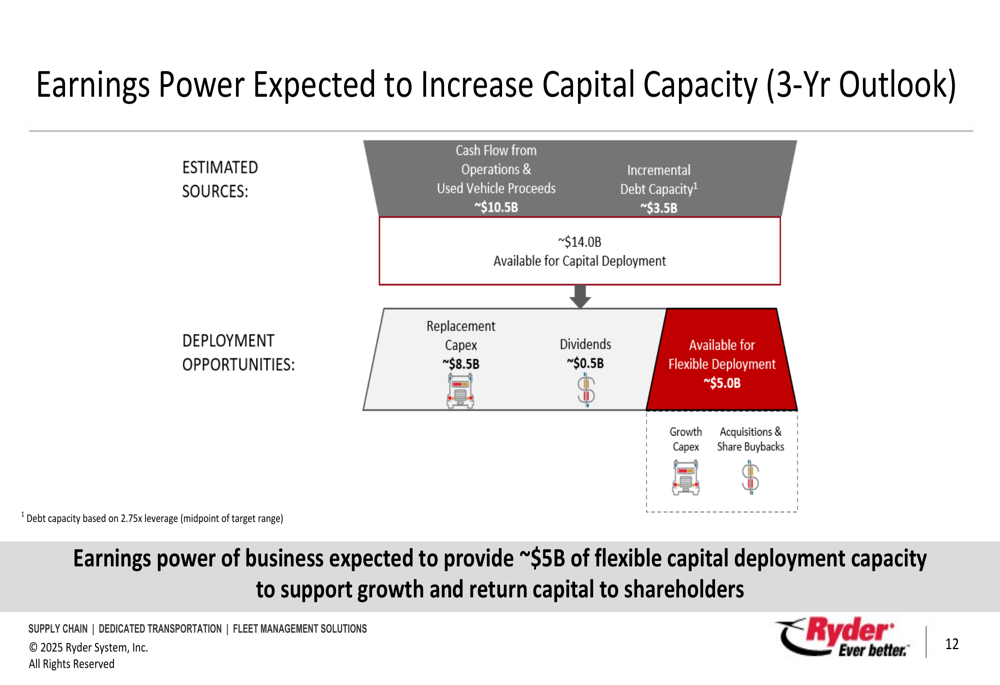
This chart shows that Ryder anticipates approximately $14 billion in available capital for deployment over the next three years, with about $5 billion available for flexible deployment after accounting for replacement capital expenditures and dividends. This financial flexibility positions the company to pursue growth opportunities and return capital to shareholders.
Capital Allocation & Outlook
Ryder’s capital allocation strategy reflects its improved financial position, with the company increasing its quarterly dividend by 12% and returning $330 million to shareholders year-to-date. The company has also reduced its planned capital expenditures for 2025 to $2.3 billion, down from $2.7 billion in 2024.
Looking ahead, Ryder updated its full-year 2025 comparable EPS forecast range to $12.85-$13.30, reflecting continued strong contractual earnings performance despite near-term headwinds from the used vehicle market and macroeconomic uncertainty. The company also raised its 2025 free cash flow forecast to $900 million-$1 billion, a significant increase from previous guidance.
As shown in the company’s outlook slide, Ryder expects continued earnings growth despite challenging conditions:
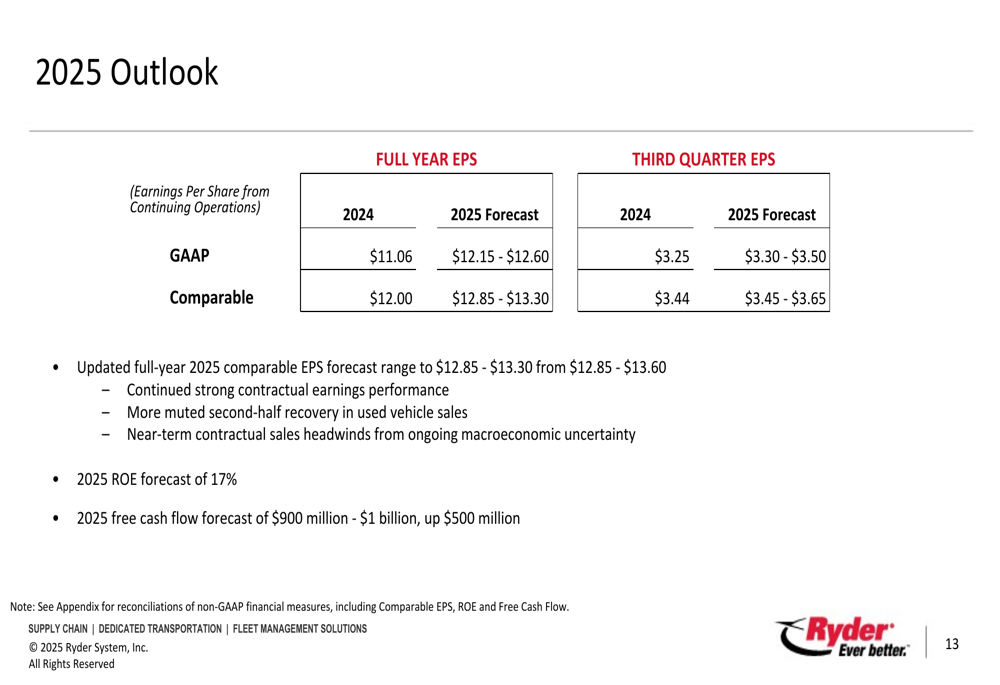
The company maintains its long-term ROE target of 17% for 2025, which it notes is in line with expectations during the current freight cycle downturn. Management emphasized that its transformed business model is expected to continue outperforming prior cycles, with strategic initiatives providing a foundation for earnings growth in 2025 and beyond.
Ryder’s presentation of historical sales prices as a percentage of original cost provides important context for understanding the used vehicle market dynamics affecting its FMS segment:
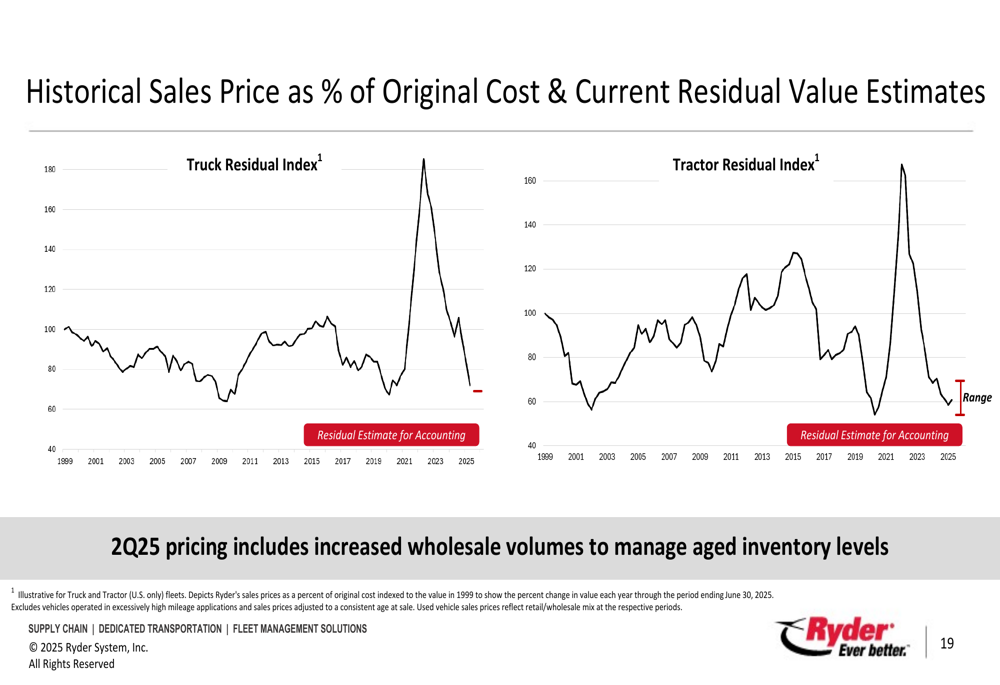
While used vehicle prices have declined from their peak, they remain above residual value estimates, providing some cushion against further market deterioration.
In conclusion, Ryder’s Q2 2025 presentation demonstrates how the company’s strategic transformation has enhanced its resilience and profitability despite freight market challenges. With improved free cash flow, a more favorable business mix, and significant capital deployment capacity, Ryder appears well-positioned to continue delivering value to shareholders while navigating industry cycles.
Full presentation:
This article was generated with the support of AI and reviewed by an editor. For more information see our T&C.