Joby Aviation closes $591 million stock offering with full underwriter option

Introduction & Market Context
Ryerson Holding Corp (NYSE:RYI) released its first quarter 2025 financial results presentation on May 1, showing sequential improvement in key metrics but still operating at a loss as the metals service center company continues to navigate challenging market conditions.
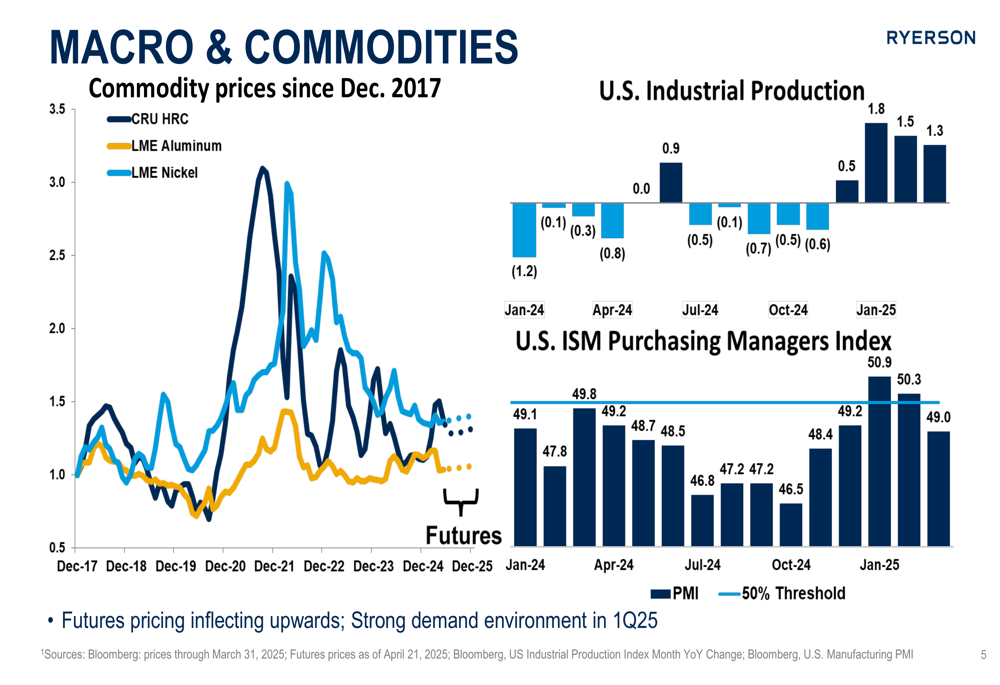
The company reported that while the U.S. ISM Purchasing Managers Index remained in contraction territory at 49.0 in January 2025, there were signs of improvement in the broader metals market, with futures pricing beginning to inflect upward amid a strengthening demand environment in the first quarter.
As shown in the following chart of commodity prices and economic indicators, Ryerson is operating in a market that has been showing early signs of recovery after a challenging period:
Quarterly Performance Highlights
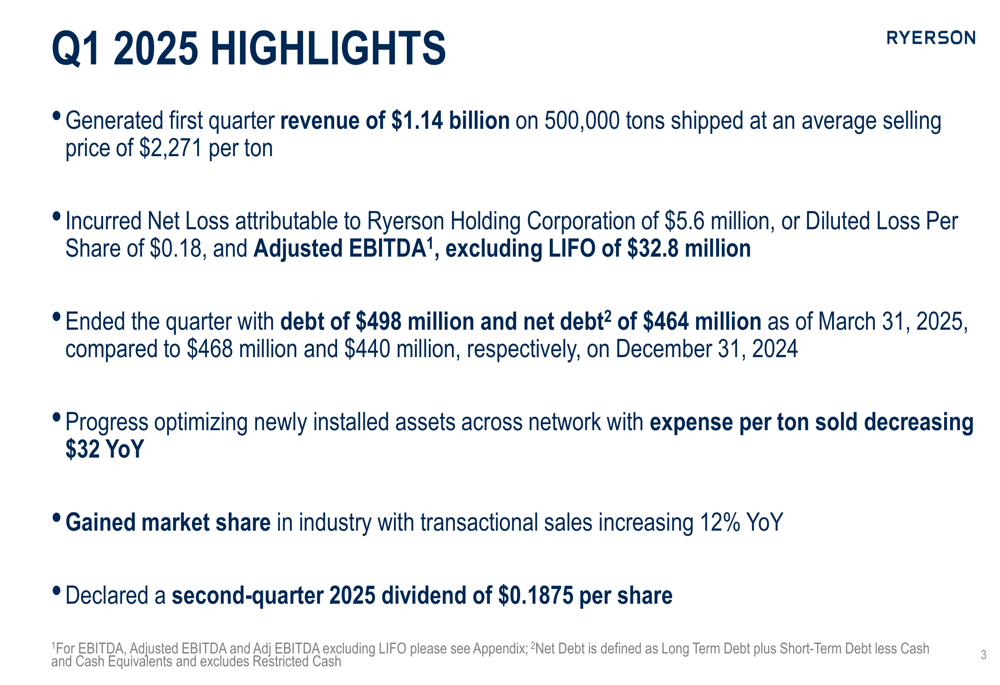
Ryerson reported Q1 2025 revenue of $1.14 billion on 500,000 tons shipped at an average selling price of $2,271 per ton. The company posted a net loss of $5.6 million, or diluted loss per share of $0.18, and Adjusted EBITDA excluding LIFO of $32.8 million.
Despite the continued net loss, Ryerson demonstrated meaningful sequential improvement from Q4 2024, with net sales increasing 12.7% quarter-over-quarter and tons shipped rising 11.9%. The company’s gross margin excluding LIFO improved to 18.6%, representing a 220 basis point increase from the previous quarter.
The following slide summarizes Ryerson’s key financial metrics for the first quarter:
Ryerson’s performance showed improvement across several operational metrics compared to the previous quarter, though the company has yet to return to profitability. The comprehensive financial summary below illustrates both the sequential improvements and ongoing challenges:
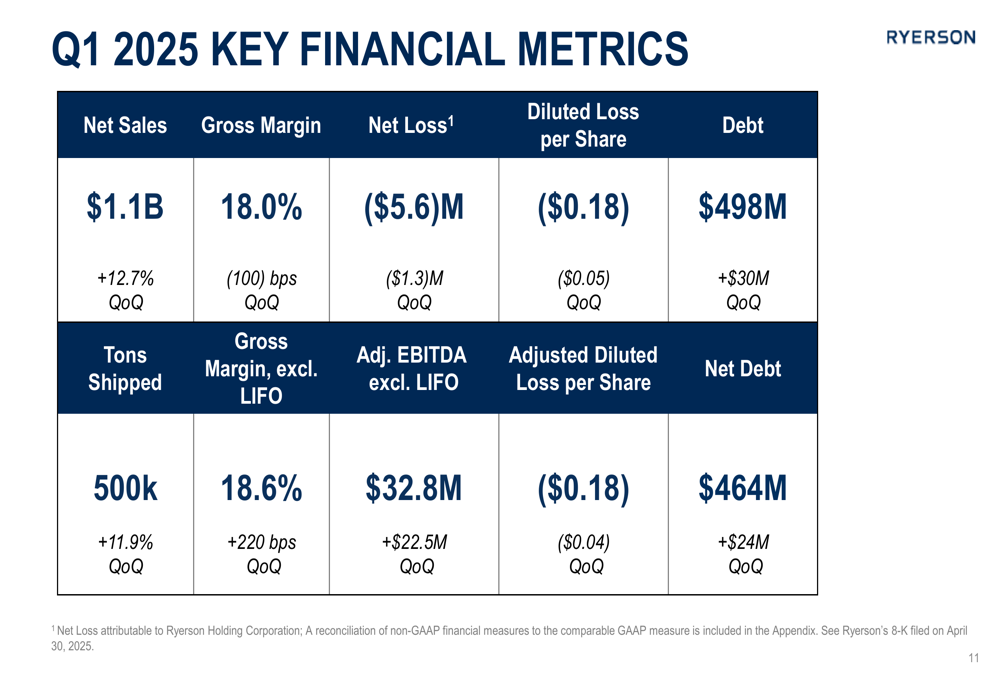
The company noted that it gained market share during the quarter, with transactional sales increasing 12% year-over-year. Expense per ton sold decreased by $32 compared to the prior year, reflecting the company’s ongoing cost management efforts.
Q2 2025 Outlook and Guidance
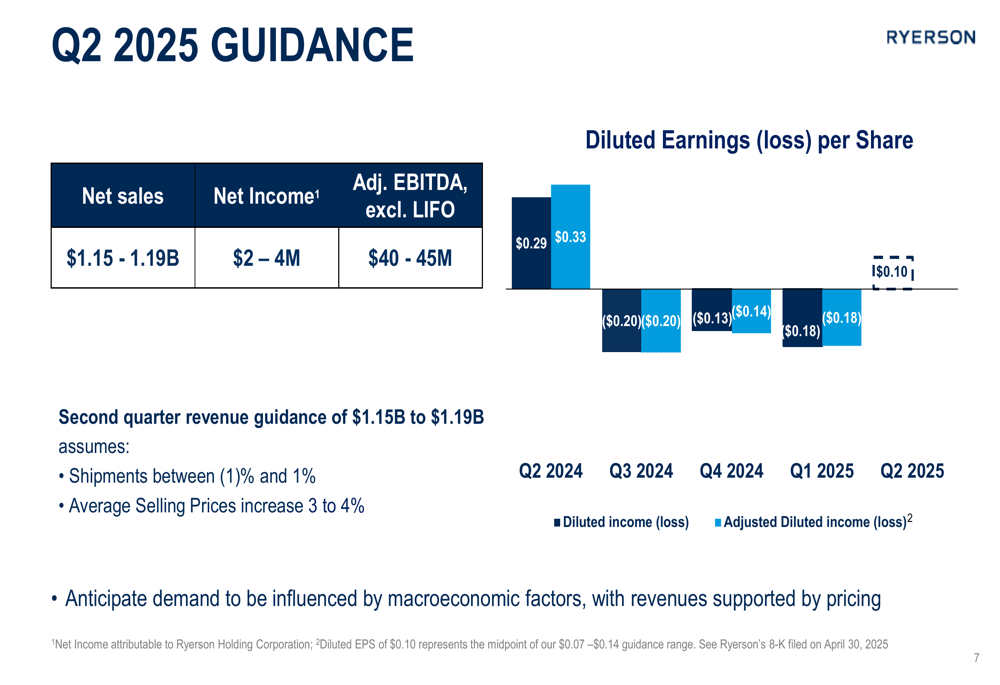
Looking ahead to the second quarter, Ryerson provided a relatively optimistic outlook, projecting a return to profitability with guidance for net sales of $1.15-1.19 billion and net income of $2-4 million. The company expects Adjusted EBITDA excluding LIFO to range between $40-45 million.
This guidance assumes shipments will remain relatively flat, between -1% and 1% compared to Q1, while average selling prices are projected to increase by 3-4%. Management indicated that demand is expected to be influenced by macroeconomic factors, with revenues supported by pricing improvements.
The following slide details Ryerson’s Q2 2025 guidance:
Strategic Initiatives and Capital Allocation
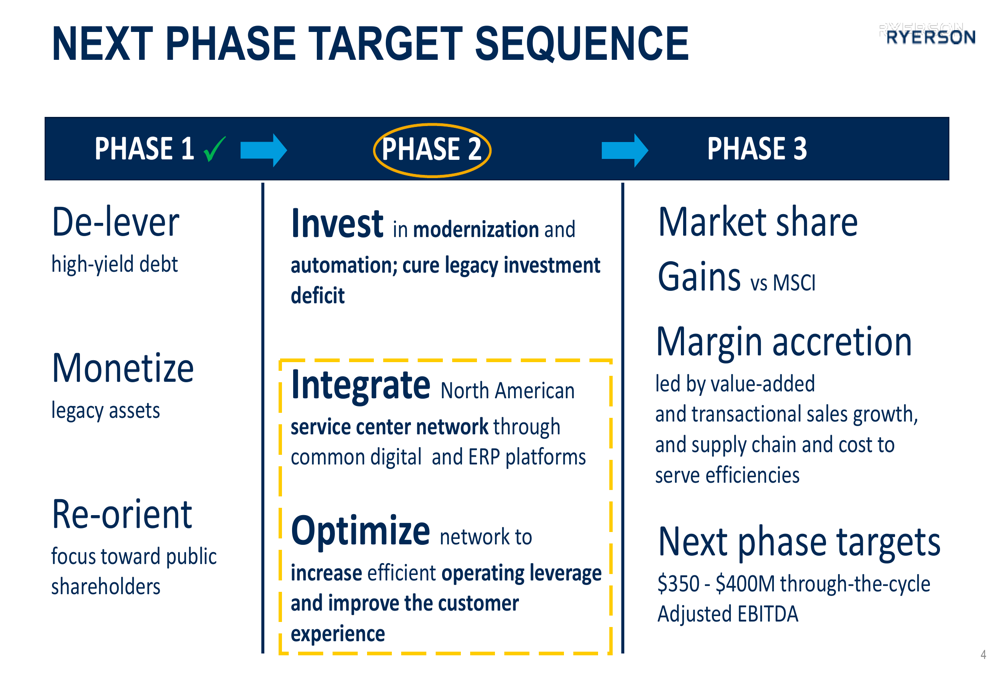
Ryerson outlined its strategic roadmap, which consists of three phases: 1) De-lever, Monetize, Re-orient; 2) Invest, Integrate, Optimize; and 3) Market share Gains, Margin accretion, with targets of $350-400 million in through-the-cycle Adjusted EBITDA.
The company is currently focused on investing in modernization and automation while optimizing its North American service center network to increase operating leverage and improve customer experience. Ryerson maintains a network of over 110 facilities and is investing in digital capabilities, including its 24/7 e-commerce platform.
The strategic roadmap is illustrated in the following slide:
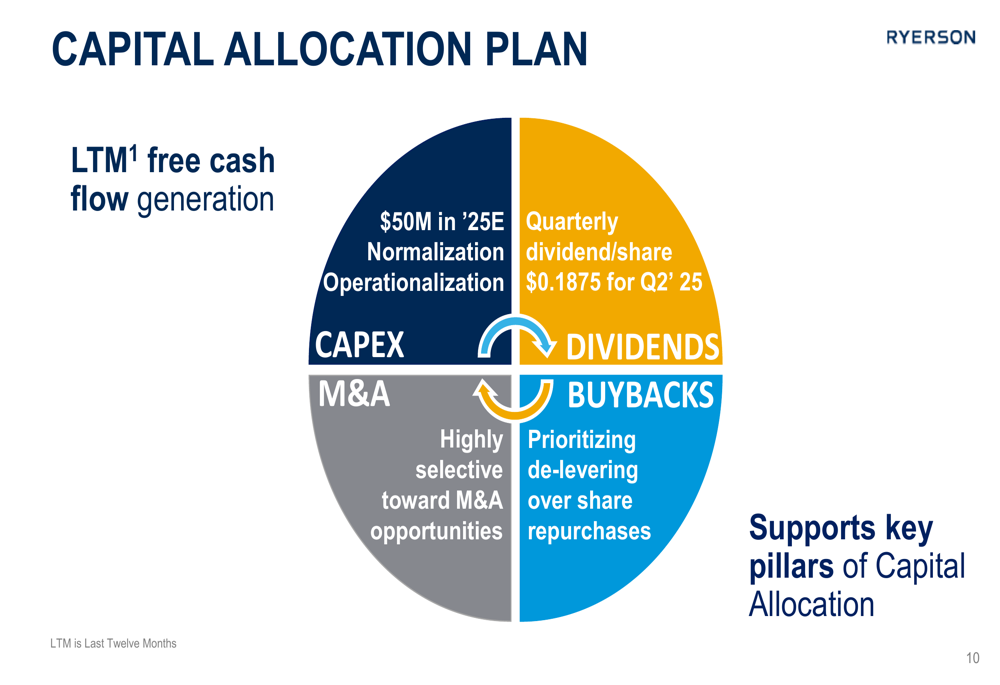
Regarding capital allocation, Ryerson declared a second-quarter 2025 dividend of $0.1875 per share, maintaining its commitment to shareholder returns despite current financial challenges. The company indicated it is prioritizing de-levering over share repurchases and remains highly selective toward M&A opportunities.
The capital allocation strategy is outlined in this slide:
Liquidity and Financial Position
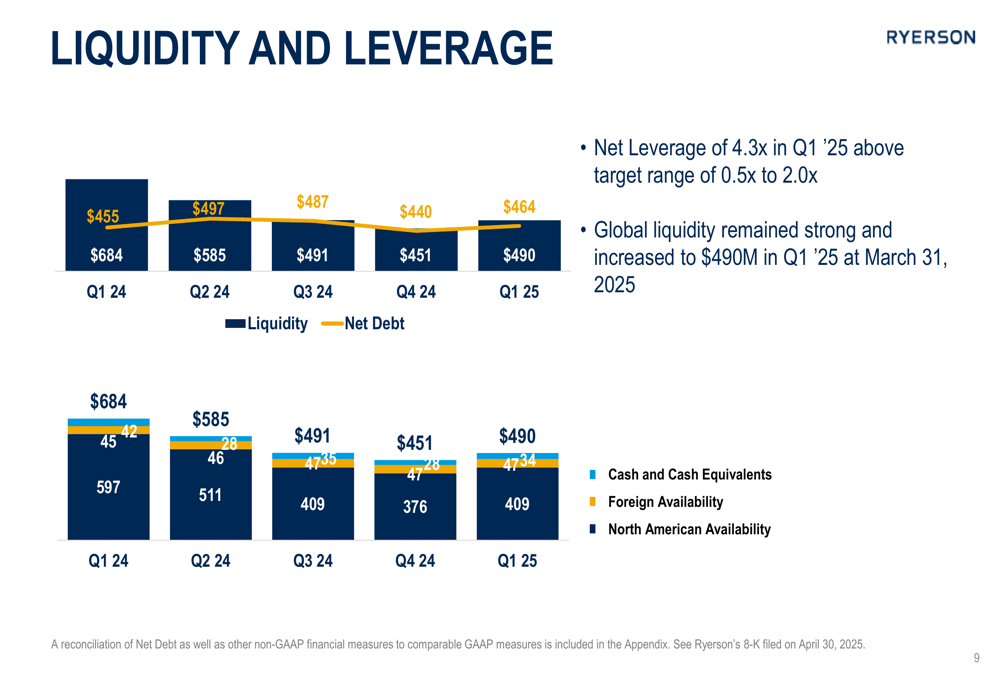
As of March 31, 2025, Ryerson reported debt of $498 million and net debt of $464 million, compared to $468 million and $440 million, respectively, at the end of 2024. The company’s net leverage ratio stood at 4.3x in Q1 2025, which remains above its target range of 0.5x to 2.0x.
Despite the elevated leverage, Ryerson maintained strong global liquidity, which increased to $490 million in the first quarter. The company reported cash used in operating activities of $41.2 million, which it attributed primarily to an increase in accounts receivable due to higher sequential volumes.
The following chart illustrates Ryerson’s liquidity and leverage position:
The company’s inventory days of supply decreased to 75 days, while its cash conversion cycle stood at 67 days. Ryerson plans capital expenditures of approximately $50 million for full-year 2025, with $8 million invested in the first quarter.
End Market Trends
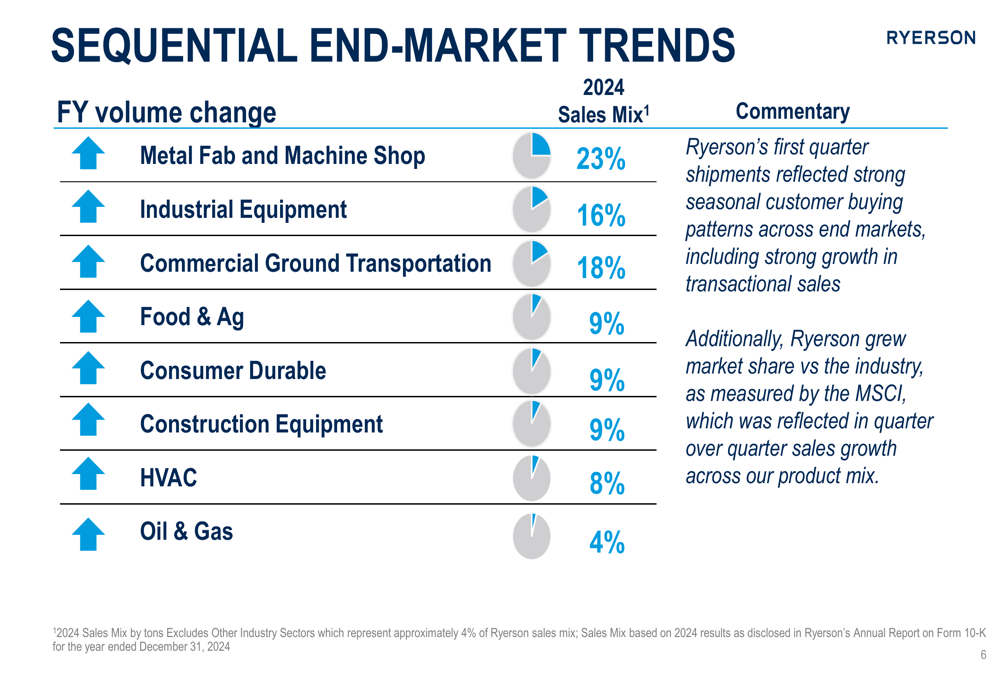
Ryerson’s first-quarter shipments reflected strong seasonal customer buying patterns across end markets. The company’s sales mix remains diversified across multiple sectors, with Metal Fabrication and Machine Shop representing 23% of sales, Commercial Ground Transportation at 18%, and Industrial Equipment at 16%.
The following slide provides a breakdown of Ryerson’s end-market exposure and trends:
In conclusion, Ryerson’s Q1 2025 results demonstrate sequential improvement from the previous quarter, though the company continues to operate at a loss. Management’s guidance suggests a return to profitability in the second quarter, supported by anticipated price increases and stable shipment volumes. The company remains focused on executing its strategic roadmap while maintaining its commitment to shareholder returns through consistent dividend payments.
Full presentation:
This article was generated with the support of AI and reviewed by an editor. For more information see our T&C.