Gold bars to be exempt from tariffs, White House clarifies

Introduction & Market Context
Saratoga Investment Corp (NYSE:SAR) presented its fiscal first quarter 2026 results on July 9, 2025, showing signs of recovery after a disappointing previous quarter. The business development company (BDC) reported improved net investment income and maintained strong portfolio quality despite ongoing market challenges.
The stock closed at $25.44 on July 8, 2025, down 1.57% for the day, and continued to decline slightly in after-hours trading, falling an additional 0.98% to $25.19. This performance comes after SAR experienced a significant 7.9% drop following its Q4 2025 earnings miss in the previous quarter.
Quarterly Performance Highlights
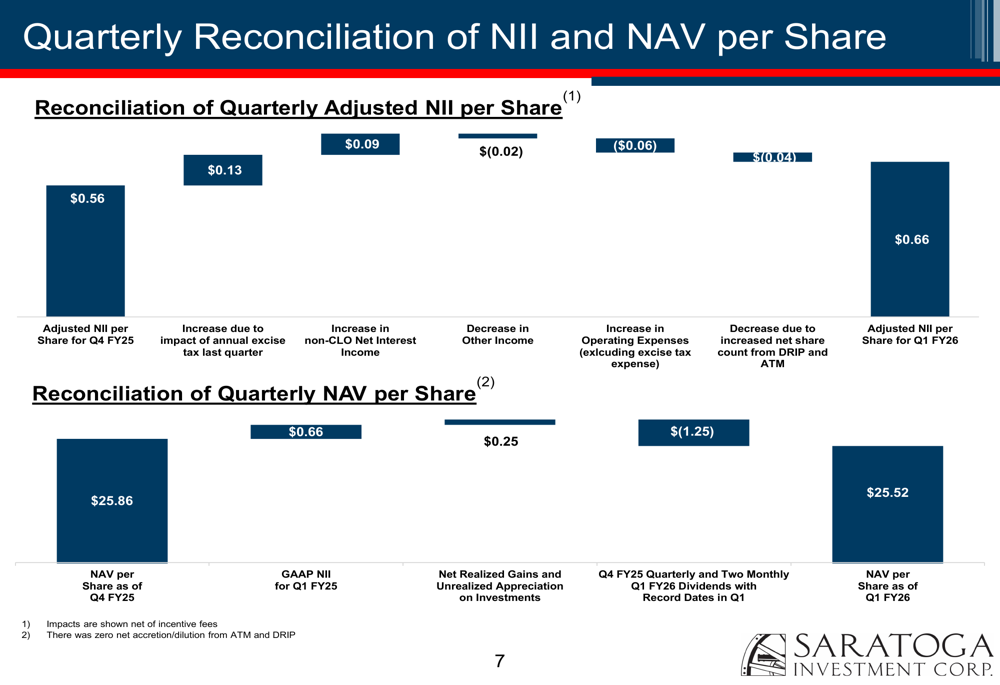
Saratoga reported adjusted net investment income (NII) of $10.1 million for Q1 FY2026, representing a 26.2% increase from the previous quarter’s $8.0 million. Adjusted NII per share rose to $0.66, up 17.9% from $0.56 in Q4 FY2025, showing a meaningful recovery from the previous quarter’s disappointing performance that had missed analyst expectations.
As shown in the following comprehensive overview of key performance metrics:
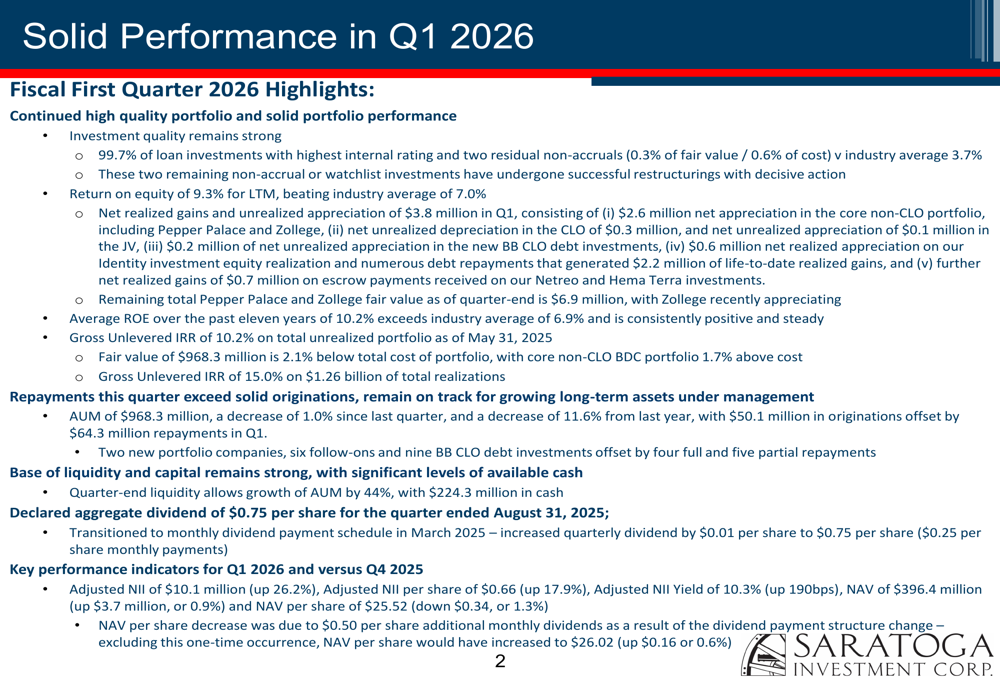
The company’s portfolio quality remained exceptionally strong, with 99.7% of loan investments maintaining the highest internal rating. Only two investments remain on non-accrual, representing just 0.3% of fair value and 0.6% of cost. This quality metric remained unchanged from the previous quarter.
Saratoga’s assets under management (AUM) stood at $968.3 million, reflecting a slight 1.0% decrease from the previous quarter and an 11.6% reduction year-over-year. This reduction resulted from repayments ($64.3 million) exceeding new originations ($50.1 million) during the quarter.
Detailed Financial Analysis
The company’s financial performance showed mixed results when comparing quarter-over-quarter improvements against year-over-year metrics. While NII improved significantly from the previous quarter, it remained below the same quarter last year.
The detailed quarterly financial performance is illustrated in the following table:
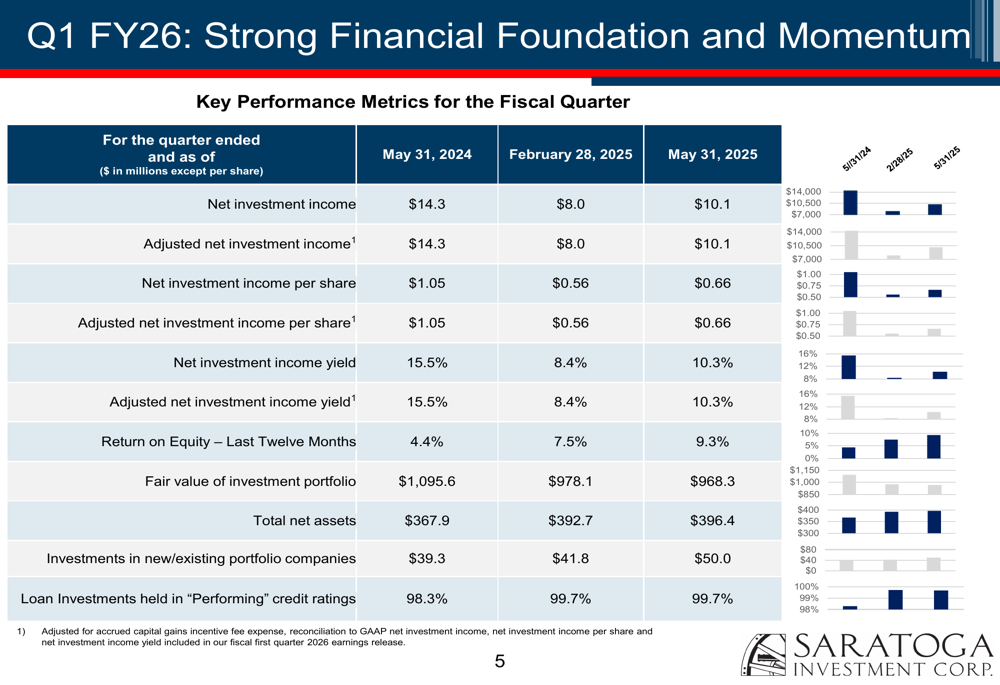
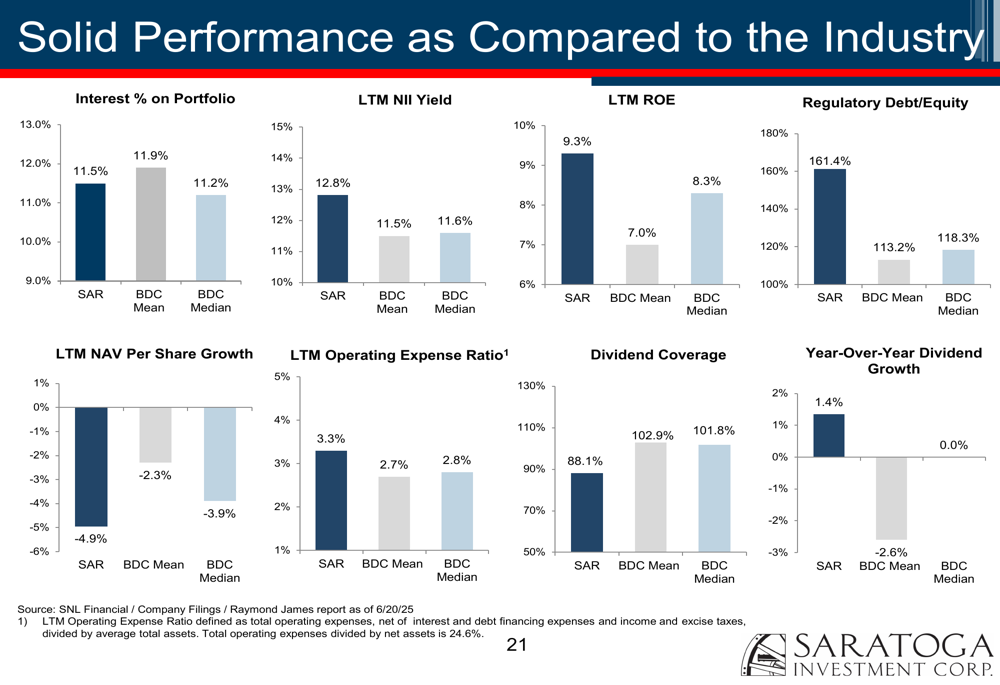
Net Asset Value (NAV) increased to $396.4 million, up $3.7 million or 0.9% from the previous quarter, though NAV per share decreased by 1.3% to $25.52, primarily due to the company’s dividend payments. The company’s return on equity for the last twelve months improved to 9.3%, up from 7.5% in the previous quarter and significantly higher than the industry average of 7.0%.
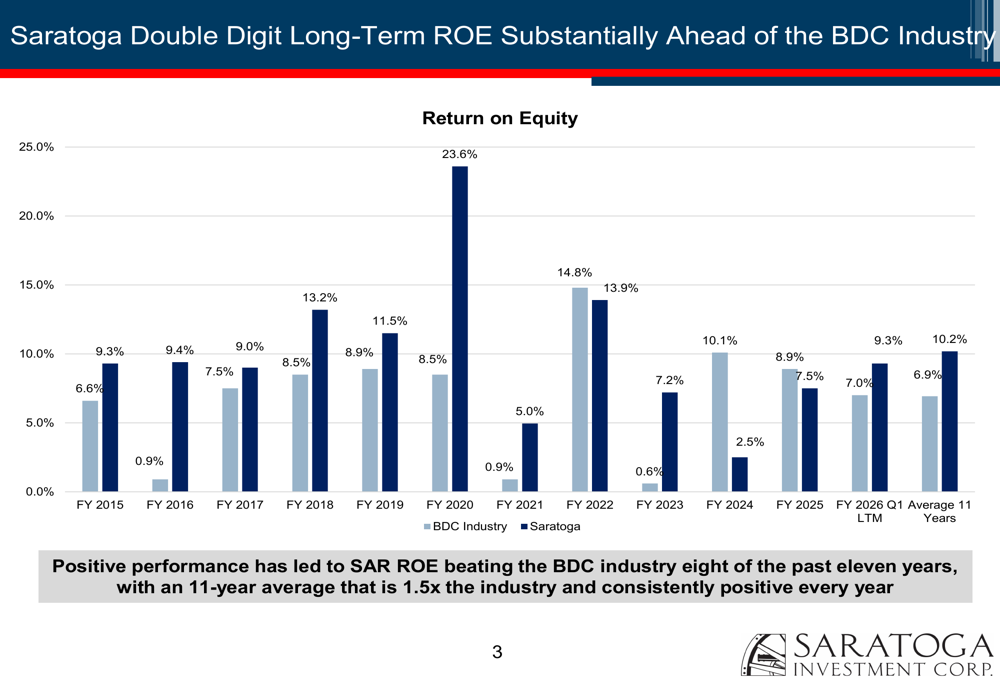
The following chart illustrates Saratoga’s consistent outperformance in ROE compared to the BDC industry average:
Saratoga’s portfolio composition remains heavily weighted toward first lien loans (86.9%), followed by common equity (7.9%), structured finance securities (2.8%), unsecured loans (1.7%), and second lien (0.7%). This conservative approach helps maintain portfolio quality while delivering a weighted average current yield of 10.7%.
The portfolio composition and yield are visualized in the following charts:
Liquidity and Capital Position
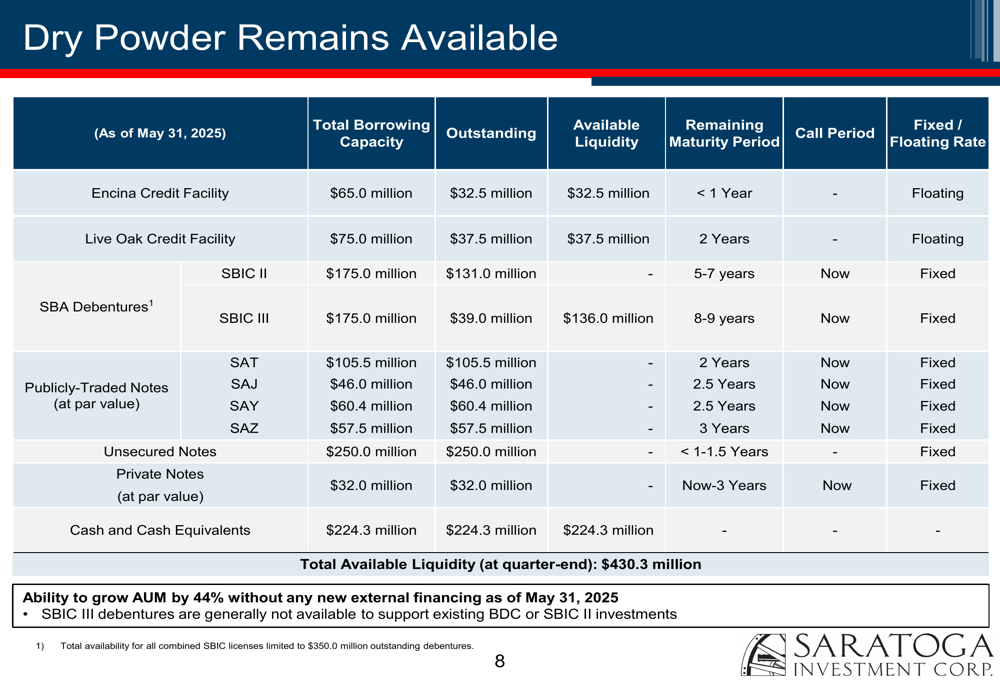
Saratoga maintained a strong liquidity position with $224.3 million in cash and cash equivalents at quarter-end. Combined with available credit facilities and SBIC debentures, the company reported total available liquidity of $430.3 million, providing significant capacity for future growth.
The detailed breakdown of the company’s borrowing capacity and liquidity is shown here:
This strong liquidity position allows Saratoga to potentially grow its AUM by 44%, providing flexibility to capitalize on attractive investment opportunities while maintaining a conservative leverage profile.
Competitive Industry Position
Saratoga continues to outperform its peers in several key metrics. The company’s last twelve months ROE of 9.3% exceeds the industry average of 7.0%, and its average ROE over the past eleven years (10.2%) significantly outpaces the industry average of 6.9% for the same period.
The company’s performance against industry benchmarks across multiple metrics is illustrated in the following comparison:
Saratoga’s total return has also outperformed the BDC index, delivering a 22% return compared to the index’s 3% over the last twelve months. This outperformance highlights the company’s effective investment strategy and management execution despite market challenges.
Strategic Initiatives and Dividend
A significant development in Q1 FY2026 was Saratoga’s transition to a monthly dividend payment schedule, while maintaining a quarterly dividend declaration. The company declared an aggregate dividend of $0.75 per share for the quarter ending August 31, 2025.
The company’s dividend history shows consistent growth over time, as illustrated in this chart:
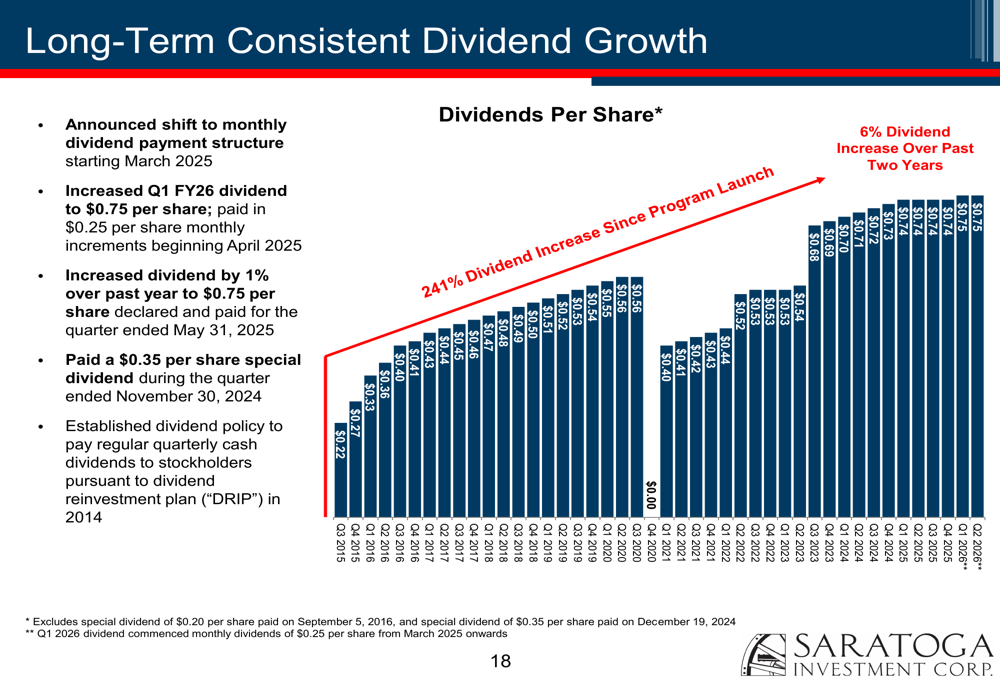
This dividend structure change comes as Saratoga focuses on expanding its asset base and increasing its capacity to source and analyze potential investments. Management emphasized their commitment to achieving growth in net asset value, return on equity, earnings per share, and stock value.
Forward-Looking Statements
Looking ahead, Saratoga’s management remains cautiously optimistic despite economic uncertainties. The company’s deal pipeline shows 670 deals sourced in the last twelve months through Q2 2025, with 43 term sheets issued and 29 deals executed. This represents a recovery in deal flow compared to previous periods.
The company’s competitive advantages position it well for future growth, including its strong long-term dividend, solid return on equity, low-cost available liquidity, and attractive risk profile. Management highlighted that Saratoga is well-positioned for potential changes in interest rates and maintains limited exposure to volatile sectors like oil and gas.
While the presentation emphasized recovery and strength, investors should note that Saratoga is still working to fully rebound from its disappointing Q4 FY2025 performance. The improvement in NII and maintained portfolio quality suggest positive momentum, but the company will need to demonstrate consistent performance in coming quarters to fully regain investor confidence.
Full presentation:
This article was generated with the support of AI and reviewed by an editor. For more information see our T&C.